Abstract
The analysis of archaeol is necessary in order to obtain greater knowledge about their presence in feces. This study was conducted to explore the capability of using data obtained from two spectroscopic methods, UV-Vis and FTIR, and from electrochemical sensors to determine the composition of cattle feces. Principal component analysis and correlation analysis using spectral data were used. By combining spectral and compositional data, useful calibrations were developed. These calibrations can be used to rapidly predict the constituents of new samples. On the basis of the results obtained here, electrochemical sensors were found to be successful in the rapid determination of archaeol and several other parameters in feces.
1. Introduction
Livestock methane emissions make an important contribution to human-caused greenhouse gas emissions. The reduction of such emissions by means of animal breeding and management strategies is crucial to improving the environmental footprint of livestock. Therefore, ruminal methane production is emerging as an important parameter in cattle [1]. The use of conventional detection materials and/or classical analysis techniques for the determination of specific compounds is becoming obsolete due to the complexity of the measurement, the cost of the equipment, the need for qualified personnel and sample pretreatment, etc. For this reason, the food industry is immersed in the fourth industrial revolution, called Industry 4.0, based on the use of intelligent systems that allow for all stages of production to be controlled, including materials, processes, and products—controlled that is, from raw materials to the end product, autonomously and interconnectedly. The purpose of all this is to guarantee the quality of production, avoid fraud, and reduce the environmental impact. This requires the combining of control systems (usually sensors) with networked software systems [2]. At the same time, nanoscience and nanotechnology have acquired great importance in current science due to the fact that they allow for the obtaining of cheap sensors that are easy to install in situ. With all this, it is expected that the scope of nanotechnological advances will be such that they will allow for the development of completely new methods and their implementation in all types of industries [3]. It is intended that the developed devices allow for the evaluation of parameters that determine the emission of greenhouse gases (GHG) from livestock through portable, reusable, and non-polluting automated systems, regardless of the need for pre-treatment of the samples and therefore of qualified personnel, making measurements in real time and thus reducing costs [4,5,6,7].
Electrochemical sensors present properties such as stability, precision, repeatability, low cost, the possibility of miniaturization, and portability, among others. These properties are highly demanded in the food industry for quality control. In turn, the use of nanomaterials or combinations between materials (that favor synergies in their electrocatalytic activity), applied via new preparation methodologies, will allow for the obtaining of more effective arrays [8,9]. Methanogenic markers appear in concentrations of very low orders of magnitude, which is why the introduction of nanomaterials is so necessary; it allows for the detection of trace-level components. Once the optimal combination of biosensors with the appropriate hardware and pattern recognition software has been selected, an electronic tongue capable of meeting the required needs will be obtained. These reusable devices will improve security and control levels at an industrial and environmental level in an affordable, reliable, and non-destructive way. Their function will be to evaluate the quality of the final product in relation to the environmental impact generated by the cattle throughout its production. For this reason, it is intended that these new, improved systems make it possible to record reliable data, process the signals, and locate the relevant information among large amounts of data, thus facilitating the classification and interpretation of the information [10,11].
Nowadays, a simple, fast, and reliable method of quantifying methane production is required to identify low- and high-emitting animals on farms. Several researchers have pointed to the interest in finding markers present in feces that could be used as indicators for individual methane emission. It has been reported that fecal archaeol (1,2-di-O-phytanyl-sn-glycerol) is a potential biomarker for enteric methane production in cattle [4,12]. However, the capability of this parameter to predict methane emissions is still to be proven, and acquiring deeper knowledge of the causes of individual variations and the parameter’s correlation with microbiological composition requires further study.
This work proposes the development of a simple sensor based on commercial platinum palate to analyze different types of cattle feces. After the optimization of the measurement conditions and the sample pretreatment, the sensor was used to analyze cattle feces samples obtained from individual cows with different characteristics based on their diet. The discriminatory capability of the sensor, combined with other spectroscopic techniques, was investigated using principal component analysis (PCA).
2. Materials and Methods
2.1. Chemicals
Acetonitrile (99% purity), tetrabutylammonium toluene (TBAT), archaeol, and all the reagents were purchased from Sigma-Aldrich (Saint Louis, MO, USA). Deionized water from MilliQ (Millipore-Sigma Aldrich, Darmstadt, Germany) (resistivity 18.2 MΩ·cm) was used in all experiments.
2.2. Feces Samples
Feces from 40 cows, either in early lactation (71 days in milk (DIM)) or mid lactation (120 DIM), consuming a diet consisting of 30/70 grass silage/concentrates and 70/30 silage/grass concentrates (dry matter (DM) basis), were included in the study. Fresh fecal samples were collected per rectum via manual palpation. Samples were placed in individual containers labeled with the numeric identifier for each cow. Feces collected in the farm were dried and frozen at −20 °C until analysis. Thawing was carried out by moving the samples from −20 °C to +4 °C for 24 h. Then, samples were left at room temperature until they were completely unfrozen. Extracts were prepared by adding 10 mL of acetonitrile to 1 g of the corresponding sample followed by sonication during 3 min (4 cycles of 30 s pulse of 20% frequency and 15 s of stop). The supernatant was then collected and filtered.
2.3. Instruments
UV-Vis spectra were registered using a Shimadzu UV-2600. Fourier transform infrared (FTIR) spectra were obtained using a FTIR 6600 Jasco spectrophotometer from 400 to 4000 cm−1 at a resolution of 4 cm−1 and 1000 scans. The feces extracts were spread on a horizontal ATR accessory equipped with a diamond crystal heated at 80 °C. The spectrum was recorded after automatic subtraction of the background spectrum before being used for quantitative analysis.
Electrochemical experiments were conducted using a PGSTAT128 (Autolab Metrohm, Utrecht, Netherlands) potentiostat/galvanostat with a conventional three-electrode cell. Experiments were carried out in an organic environment using acetonitrile as the solvent and 0.1 M tetrabutylammonium toluene (TBAT) as the electrolyte. The reference electrode was an Ag|AgNO3/TBAT-saturated electrode, and the working and counter electrodes were Pt plates. The working electrodes were purchased from Dropsen. Differential pulse voltammograms (DPV) were recorded with a scan rate at 0.1 V∙s−1 in the potential range of −0.1 to +1.0 V.
2.4. Multivariate Analysis
MATLAB R2021a (The Math-works Inc., Natick, MA, USA) was used to analyze the multivariate data. The number of variables was decreased to 10 coefficients per voltammogram using a feature extraction technique based on “bell-shaped-windowing” curves known as “kernels”. For the purpose of identifying sample patterns and differences amongst feces samples, these factors were employed as the input variables for principal component analysis (PCA) [13].
3. Results and Discussion
3.1. UV-VIS and FTIR Spectroscopy
Figure 1a shows the UV-Vis spectra of some extracts that are characterized by an intense band al 420 nm (accompanied by two shoulders at 420 and 470 nm) followed by a medium intensity band at 675 nm. Other minor bands are observed in the 500–650 nm region. Due to the complexity of the composition of feces, it is difficult to correlate these bands with specific components. However, important variations are observed from one sample to another. Absorption of 420–430 nm rendered the feces yellow (i.e., flavonoid compounds). These differences can be amplified via multivariate methods, and the results can be used to discriminate between samples with different characteristics and to find correlations between parameters related to cow feeding and “state” and chemical parameters measured by traditional analytical techniques.
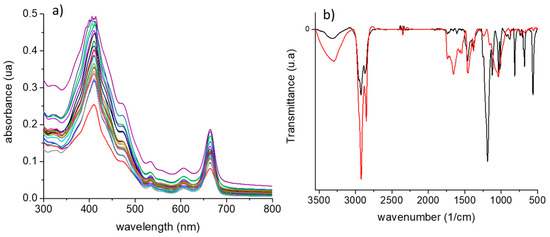
Figure 1.
(a) UV-Vis spectra of the extracts obtained from manure. (b) FTIR spectra for a representative sample of feces in the presence of commercial archaeol (black) and in the absence of commercial archaeol (red).
The assignments of the bands were carried out based on the previous literature [14,15,16]. All the feces samples contained broad and intense -OH stretch bands at 3335 cm−1, originating from diverse organic macromolecules such as cellulose. The band at 3275 cm−1 can be assigned to the NH- vibration of amines. A small band at 3010 cm−1 has been assigned to the double bound of unsaturated oils. The asymmetric and symmetric CH2 stretching bands with maxima at 2920 cm−1 and 2850 cm−1 are produced by the backbone of many macromolecules, such as lignin or hemicellulose. The peaks that appeared in the 1750–1600 cm−1 region (related to the C=O stretch of carboxylic groups and aldehydes or ketones) and the peak at 1240 cm−1 (aromatic C-O-C stretch) can be associated with the presence of carboxylic groups in proteins and to ketone and aldehyde groups in lignin, cellulose, and hemicellulose. Bands in the range between 1550 and 1310 cm−1 were related to aromatic C=C, C–H bends, and C–H deformations. The bands at 1240 cm−1 (CH- aromatic) were from lignin [16]. Other authors have assigned more specific vibrations carotenoid peaks at 1007, 1157, and 1524 cm−1; cellulose peaks at 890, 1090, and 1380 cm−1; and lignin peaks at 1600 and 1675 cm−1 [17]. Bands at 1493, 1373, 1495, and 1374 cm−1 corresponded to stretching vibrations of C–N and C-C bonds, which indicate the presence of proteins [18]. Figure 1b shows the spectrum of one sample after and before the addition of archaeol.
3.2. Electrochemical Sensor
The first approach to electrochemical detection of archaeol in feces was to optimize the electrochemical signal of the samples to increase the concentration of the analyte. Figure 2 shows the differential pulse voltammetry (DPV) responses of a representative sample to increasing the concentration of archaeol in acetonitrile using 0.1 M TBAT as the electrolyte. As shown in Figure 2, an oxidation peak appears at about −0.2 V. A variation in the peak position has been observed depending on the sample; however, in all cases, the intensity of the peaks increases with the archaeol concentration in the range between which a linear relationship was found. From the regression results, the limit of detection (LOD) has been calculated following the 3·σ/m criterion. An LOD of around 3 × 10⁻⁷ M was obtained with a standard deviation of around 4% for all the samples.
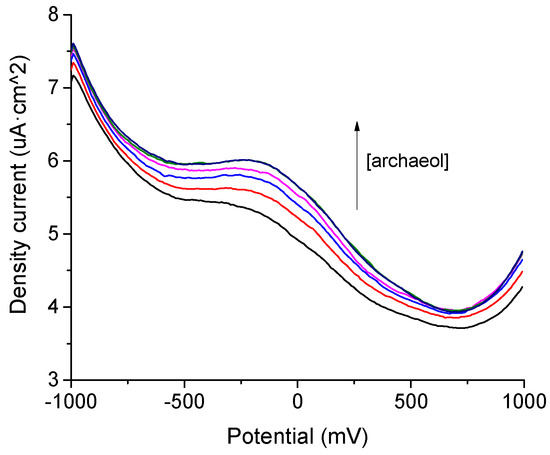
Figure 2.
DPV response for a representative sample of feces in the presence of increased concentration of archaeol (2·10−6, 9·10−6, 2·10−5, 4·10−4, 8·10−4 M).
3.3. Principal Component Analysis (PCA)
PCA was performed to evaluate the discrimination ability of the multivariate system. Figure 3 shows the score plot of this analysis, in which the first three principal components jointly explained 97% of data variability (89% by PC1, 7% by PC2, and 1% by PC3). It is clear that the discrimination between feces samples is dominated by the type of diet of the cows. As is shown, the response of the signals obtained from the feces of cows fed with 30/70 silage/grass concentrate are concentrated on the left of the diagram, denoting a clear differentiation between samples depending on the diet. This result implies that the method used is apt to discriminate between the selected samples with high precision.
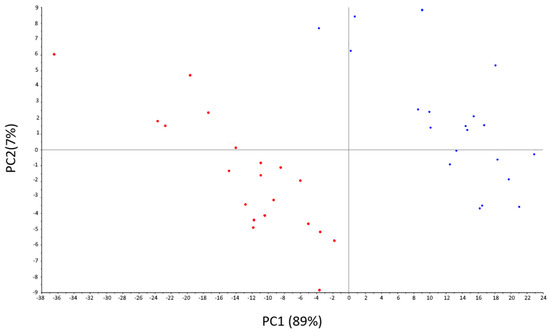
Figure 3.
Scores’ plot of a PCA based on all the measurements performed to characterize all the samples.
4. Conclusions
This project works via the application of automatic learning methods for data analysis, with the aim of developing easily manageable analytical devices at an industrial scale. The theoretical basis consists of designing systems (through supervised and unsupervised methodologies) with which to identify patterns and make decisions with the capacity to classify and discriminate data without the need for human intervention. In addition, this project aims to achieve a large scope via the small-scale technology transfer to the industrial level.
The advantages proposed for the future are based on the implementation of automatable and portable devices capable of conducting measurements in real time and without requiring the pre-treatment of samples on farms or production plants. This is to ensure better control and characterization of raw materials and final products depending on the feeding of the livestock, to exhaustively control the evolution of individual methanogenic emissions throughout the production process, to precisely control environmental contamination by generating quantitative data instantly, and to reduce costs in GHG detection systems through the application of simple and non-invasive processes.
Author Contributions
C.S.-C.: conceptualization, methodology, investigation, writing—review and editing. C.P.-G.: data curation, writing, software, formal analysis. C.G.-C.: supervision, funding acquisition. M.L.R.-M.: project administration, supervision, resources, writing—review and editing, funding acquisition. All authors have read and agreed to the published version of the manuscript.
Funding
This research received no external funding from MICINN Plan Estatal (PID2021-122365OB-100), Junta de Castilla y Leon- FEDER VA202P20, CLU-2019-04, and “Infraestructuras Red de Castilla y León (INFRARED)” UVA01. Plan Tractor En Materiales Avanzados Enfocado A Los Sectores Industriales Claves En Castilla Y León: Agroalimentario, Transporte, Energía Y Construcción (MA2TEC).
Institutional Review Board Statement
Not applicable.
Informed Consent Statement
Informed consent was obtained from all subjects involved in the study.
Data Availability Statement
Not applicable.
Acknowledgments
We appreciate the financial support. We would also like to thank the Calidad Pascual farm (Aranda de Duero) for the loan of samples (ALIVAC-IDI-20211051).
Conflicts of Interest
The authors declare no conflict of interest.
References
- Negussie, E.; de Haas, Y.; Dehareng, F.; Dewhurst, R.J.; Dijkstra, J.; Gengler, N.; Morgavi, D.P.; Soyeurt, H.; van Gastelen, S.; Yan, T.; et al. Invited review: Large-scale indirect measurements for enteric methane emissions in dairy cattle: A review of proxies and their potential for use in management and breeding decisions. J. Dairy Sci. 2017, 100, 2433–2453. [Google Scholar] [CrossRef] [PubMed]
- Schütze, A.; Helwig, N.; Schneider, T. Sensors 4.0—Smart sensors and measurement technology enable Industry 4.0. J. Sens. Sens. Syst. 2018, 7, 359–371. [Google Scholar] [CrossRef]
- Aksnes, A. Sensors for Environment, Health and Security. Advances Materials and Technologies; Springer: Berlin/Heidelberg, Germany, 2009; pp. 191–203. [Google Scholar]
- Gill, F.L.; Dewhurst, R.J.; Evershed, R.P.; McGeough, E.; O’Kiely, P.; Pancost, R.D.; Bull, I.D. Analysis of archaeal ether lipids in bovine faeces. Anim. Feed Sci. Technol. 2011, 166–167, 87S–92S. [Google Scholar] [CrossRef]
- McCartney, C.A.; Bull, I.D.; Yan, T.; Dewhurst, R.J. Assessment of archaeol as a molecular proxy for methane production in cattle. J. Dairy Sci. 2013, 96, 1211–1217. [Google Scholar] [CrossRef] [PubMed]
- Kuhla, G.B.; Krattenmacher, N.; Thaller, G.; Metges, C.C. Technical note: Analytical refinements of the methane indicator archaeol in bovine feces, rumen fluid, and feedstuffs. J. Dairy Sci. 2016, 99, 9313–9318. [Google Scholar]
- Schwarm, A.; Schweigel-Röntgen, M.; Kreuzer, M.; Ortmann, S.; Gill, F.; Kuhla, B.; Meyer, U.; Lohölter, M.; Derno, M. Methane emission, digestive characteristics and faecal archaeol in heifers fed diets based on silage from brown midrib maize as compared to conventional maize. Arch. Anim. Nutr. 2015, 69, 159–176. [Google Scholar] [CrossRef] [PubMed]
- Tounsi, A.; Midhat, L.; El Ghazali, A.; Ouatiki, E.; El Idrissi, M. Electrochemical Sensors for Food Quality and Safety. In Nutrition and Human Health: Effect and Enviromental Impacts; Springer: Berlin/Heidelberg, Germany, 2022; pp. 111–129. [Google Scholar]
- Mahsa, M.; Manisha, S.; Anthony RJ, P.; Paul, A.K. Electrochemical Methods for the Analysis of Milk. J. Agric. Food Chem. 2022, 70, 2427–2449. [Google Scholar]
- Mercante LAMattoso, L.H.C.; Correa, D.S. Detection of trace levels of organophosphate pesticides using an electronic tongue based on graphene hybrid nanocomposites. Talanta 2017, 167, 59–66. [Google Scholar]
- Tan, J.; Xu, J. Applications of electronic nose (e-nose) and electronic tongue (e-tongue) in food quality-related properties determination: A review. Artif. Intell. Agric. 2020, 4, 104–115. [Google Scholar] [CrossRef]
- Johnson, K.A.; Johnson, D.E. Methane emissions from cattle. J. Anim. Sci. 1995, 73, 2483–2492. [Google Scholar] [CrossRef] [PubMed]
- Tiwari, M.D. Communications in Computer and Information Science: Preface. Information Computing and Applications; Springer: Berlin/Heidelberg, Germany, 2013. [Google Scholar]
- Smidt, E.; Eckhardt, K.; Lechner, P.; Schulten, H.R.; Leinweber, P. Characterization of different decomposition stages of biowaste using FT-IR spectroscopy and pyrolysis-field ionization mass spectrometry. Biodegradation 2005, 16, 67–79. [Google Scholar] [CrossRef] [PubMed]
- Nopp-Mayr, U.; Zohmann-Neuberger, M.; Tintner, J.; Kriechbaum, M.; Rosenberger, R.; Nopp, H.; Bosa, A.; Smidt, E. From plants to feces: Pilot applications of FTIR spectroscopy for studies on the foraging ecology of an avian herbivore. J. Ornithol. 2020, 161, 203–215. [Google Scholar] [CrossRef]
- Thomas, V.H.; Veronica, B.; Stefaan, D.S. Lipid and Protein Oxidation during in Vitro Gastrointestinal Digestion of Pork under Helicobacter pylori Gastritis Conditions. J. Agric. Food Chem. 2018, 66, 13031–13040. [Google Scholar]
- Altangerel, N.; Ashley, C.; Hemmer, P.R.; Kraemer, D.; Scully, M.O.; Walker, J.W.; Quadros, D.G. Raman spectroscopy of fresh feces is a practical tool for identifying animal species and estimating diet characteristics. Anim. Feed Sci. Technol. 2021, 281, 115081. [Google Scholar] [CrossRef]
- Mahesh, M.C.; Shivayogeeswar, E. Neelagund Effect of Sheep and Goat Fecal Mediated Synthesis and Characterization of Silver Nanoparticles (AgNPs) and Their Antibacterial Effects. J. Nanofluids 2018, 7, 309–315. [Google Scholar]
Disclaimer/Publisher’s Note: The statements, opinions and data contained in all publications are solely those of the individual author(s) and contributor(s) and not of MDPI and/or the editor(s). MDPI and/or the editor(s) disclaim responsibility for any injury to people or property resulting from any ideas, methods, instructions or products referred to in the content. |
© 2023 by the authors. Licensee MDPI, Basel, Switzerland. This article is an open access article distributed under the terms and conditions of the Creative Commons Attribution (CC BY) license (https://creativecommons.org/licenses/by/4.0/).