Abstract
Self-assembled MnO2 nanowires were hydrothermally synthesized and electrically characterized under different conditions. The nanowires were approximately 3–10 µm long and about 20–100 nm in diameter. Single nanowires were aligned perpendicularly across two parallel gold electrode transducers by means of the dielectrophoresis (DEP) technique. Resistivity changes in synthetic air, nitrogen, and NO2 were tested in a range from 100 °C up to 300 °C. The resistivity changes were observed to account for the oxygen reduction on the NWs’ surface as the electrons were moving from the NWs to the oxygen. The resistivity was explored through a constant current arrangement test. Based on the resistivity changes, electrical properties, such as activation energy and type of semiconductor, were estimated.
1. Introduction
Manganese, a transition metal, can form a range of semiconducting oxides with oxidation states from +2 to +7. Manganese dioxide is a suitable candidate for photo-catalysis, sensors, supercapacitors, etc., with different crystalline phases like α-MnO2, β-MnO2, γ-MnO2 and δ-MnO2 [1]. Diverse deposition techniques of nanostructured MnO2, such as plasma-enhanced chemical vapor deposition (PE-CVD) [2], electrochemical deposition [3] or hydrothermal deposition [4] are established. Although MnO2 is an abundant, low-cost and environmentally friendly semiconductor, only a limited number of reports were dedicated to manganese dioxide gas sensors. Resistive MnO2 response towards, e.g., ethanol [1,5], NH3 [6,7], H2 or warfare agents [8,9] adsorption/desorption was tested. Only few studies have been conducted recently regarding MnO2 as a NO2 chemoresistive sensor, e.g., [3,10]. The NO2 detection limit was 5 ppm [3]. Herein, hydrothermally prepared single standing α-MnO2 nanowires (NWs) were tested for the first time in terms of their resistivity changes and NO2 gas adsorption/desorption processes. The analyzed concentration range was 0.1 to 11 ppm. The temperature sensing range was 100–300 °C at the concentration of 11 ppm NO2 in synthetic air (SA).
2. Materials and Methods
2.1. Sample Preparation and Stabilization
MnO2 NWs (about 3–10 µm long and about 20–100 nm wide) were prepared hydrothermally according to our previous study by Claros et al. [11]. Comparing X-ray diffraction (XRD) peaks and ICDD card No. (44-0141) of our MnO2 NWs with XRD pattern and ICDD card number collected by Wang and Li [4], α-phase might be attributed to our MnO2 NWs. Brown NW powder was suspended in water and redeposited by dielectrophoresis [12] on two parallel gold electrodes with separation distance of 4 or 6 µm. Single nanowires standing perpendicularly to the electrodes were observed via scanning electron microscopy (SEM), whereas large bunches were removed using focused ion beam. These sensor chips were characterized in a test chamber (140 cm3 volume) at constant gas flow. A heater with thermocouple was used to control the temperature, and constant current was applied to the NWs (Keithley 2401 SourceMeter) to monitor the resistance. The NWs’ response to NO2 gas ambient was tested at diverse temperatures and concentrations. The measurements were performed on two diverse samples with 1 or 3 MnO2 NWs. The entire cross-sectional area was 9.5 × 10⁻³ µm2 or 98.2 × 10⁻³ µm2, respectively. The NWs’ length was about 4 or 6 µm, equal to the gold electrodes gap. The nanowires were initially stabilized at 300 °C for 3 h at potentially up to 0.5 V under synthetic air (SA) flow of 50 sccm.
2.2. Thermal Resistivity Analysis
After the initial stabilization, a sample with one MnO2 NW was tested under low constant SA flow (50 sccm) and constant probing current 10 nA. Temperature was set from 25 °C to 300 °C with 10 °C increment in 5 min. Afterwards, the test chamber was purged with N2 for 24 h at 250 °C, followed by 10 h at room temperature to remove oxygen and stabilize the sample. The entire cross-sectional area was 9.5 × 10⁻³ µm2.
2.3. NO2 Thermal Analysis
Sensor resistivity response to NO2 gas (11 ppm in SA) was tested at five different temperatures, 100–300 °C, at constant current 20 nA and constant gas flow 200 sccm. The sensor response was defined as R = RSA/RNO2, where RNO2 is the sensor resistance after NO2 exposure, and RSA represents the sensor resistance baseline. The baseline was average of 5 last minutes before first NO2 exposure obtained at pure SA and given temperature (100–300 °C). The baseline differed with each temperature, and it was defined after 30 min SA purge (200 sccm) at given temperature. Among the five temperature steps, there was always additional stabilization under SA flow at 250 °C for 40 min due to baseline fluctuations and to desorb NO2 from the sensor, which would be slow at low temperatures. Response was further evaluated at 5 to 30 min after the start of the exposure. Each NO2 gas exposure took 30 min. The sensor cross-sectional area was 98.2 × 10⁻³ µm2.
2.4. NO2 Concentration Analysis
The sample with three MnO2 NWs was tested at diverse NO2 concentrations obtained by mixing pure synthetic air (SA) and NO2 (11 ppm in SA) gas. The NO2 concentration was set from 0.1 ppm in SA up to 10 ppm in SA. The sensor cross-sectional area was 98.2 × 10⁻³ µm2. Before the initial NO2 exposure, the sample was further stabilized at the working temperature of 250 °C for 30 min and under pure SA flow (200 sccm). The NO2 concentration was increased at every exposure step from 0.1 ppm up to 10 ppm. A constant NO2 flow of 200 sccm for 10 min was set at each step. After each exposure, the sensor was purged using pure SA (200 sccm flow) for 110 min. Sensor response and recovery were evaluated. As the baseline shift could not be neglected, the baseline RSA was determined from scratch before each NO2 pulse. The baseline was average resistance of 5 last minutes before every NO2 exposure pulse.
3. Results and Discussion
3.1. Thermal Resistivity Analysis
The thermal analysis in a range of 25–300 °C was measured in SA and N2, as shown in Figure 1. In a standard semiconductor, the free charge carriers are thermally activated, meaning the resistivity should follow (if other effects are negligible) the Equation (1):
where ρ is the resistivity, ρ0 is a material constant, Ea is the activation energy and k is the Boltzmann constant. If this simple equation fits the measured data, then the sensor behavior would be highly predictable. In SA, the data fit well up to 220 °C with activation energy 0.2 eV. Above 220 °C, the resistivity starts to deviate from the exponential fit and increases. In nitrogen, the resistivity deviates from the fit above 150 °C and starts to decrease. Under N2, the activation energy was 0.16 eV in the temperature range of 25–150 °C and 0.31 eV in the range of 150–300 °C. P-type semiconductive sensors have lower resistivity in O2 ambient compared with N2 ambient. This is generally explained by the formation of a positively charged accumulation layer (holes accumulation) under the surface where oxygen adsorbs. In some studies, MnO2 oxides were classified as p-type [13], in other studies as n-type semiconductors [9]. We might presume that both types of semiconductive behavior might be possible under certain circumstances. In our previous study [12], we had determined that 24 single-standing MnO2 NWs behaved as p-type semiconductors. However, the number of NWs tested in the present study is 24 times lower than in that work. Moreover, our recent impedance and Mott–Schottky analyses made on one single-standing NW determined that both types of semiconductive behavior are possible at a low frequency range. According to our previous X-ray photoelectron spectroscopy (XPS), the bonding energies in the MnO2 NWs indicate a mainly Mn (IV) oxidation state with a low contribution of Mn (III) [11]. Bonds, such as Mn-O-Mn, Mn-O-H or H-O-H were determined in our NWs by that study. Moreover, it was published elsewhere that among the structural polymorphs, the α (our case) and δ phases exhibit a strongly mixed valent character, with Mn3+ defects being common throughout the structure [14]. Mn3+ defects make it more likely that ionic oxygen species (O−, O2−, O2−) and hydroxyl groups (OH) will form on the MnO2 surface and react with NO2 [3].
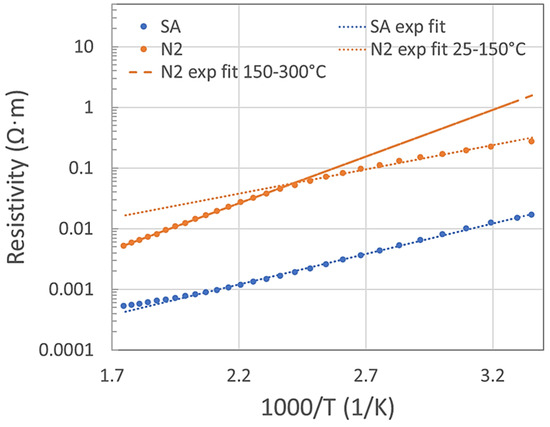
Figure 1.
Arrhenius plot of resistivity vs. temperature range 25–300 °C fitted to Equation (1).
Under N2 ambient conditions, the activation energy below and above 150 °C was different. The reason is not clear, but possibly some structural changes might occur due to the current flow in conjunction with the high temperature, as the MnO2 is a very active material and structural changes are known. For example, Bailey [15] reviewed that MnO2 exists in a variety of structural forms, which include cation vacancies, lower valent manganese ions (particularly Mn3+), structural water (present as protons to accommodate the absence of lower valent manganese species [16,17,18]), and possibly micro-twinning [19], although there is still debate as to its presence [20]. Donne et al. [21] published that the position of individual ionic species, such as Mn4+, Mn3+, O2− or OH− within the MnO2 crystal lattice is not fixed, with proton and electron movement tending towards a homogeneous distribution. Therefore, we think that an elevated ionic and defect mobility in the MnO2 structure, especially at high temperatures, might possibly switch the type of semiconductor behavior. A possible surface reaction of Mn3+ with oxygen might lead to the sudden increase in resistivity to above 220 °C in the O2 ambient environment (see Figure 1).
Additionally, Iwamoto et al. [22] determined that a large amount of oxygen is adsorbed in the MnO2 structure and is related to its low stability associated with redox reactions promoted by variable oxidation states. In general, the unexpected behavior of this type of sensor might be given by its low structural stability.
Additionally, the NW cannot be held at high temperatures (above 250 °C) for more than approximately 40 min, as it leads to an irreversible rapid increase in the resistivity up to unmeasurable values, even though the sample has not shown any damage in SEM imaging. This was the case only during the N2 purge, not under SA or NO2 ambient conditions.
3.2. NO2 Thermal Analysis
NO2 gas sensing (11 ppm) of three MnO2 nanowires at diverse temperatures is shown in Figure 2. We see the thermal activation of the response, which is typical for metal oxide semiconductive sensors. The response increases with temperature. However, in our case, a deviation from that behavior occurred at 300 °C, as the initial resistivity decrease (typical for p-type behavior) was followed up with an unexpected resistivity increase after about 10 min of NO2 exposure. Again, some structural changes at 300 °C might be a reason for this phenomenon. The sensor response to 11 ppm NO2 reached its maximum at 250 °C, being almost 1.07. Baseline resistivity instabilities (especially unexpected and random resistivity increases in SA at 200 and 300 °C) might indicate structural changes too. It was not possible to properly evaluate the recovery process due to the baseline instabilities; however, it seems that after 30 min exposure to NO2, the 30 min purge by SA might not be long enough.
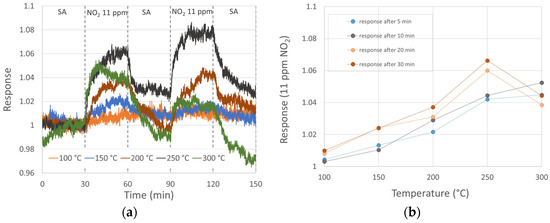
Figure 2.
Sensor response to 11 ppm NO2 at diverse temperatures: (a) sensor response with 30 min NO2 exposure and 30 min SA purge; (b) sensor response after 5, 10, 20 and 30 min of NO2 exposure.
3.3. NO2 Concentration Analysis
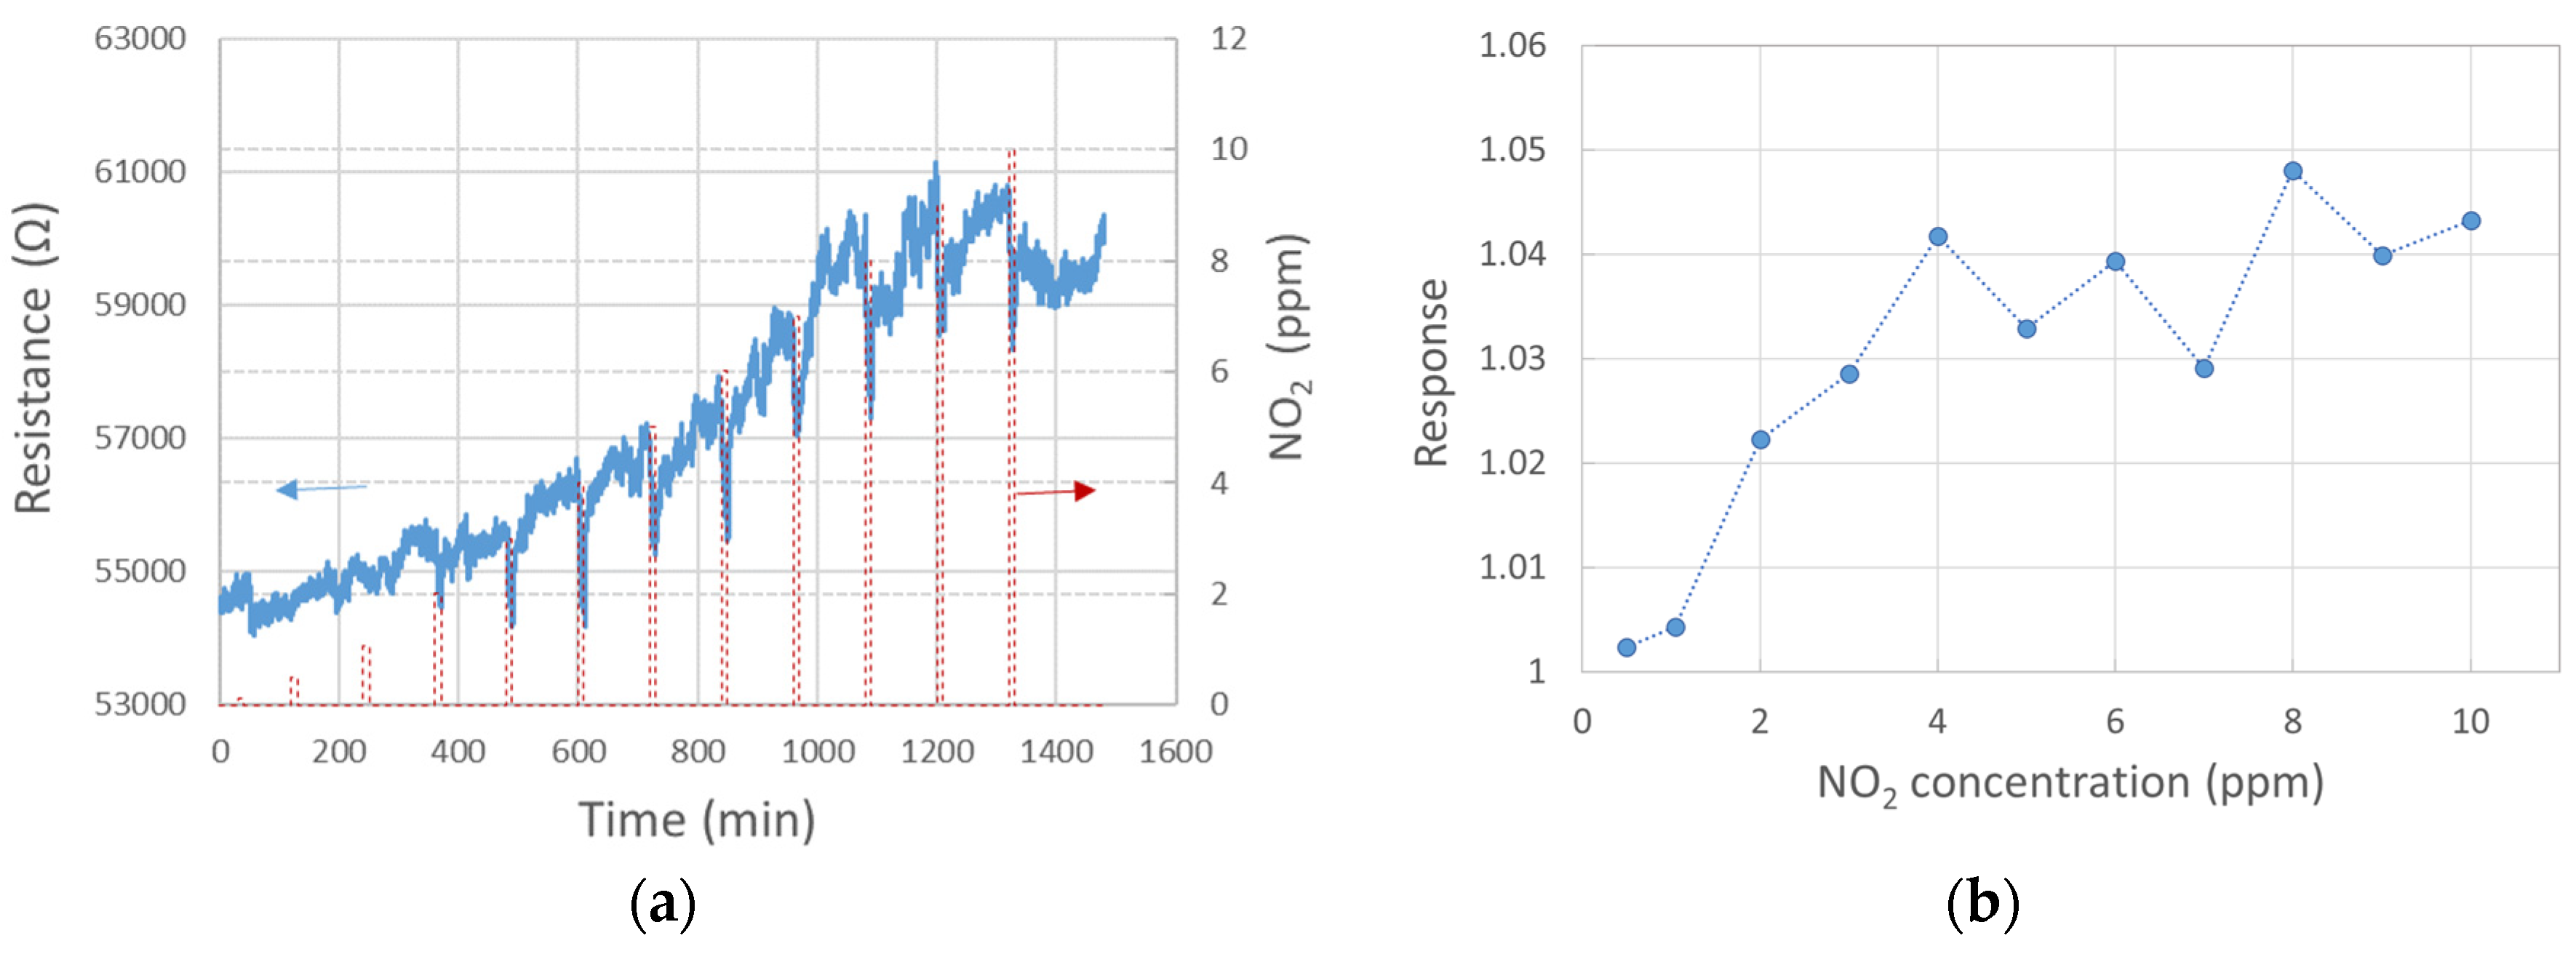
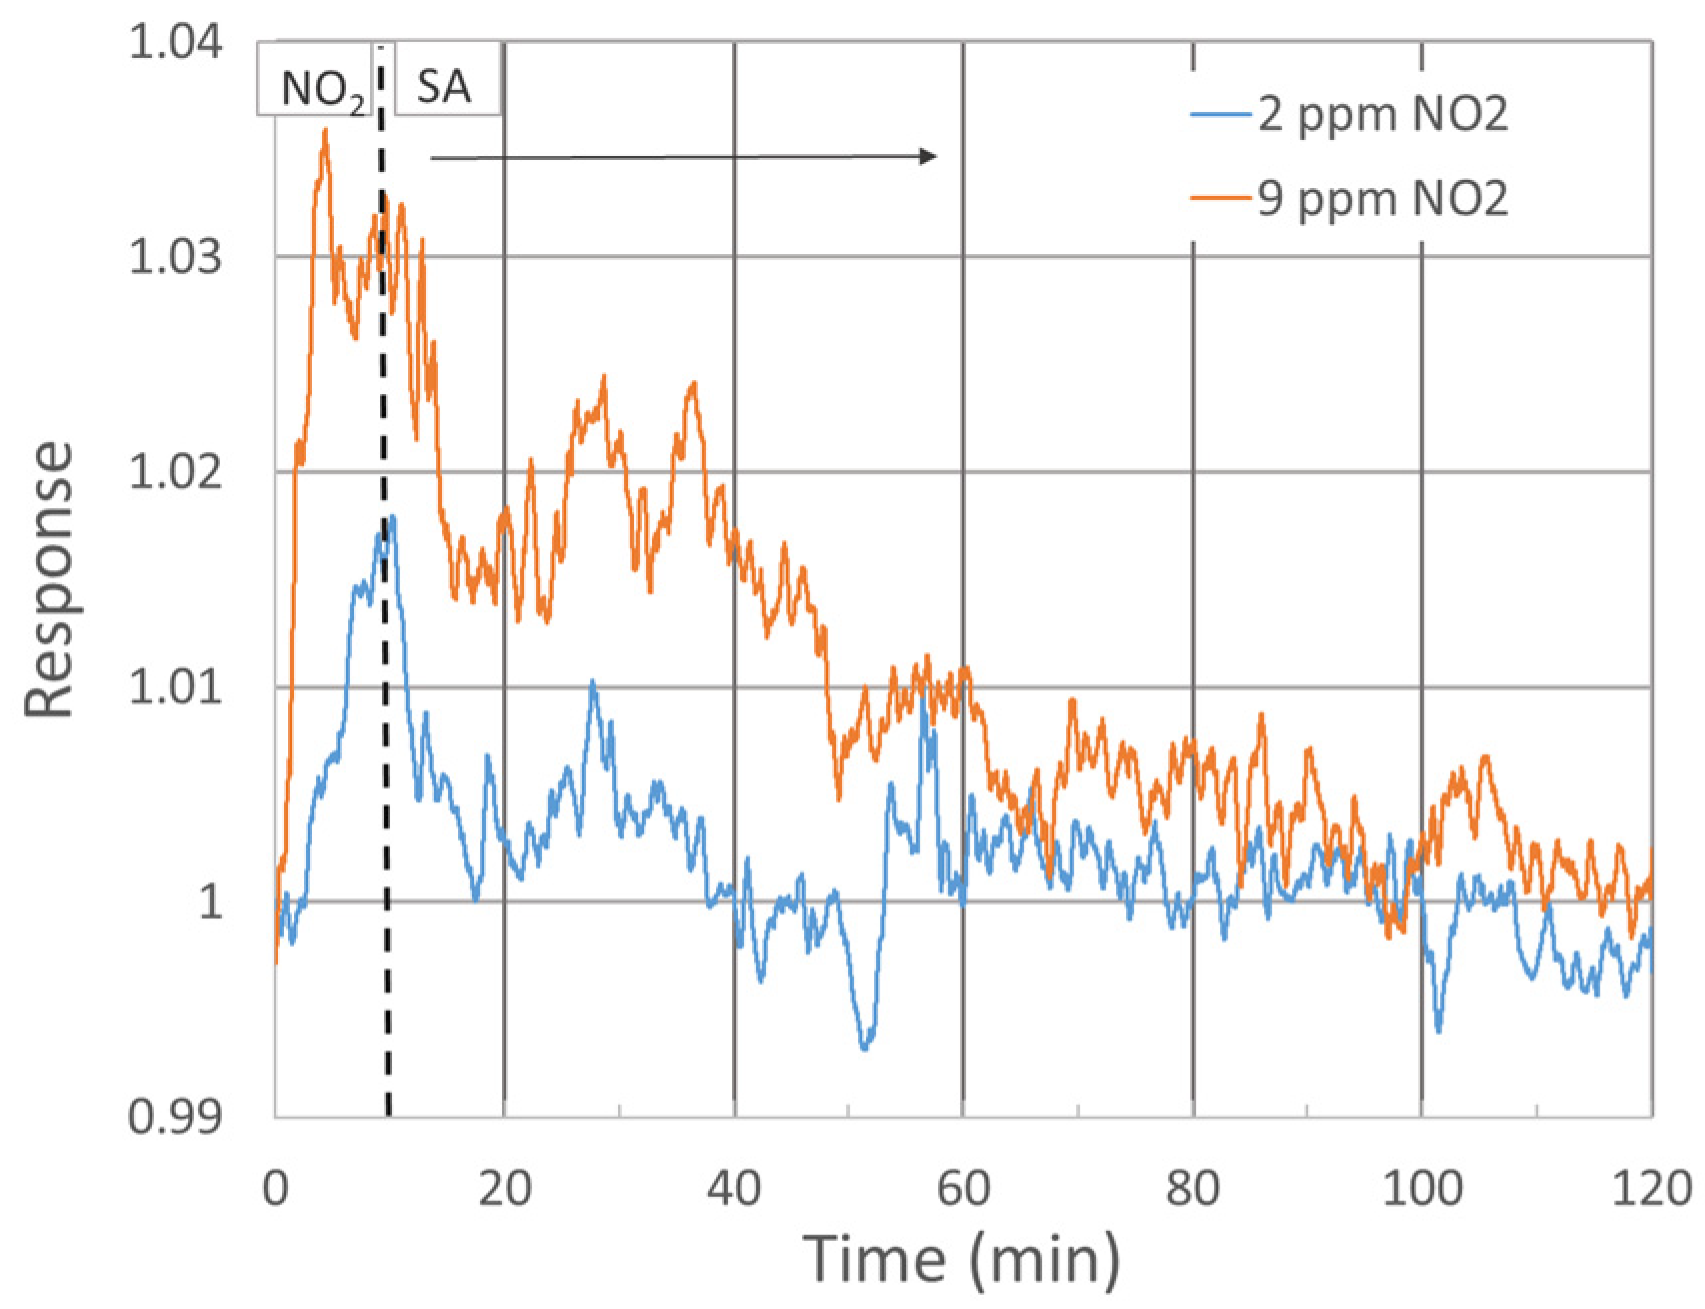
The response of three single-standing MnO2 NWs to NO2 gas at diverse concentrations was studied (see Figure 3). To increase the signal-to-noise ratio, the probing current was raised to 100 nA. The response exhibited a growing trend up to 4 ppm concentration, followed by an almost random value around 1.04 up to 10 ppm concentration, as shown in Figure 3b. Despite the low responsivity when compared with alternate sensors, e.g., WO3-based, the signal-to-noise ratio allows us to detect NO2 clearly already at 2 ppm, with a response of 1.02 at 250 °C. Figure 3a shows the response within 10 min exposure, followed by 110 min of SA purge. Up to about 8 ppm NO2, the baseline resistivity increased rapidly without any hint of returning to the initial value. As this phenomenon would further complicate the NO2 detection at low concentrations, conditions under which the baseline stabilizes should be further tested. Recovery in our experiment was estimated only at two concentrations with more or less stable baselines (2 and 9 ppm NO2), as shown in Figure 4.

Figure 3.
Sensor response at 250 °C to diverse NO2 concentrations: (a) 10 min NO2 exposure followed by 110 min pure SA purge; (b) response to NO2 after 10 min exposure.
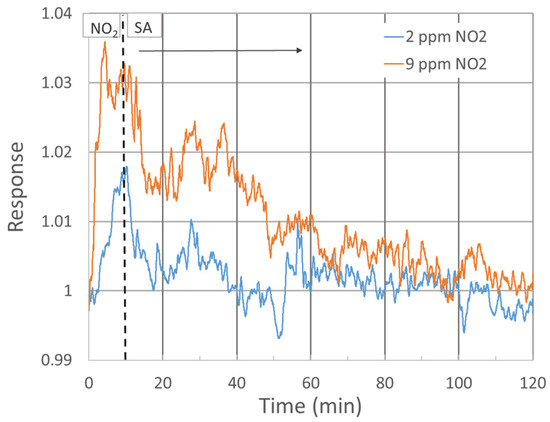
Figure 4.
Sensor response during recovery in pure SA over 110 min after 10 min exposure to 2 and 9 ppm NO2 gas.
4. Conclusions
Single-standing MnO2 nanowires revealed a low stability during the resistive sensing experiments. The resistivity fluctuations might be caused by structural changes because of high ionic and defect mobilities. Conditions under which the baseline stabilizes should be further tested. The sensor response at 250 °C varied from approximately 1.02 up to 1.07 for 2 ppm and 11 ppm of NO2, respectively.
Author Contributions
Conceptualization, H.S. and P.S.; methodology, P.S. and H.S. formal analysis, P.S. and H.S.; investigation, J.H., H.S. and P.S.; resources, O.C. and M.C. writing—original draft preparation, H.S. and P.S.; writing—review and editing, S.V. and P.S.; visualization, H.S.; funding acquisition, J.H. All authors have read and agreed to the published version of the manuscript.
Funding
The work was carried out under the Czech Grant Agency project no. 22-14886S. The CzechNanoLab project LM2023051, funded by MEYS CR, is gratefully acknowledged for the financial support of the sample fabrication at the CEITEC Nano Research Infrastructure.
Institutional Review Board Statement
Not applicable.
Informed Consent Statement
Not applicable.
Data Availability Statement
Not applicable.
Conflicts of Interest
The authors declare no conflict of interest.
References
- Umar, A.; Ibrahim, A.A.; Kumar, R.; Albargi, H.; Zeng, W.; Alhmami, M.A.M.; Alsaiari, M.A.; Baskoutas, S. Gas sensor device for high-performance ethanol sensing using α-MnO2 nanoparticles. Mater. Lett. 2021, 286, 129232. [Google Scholar] [CrossRef]
- Barreca, D.; Gasparotto, A.; Gri, F.; Comini, E.; Maccato, C. Plasma-assisted growth of β-MnO2 Nanosystems as Gas Sensors for Safety and Food Industry Applications. Adv. Mater. Interfaces 2018, 5, 1800792. [Google Scholar] [CrossRef]
- Pedowitz, M.D.; Kim, S.; Lewis, D.I.; Uppalapati, B.; Khan, D.; Bayram, F.; Daniels, K.M. Fast selective sensing of nitrogen-based gases utilizing δ-MnO2-epitaxial graphene-silicon carbide heterostructures for room temperature gas sensing. J. Microelectromech. Syst. 2020, 29, 846–852. [Google Scholar] [CrossRef]
- Wang, X.; Li, Y. Selected-control hydrothermal synthesis of α- and β-MnO2 single crystal nanowires. J. Am. Chem. Soc. 2002, 124, 2880–2881. [Google Scholar] [CrossRef] [PubMed]
- Liu, C.; Navale, S.T.; Yang, Z.B.; Galluzzi, M.; Patil, V.B.; Cao, P.J.; Mane, R.S.; Stadler, F.J. Ethanol gas sensing properties of hydrothermally grown a-MnO2 nanorods. J. Alloys Compd. 2017, 727, 362–369. [Google Scholar] [CrossRef]
- Zhang, W.; Zeng, C.; Kong, M.; Pan, Y.; Yang, Z. Water-evaporation-induced self-assembly of a-MnO2 hierarchical hollow nanospheres and their applications in ammonia gas sensing. Sens. Actuators B Chem. 2012, 162, 292–299. [Google Scholar] [CrossRef]
- Sovizi, M.R.; Mirzakhani, S. Highly sensitive detection of ammonia gas by 3D flower-like γ-MnO2 nanostructure chemiresistor. J. Taiwan Inst. Chem. Eng. 2020, 111, 293–301. [Google Scholar] [CrossRef]
- Xiao, J.; Liu, P.; Liang, Y.; Li, H.B.; Yang, G.W. High aspect ratio β-MnO2 nanowires and sensor performance for explosive gases. J. Appl. Phys. 2013, 114, 073513. [Google Scholar] [CrossRef]
- Bigiani, L.; Zappa, D.; Maccato, C.; Comini, E.; Barreca, D.; Gasparotto, A. Quasi-1D MnO2 nanocomposites as gas sensors for hazardous chemicals. Appl. Surf. Sci. 2020, 512, 145667. [Google Scholar] [CrossRef]
- Shinde, P.V.; Xia, Q.X.; Ghule, B.G.; Shinde, N.M.; Seonghee, J.; Kim, K.H.; Mane, R.S. Hydrothermally grown α-MnO2 interlocked mesoporous micro-cubes of several nanocrystals as selective and sensitive nitrogen dioxide chemoresistive gas sensors. Appl. Surf. Sci. 2018, 442, 178–184. [Google Scholar] [CrossRef]
- Claros, M.; Kuta, J.; El-Dahshan, O.; Michalička, J.; Jimenez, Y.P.; Vallejos, S. Hydrothermally synthesized MnO2 nanowires and their application in Lead (II) and Copper (II) batch adsorption. J. Mol. Liq. 2021, 325, 115203. [Google Scholar] [CrossRef]
- Smisitel, P.; Simunkova, H.; Chmela, O.; Claros, M.; Vallejos, S.; Hubalek, J. Electrical characterization of hydrothermally synthesized metal oxide nanowires with regard to oxygen adsorption/desorption thermodynamics. In Proceedings of the 14th International Conference on Nanomaterials, NANOCON 2022, Brno, Czech Republic, 19–21 October 2022; pp. 64–70. [Google Scholar] [CrossRef]
- Kim, H.-J.; Lee, J.-H. Highly sensitive and selective gas sensors using p-type oxide semiconductors: Overview. Sens. and Actuators B Chem. 2014, 192, 607–627. [Google Scholar] [CrossRef]
- Julien, C.M.; Massot, M.; Poinsignon, C. Lattice vibrations of manganese oxides: Part I. Periodic structures. Spectrochim. Acta Part A Mol. Biomol. Spectrosc. 2004, 60, 689–700. [Google Scholar] [CrossRef]
- Bailey, M.R.; Donne, S.W. Electrochemical impedance spectroscopy study into the effect of titanium dioxide added to the alkaline manganese dioxide cathode. J. Electrochem. Soc. 2011, 158, A802. [Google Scholar] [CrossRef]
- Ruetschi, P. Cation-vacancy model for MnO2. J. Electrochem. Soc. 1984, 131, 2737. [Google Scholar] [CrossRef]
- Ruetschi, P. Influence of cation vacancies on the electrode potential of MnO2. J. Electrochem. Soc. 1988, 135, 2657. [Google Scholar] [CrossRef]
- Ruetschi, P.; Giovanoli, R. Cation vacancies in MnO2 and their influence on electrochemical reactivity. J. Electrochem. Soc. 1988, 135, 2663. [Google Scholar] [CrossRef]
- Chabre, Y.; Pannetier, J. Structural and electrochemical properties of the proton/γ-MnO2 system. Prog. Solid State Chem. 1995, 23, 2737. [Google Scholar] [CrossRef]
- Heuer, A.H.; He, A.Q.; Hughes, P.J.; Feddrix, F.H. Batteries New Technol. ITE Lett. Med. 2000, 1, 926. [Google Scholar]
- Donne, S.W.; Lawrance, G.A.; Swinkels, D.A.J. Redox processes at the manganese dioxide electrode: I. constant-current intermittent discharge. J. Electrochem. Soc. 1997, 144, 2949. [Google Scholar] [CrossRef]
- Iwamoto, M.; Yoda, Y.; Yamazoe, N.; Seiyama, T. Study of metal oxide catalysts by temperature programmed desorption. 4. Oxygen adsorption on various metal oxides. J. Phys. Chem. 1978, 82, 2564–2570. [Google Scholar] [CrossRef]

Disclaimer/Publisher’s Note: The statements, opinions and data contained in all publications are solely those of the individual author(s) and contributor(s) and not of MDPI and/or the editor(s). MDPI and/or the editor(s) disclaim responsibility for any injury to people or property resulting from any ideas, methods, instructions or products referred to in the content. |
© 2023 by the authors. Licensee MDPI, Basel, Switzerland. This article is an open access article distributed under the terms and conditions of the Creative Commons Attribution (CC BY) license (https://creativecommons.org/licenses/by/4.0/).