Proceeding Paper

Indoor Air Measurements with a Low-Cost Air Quality Sensor: A Preliminary Report †

by
Francis Olawale Abulude
1,*,
Arinola Oluwatoyin Gbotoso
2 and
Susan Omolade Ademilua
2
1
Environmental and Sustainable Group (ESRG), Science and Education Development Institute, Akure 340001, Ondo State, Nigeria
2
College Library, Federal College of Agriculture, Akure 340001, Ondo State, Nigeria
*
Author to whom correspondence should be addressed.
Presented at the 2nd International Electronic Conference on Chemical Sensors and Analytical Chemistry, 16–30 September 2023; Available online: https://csac2023.sciforum.net/.
Eng. Proc. 2023, 48(1), 31; https://doi.org/10.3390/CSAC2023-14898
Published: 25 September 2023

Abstract

:
The goal of the project was to monitor PM0.1 to PM10 levels in one of the four rooms in a four-bed building for a period of one month using a low cost in accordance with the manufacturer’s instructions. The data collected during this period were statistically analyzed using Minitab software. The mean PM (µg/m3) values obtained when compared with the available World Health Organisation (WHO) standards, PM2.5 and PM10, were found to be above the 24 h limits, indicating a potential danger to the environment and individuals.

1. Introduction

By supplying reliable and inexpensive energy (Goal 7) in communities and cities that are sustainable (Goal 11), the United Nations Sustainable Development Goals [1] aim to improve the quality of life (Goal 3). Improving indoor air quality (IAQ) fits perfectly with these objectives. Lower indoor air pollution (IAP) is particularly crucial for attaining gender balance (Goal 5) and reducing poverty (Goal 10), as emissions from burning solid fuels like coal as well as wood when heating have a significant negative impact on women in developing nations and put them at a higher risk for IAP-related disorders. The risk that contaminants from the inside can reach the lungs rises by an order of 1000 [2,3] because research shows that air contaminants indoors are always greater than that outside because of constrained regions [4].
Several illnesses may serve as helpful warning signs of poor IAQ, particularly if symptoms develop after an individual relocates into a fresh house, remodels or redecorates their present residence, or uses chemical treatments on their property. Finding probable causes of contamination of indoor air is another technique to determine whether your home now has indoor air quality issues or is at risk of developing them. Examining your way of life and daily activities can be an additional indicator in determining the probability that your home has poor IQA. Lastly, check for indications that your home’s airflow may be having issues. Due to the price, a cheap sensor will be helpful for detecting contaminants indoors. Research has been conducted indoors in locations with a variety of pollution sources [5,6], but few or no investigations have been conducted in locations where people smoke cigarettes. If one is being examined, it is not inappropriate.
Hence, this research presents the initial results of an IQA surveillance study conducted in a building where cigarettes are smoked often. The study presents information gathered about PM0.1 to PM10. This study adds to our understanding of the function of inexpensive sensors in determining indoor air quality.

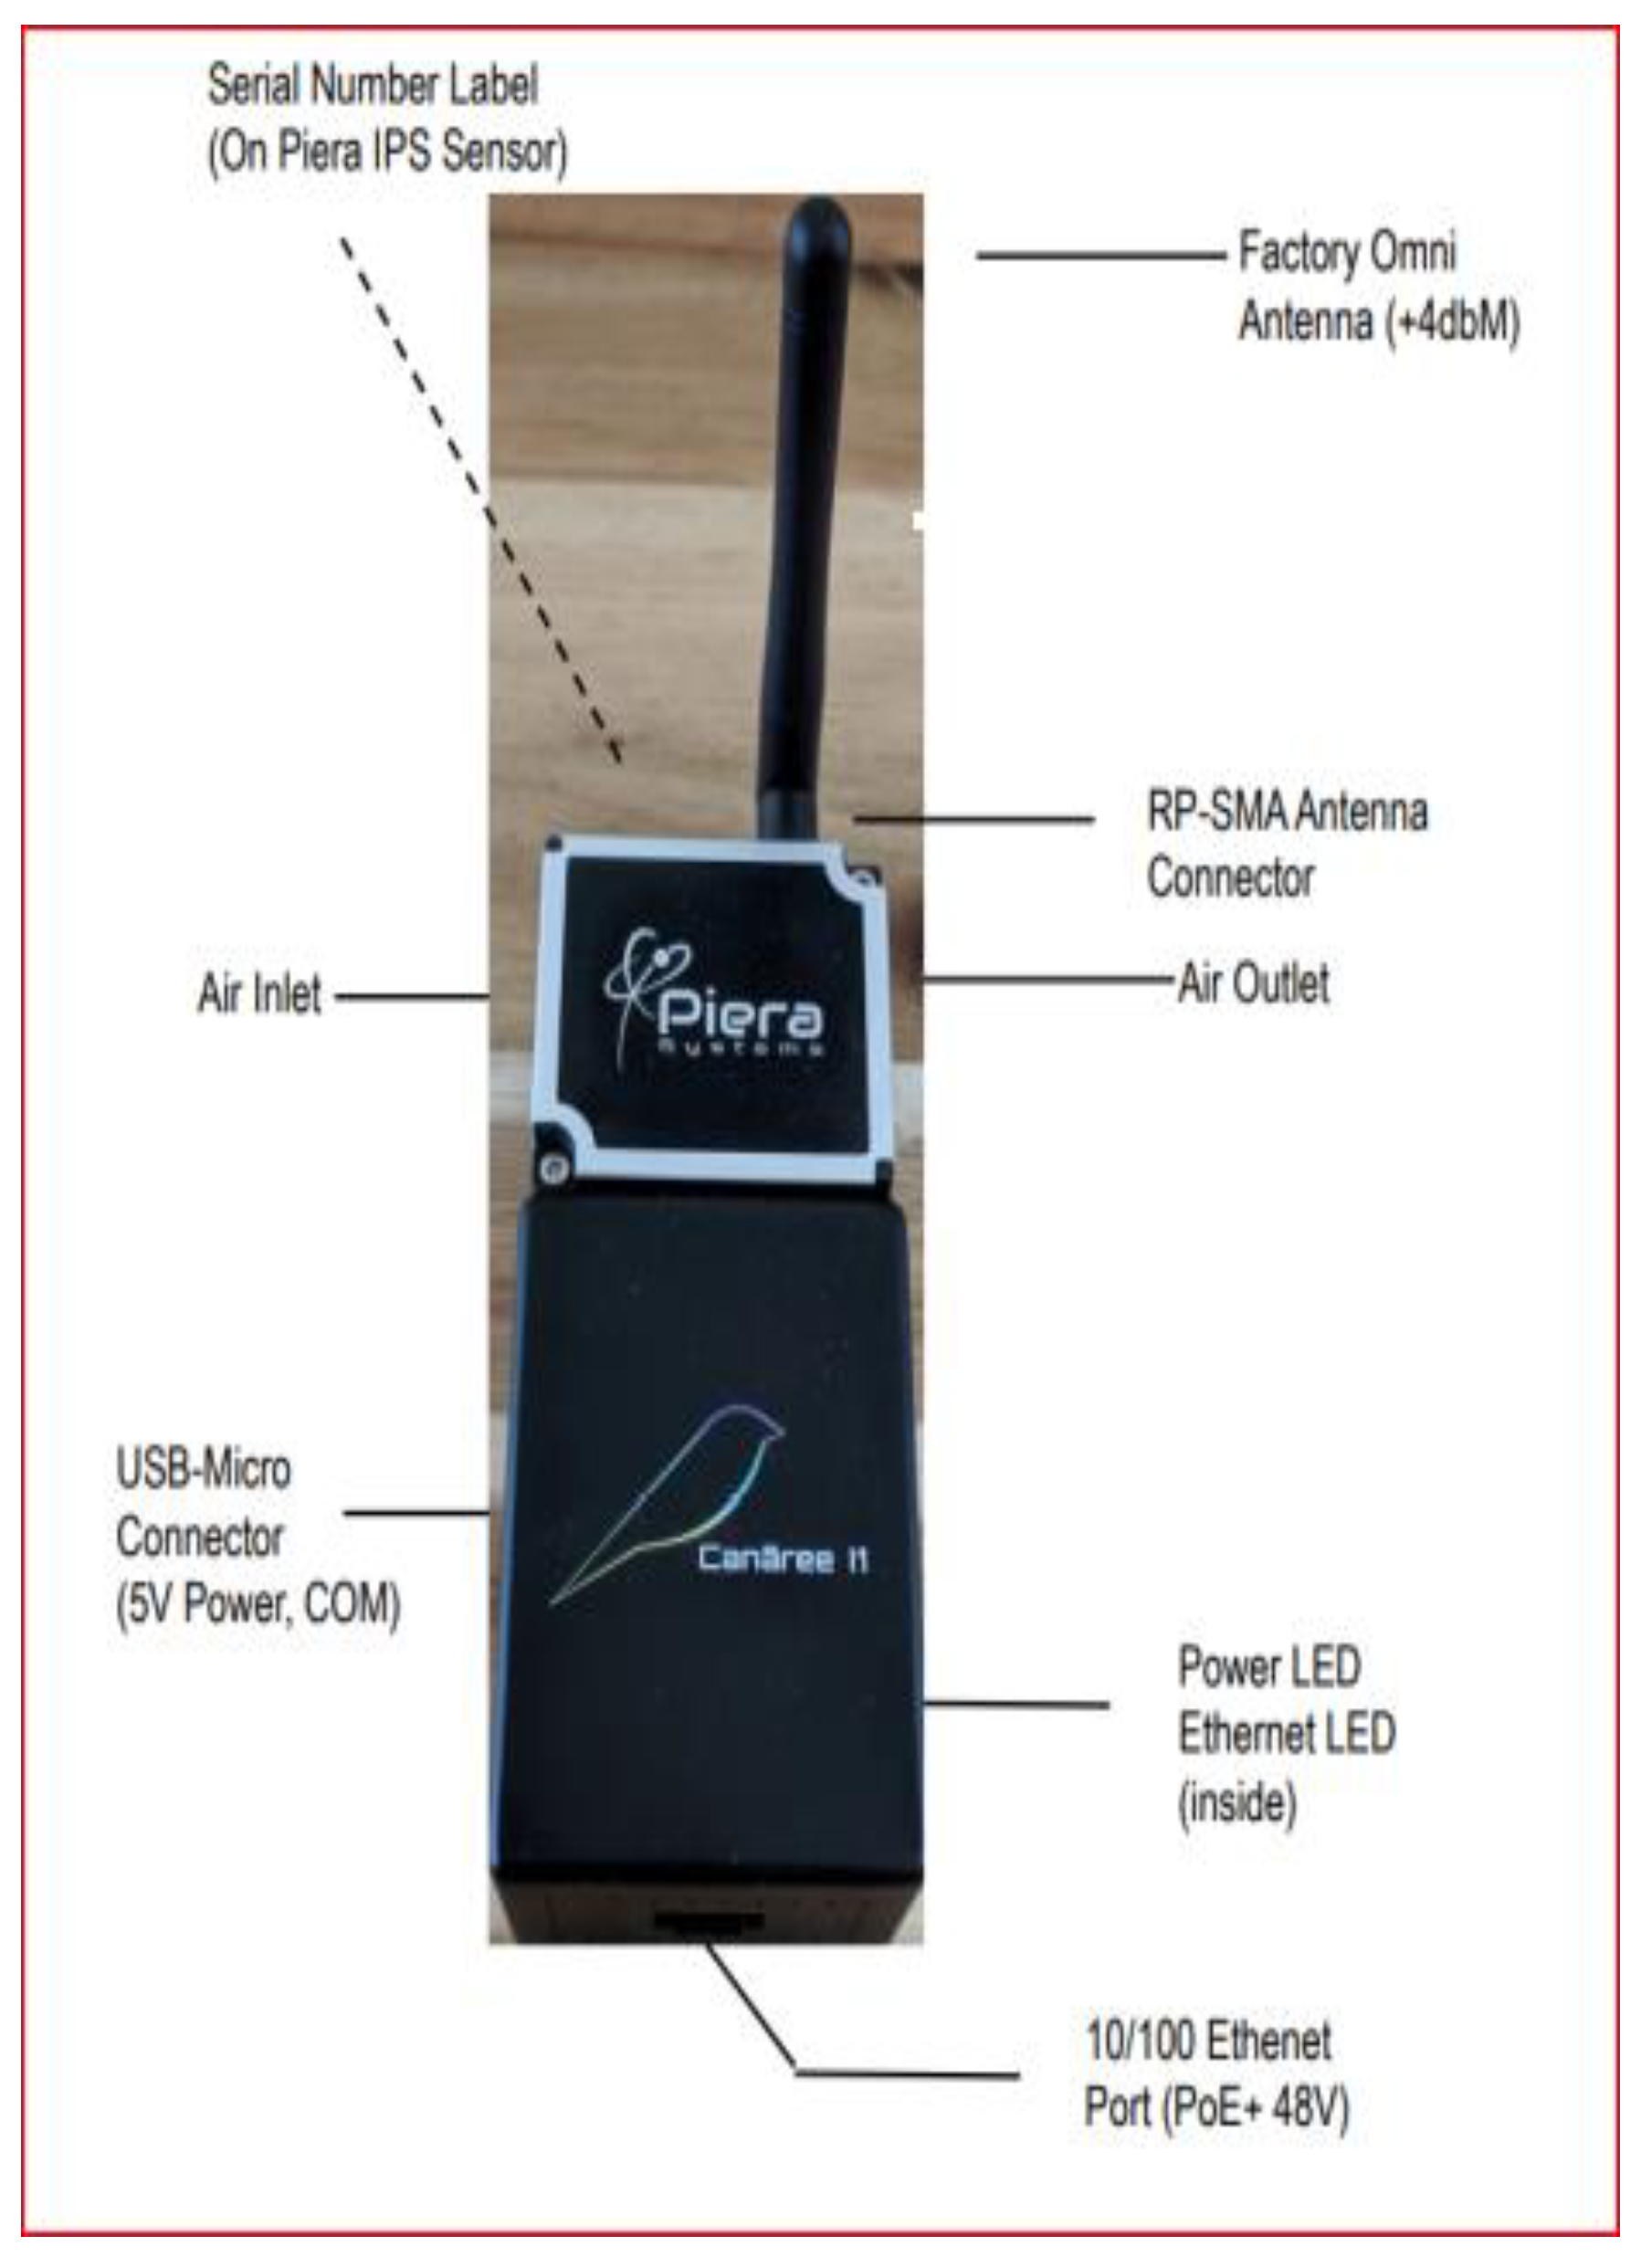
2. Materials and Methods

The Canāree A1 surveillance equipment utilized in this investigation is shown in Figure 1. This portable Air Quality Monitor (AQM) detects air quality in real-time. It makes use of the Bosch BME688 (I5 versions) and the Intelligent Particle Sensor series 7100. Canree can categorize sources of air pollution for interior applications such as smoke (tobacco, wildfire), vaping, cooking, dust, and toxic gas detection using data from the sensors and special algorithms to recognize various particulate sources. The sensing component of the Canree A1 sensor can measure pressure, temperature, relative humidity, CO2, BVOC, and airborne particles (PM0.1 to PM10) [7]. This investigation is an initial overview of a one-month investigation into IQA evaluation in Akure, Nigeria’s Ondo State. One (room B) of the four bedrooms in a four-bed residence is used in the investigation for measuring PM0.1 to PM10 values. The manufacturer’s recommendations were followed when Canāree A1 was deployed on 5 January 2023, and it continues recording information today [7]. There are several human-made events present in the apartment that were the subject of the study, including cigarette smoking, to name one. Within the study area, vacuuming, biomass combustion, and garbage landfills, as well as vehicular, pedestrian, and animal movements, are a few instances of outdoor activities.
Every second, the range of particulate matter (PM0.1–PM10) is downloaded. In SenseiAQ, the acquired data are evaluated and then recorded in a local CSV log file. Excel 2013 was used to statistically evaluate the results of the study, translate the data from seconds to hours, and create pie charts and loading plots.

3. Results and Discussion

The minimum and maximum (µg/m3) values (Table 1) are 0.18–0.69 (0.4 ± 0.14), 2.87–12.14 (2.33 ± 6.57), 15.88–94.78 (41.29 ± 15.95), 35.47–443.32 (133.5 ± 875.75), 87.13–1796.55 (460.51 ± 290.94), 111.85–2145.91 (557.89 ± 349.13), and 112.94–279.77 (559.24 ± 349.84) for 0.1, 0.3, 0.5, 1.0, 2.5, 5.0, and 10, respectively. The mean values of PM2.5 and PM10 are far above the 24 h and annual (PM2.5—15 and 5 µg/m3) and (PM10—45 and 15 µg/m3) recommended WHO [8] limits, respectively. The findings showed that the PM ranges had significant standard deviations. While a low standard deviation meant that the data sets were tightly grouped around the mean, a high standard deviation meant that the data sets were distant from the mean. Every observation revealed a significant amount of kurtosis. It is noted if the kurtosis is −0.24–3.11. If the kurtosis is greater than 3, the data set has shorter tails than a normal distribution (less in the tails), and vice versa. If the kurtosis is lower than 3, the data set has more weight in the tails than a normal distribution (more in the tails). According to the general rule for kurtosis, the distribution is too peaked if the value is higher than +1. Identical to this, an excessively flat distribution is indicated by a kurtosis of less than −1. These ceilings are exceeded by non-normal distributions’ skewness and/or kurtosis [9]. Cigarette smoking in the room and pollutants brought in from outdoor activities are to blame for the high levels of PM2.5 (26%), PM5.0 (32%), and PM10 (32%) shown in Figure 2. The results back up Tran et al.’s [10] assertion that certain pollutants origins can be observed in indoor as well as outdoor environments.
The Runs test, a method of statistical analysis, is shown in Table 2 and examines if a series of data inside a certain distribution were obtained through a random process or not [11]. It is used to check the data’s randomness in this investigation. The data acquired are subject to randomness (≤K), which is inferred from the table (H₀ is chosen as the hypothesis).
The PM loadings are shown in Figure 3. In the data set of the pollutants at the study room, the principal components (PC) 1, 2, and 3 successively accounted for PM1.0 and PM0.5 (87.74%), PM0.3 and PM0.1 (12.25%), PM2.5 and PM5.0 (3.01%) variability (Figure 3). The loading plot’s first two components, cigarette smoke and outdoor penetration of pollution contact, respectively, were used to clarify the variation. The variance was only partially explained by other components with eigenvalues greater than 1.

4. Conclusions

In the present investigation, a low-cost sensor was used to monitor the PM0.1–PM10 levels in a room of a four-bedroom apartment in Akure, Nigeria, over the course of one month. Cigarette smoking in the room and pollutants brought in from outside activities are to blame for the high levels of PM2.5, PM5.0, and PM10. Additionally, the results demonstrate that PM2.5 and PM10 levels were considerably higher than WHO 2021 values. Guidelines were lacking, therefore it was impossible to compare the data to that of others (PM0.1, PM0.3, PM0.5, PM1.0, and PM5.0). The variation in the variance shows the substantial differences in the results’ levels throughout the course of the monitoring period and the randomness of the PM levels throughout the data. The future study calls for extensive intervention studies, involving cost–benefit assessment, medical impact, and tracking of IAP levels. Taking into account the spatial distribution of smoke exposure in the environment, this study is anticipated to assist decision-makers in their evaluation of environmental health policy initiatives related to exposure to cigarette smoking in this subtropical region.

Author Contributions

Conceptualization, F.O.A.; methodology, A.O.G.; software, S.O.A.; validation, F.O.A., A.O.G. and S.O.A.; formal analysis, F.O.A.; investigation, F.O.A.; resources, A.O.G.; data curation, S.O.A.; writing—original draft preparation, F.O.A.; writing—review and editing, A.O.G.; visualization, S.O.A.; supervision, F.O.A.; project administration, A.O.G. All authors have read and agreed to the published version of the manuscript.

Funding

This research received no external funding.

Institutional Review Board Statement

Not applicable.

Informed Consent Statement

Not applicable.

Data Availability Statement

Not applicable.

Acknowledgments

The authors are grateful to Piera Systems for the provision of the sensor used for the research.

Conflicts of Interest

The authors declare no conflict of interest.

References

  1. UNSDGs. United Nations Sustainable Development Goals. Department of Economic and Social Affairs Sustainable Development. 2015. Available online: https://www.un.org/goals (accessed on 5 June 2023).
  2. Zhang, J.; Smith, K.R. Indoor air pollution: A global health concern. Br. Med. Bull. 2003, 68, 9–225. [Google Scholar] [CrossRef] [PubMed]
  3. Kumar, P.; Hama, S.; Abbass, R.A.; Nogueira, T.; Brand, V.S.; Wu, H.; Abulude, F.O.; Adelodun, A.A.; Anand, P.; Andrade, M.E.; et al. In-kitchen aerosol exposure in twelve cities across the globe. Environ. Int. 2022, 162, 107155. [Google Scholar] [CrossRef] [PubMed]
  4. Leung, D.Y.C. Outdoor-indoor air pollution in urban environment: Challenges and opportunity. Front. Environ. Sci. 2015, 2, 69. [Google Scholar] [CrossRef]
  5. Abulude, F.O.; Fagbayide, S.D.; Akinnusotu, A.; Makinde, O.E.; Elisha, J.J. Assessment of the Indoor Air Quality of Akure South—West, Nigeria. Qual. Life 2019, 10, 15–27. [Google Scholar] [CrossRef]
  6. Abulude, F.O.; Feyisetan, A.O.; Arifalo, K.M.; Akinnusotu, A.; Bello, L.F. Indoor Particulate Matter Assessment in a Northern Nigerian Abattoir and a Residential Building. J. Atm. Sci. Res. 2022, 5, 20–28. [Google Scholar] [CrossRef]
  7. Piera Systems. SenseiAQ Software Real-Time Air Quality Monitoring for Piera Sensors, Canāree Air Quality Monitors Application User Guide; Version 1.2.2 Updated 10/6/21; Piera Systems Inc.: Mississauga, ON, Canada, 2021. [Google Scholar]
  8. WHO. What Are the WHO Air Quality Guidelines? Network Updates. Worldwide. 2021. BreatheLife2030. Available online: https://www.who.int/news-room/feature-stories/detail/what-are-the-who-air-quality-guidelines (accessed on 11 February 2022).
  9. Hair, J.F.; Hult, G.T.M.; Ringle, C.M.; Sarstedt, M. A Primer on Partial Least Squares Structural Equation Modeling (PLS-SEM), 3rd ed.; Sage: Thousand Oaks, CA, USA, 2020. [Google Scholar]
  10. Tran, V.V.; Park, D.; Lee, Y. Indoor Air Pollution, Related Human Diseases, and Recent Trends in the Control and Improvement of Indoor Air Quality. Int. J. Environ. Res. Public Health 2020, 17, 2927. [Google Scholar] [CrossRef] [PubMed]
  11. Bujang, M.A.; Sapri, F.E. An application of the runs test to test for randomness of observations obtained from a clinical survey in an ordered population. Malays. J. Med. Sci. 2018, 25, 146–151. [Google Scholar] [CrossRef] [PubMed]
Figure 1. Low-cost sensor (Canāree A1).
Engproc 48 00031 g001
Figure 2. Chart of the contributions of PM levels.
Engproc 48 00031 g002
Figure 3. The loading plot of the particulate matter studied.
Engproc 48 00031 g003
Table 1. Anderson–Darling normality test results.
PM0.1PM0.3PM0.5PM1.0PM2.5PM5.0PM10.0
p-value<0.005<0.005<0.005<0.005<0.005<0.005<0.005
A-Square1.311.261.241.912.242.182.18
Mean0.406.5741.29133.58460.51557.89559.24
Std0.142.3315.9575.75290.94349.13349.84
Variance0.0195.42254.315738.7184,645.83121,893.85122,388.73
Skewness0.310.330.411.011.291.271.27
Kurtosis−0.98−0.90−0.241.513.112.962.96
N99999999999999
Minimum0.182.8715.8835.4787.13111.85112.14
Q10.284.6527.8072.22232.83279.00279.77
Median0.386.2137.98115.01390.15470.84472.13
Maximum0.6912.1494.78443.321796.552145.912151.80
Q30.518.3354.88181.42685.27783.01785.65
95% Confidence Interval (mean)0.437.0344.47148.69518.54627.53629.01
95% Confidence Interval (median)0.467.4945.29150.99478.92579.43581.04
95% Confidence Interval (Std)0.162.7118.5488.07338.25405.91406.74
Table 2. Descriptive statistics of run.
Test
Null hypothesis H0: The order of the data is random
Alternative hypothesis H1: The order of the data is not random
Number of RunsNumbers of Observation
VariableObservedExpectedp-ValueVariableNKK>K
PM0.11850.250.000PM0.1990.4005346
PM0.31850.090.000PM0.3996.5665445
PM0.51850.370.000PM0.59941.2.945247
PM1.01850.090.000PM1.099133.5765445
PM2.51849.650.000PM2.599460.585643
PM5.01849.890.000PM5.099557.8935544
PM101849.890.000PM1099559.2385544
K = sample/mean
Disclaimer/Publisher’s Note: The statements, opinions and data contained in all publications are solely those of the individual author(s) and contributor(s) and not of MDPI and/or the editor(s). MDPI and/or the editor(s) disclaim responsibility for any injury to people or property resulting from any ideas, methods, instructions or products referred to in the content.

