Abstract
The possibility of using mid-infrared (IR) spectroscopy in combination with the method of attenuated total reflection (ATR) to analyze the quality of dairy products is shown. The application of chemometrics, in particular the multivariate curve resolution (MCR) algorithm, to the spectral data of the milk drop-drying process allows us to obtain spectra of its individual components, which is potentially useful to make quantitative estimates of the sample composition.
1. Introduction
Milk is one of the most important foods in the human diet. Therefore, quality control of dairy products is an important task. Fat, protein, and lactose are the main components of milk, which determine its nutritional value and, consequently, the product cost. Optical spectroscopic methods of analysis are widely used in the modern dairy industry. Mid-infrared (IR) spectroscopy (400–4000 cm−1) is one of the most common methods adopted as the industry standard for the quality assessment of dairy products [1]. Vibrational IR spectra carry rich structural information about the sample constituents, and the observed absorption signal depends linearly on the component concentrations. Due to this fact, the method suits well for both qualitative and quantitative analysis [2,3].
In the present work, the analytical capabilities of IR spectroscopy in combination with the attenuated total reflection (ATR) measurement have been investigated. ATR analysis makes use of a weak interaction of light, reflected from the inner surface of a crystal, with the outer sample. This method is rarely used in the analysis of milk components due to its low (3–6 µm) penetration depth into the sample, which makes it difficult to analyze colloidal particles, such as fat globules and protein micelles [4]. Here, an original approach to the ATR analysis of dairy products has been proposed. It consists of IR spectral observation of the drying process of a milk drop on the surface of ATR crystal, followed by a chemometric analysis of the obtained three-dimensional data array. It opens new opportunities for in-depth investigation of milk and its derivatives. This approach can be used for both qualitative and quantitative analysis of milk and can be incorporated into the basis of new methods of quality control in the dairy industry.
2. Materials and Methods
2.1. Milk Samples
Commercial cow’s milk from Pestravka (district of Samara, Russia) with a fat content of 3.2% was used as a sample. A 20 µL drop of milk was placed on a diamond ATR-pad, dried at 40 °C, and IR-spectra were taken. The sample was dried for at least 40 min, until complete water evaporation. The drying was additionally monitored using a built-in camera in the ATR attachment.
2.2. Spectral Studies
The experiment was carried out on an FT-803 FT-IR spectrometer with an ATR attachment with a diamond element and temperature controller (SIMEX, Novosibirsk, Russia). The spectra were taken every 15 s. Right before each measurement, the background measurement (air) was recorded.
The main experimental difficulties of the IR spectroscopy method are the high extinction coefficients in this region, which require small optical paths to obtain absorption spectra. The attenuated total reflection (ATR) method is a promising method of analysis due to its ability to use fiberoptic probes. The ATR method is based on the internal reflection, whereby IR radiation is directed through a crystal that is in contact with the sample. The beam is reflected several times before reaching the detector. For MIR, the penetration depth is less than 10 µm, which is similar to thin transmission cells [5].
IR spectroscopy is rarely used in milk analysis because, due to the low sample penetration depth, the colloidal components of milk, primarily fat globules, remain invisible to the measurement.
As water evaporates, the spectra reveal signals of all major components. The data can be subjected to the multivariate curve resolution (MCR) [6], resulting in pure component spectra along with their corresponding kinetic curves.
2.3. Data Analysis
The spectra were represented in absorption units and the multivariate curve resolution method was used to analyze the milk constituents The MCR is a resolution method that is used in many different fields such as hyperspectral image analysis [7]. In this context, the algorithm provides distribution maps and pure spectra of image components from the image measurement. Additional information, such as constituent identification, can be easily derived based on the resulting spectra and concentration profiles [8,9].
Data analysis and visualization were performed using PLS_Toolbox v 7.8 (Eigenvector Research Inc., Wenatchee, WA, USA) for Matlab R2022b (The Matworks, Natick, MA, USA).
3. Results and Discussion
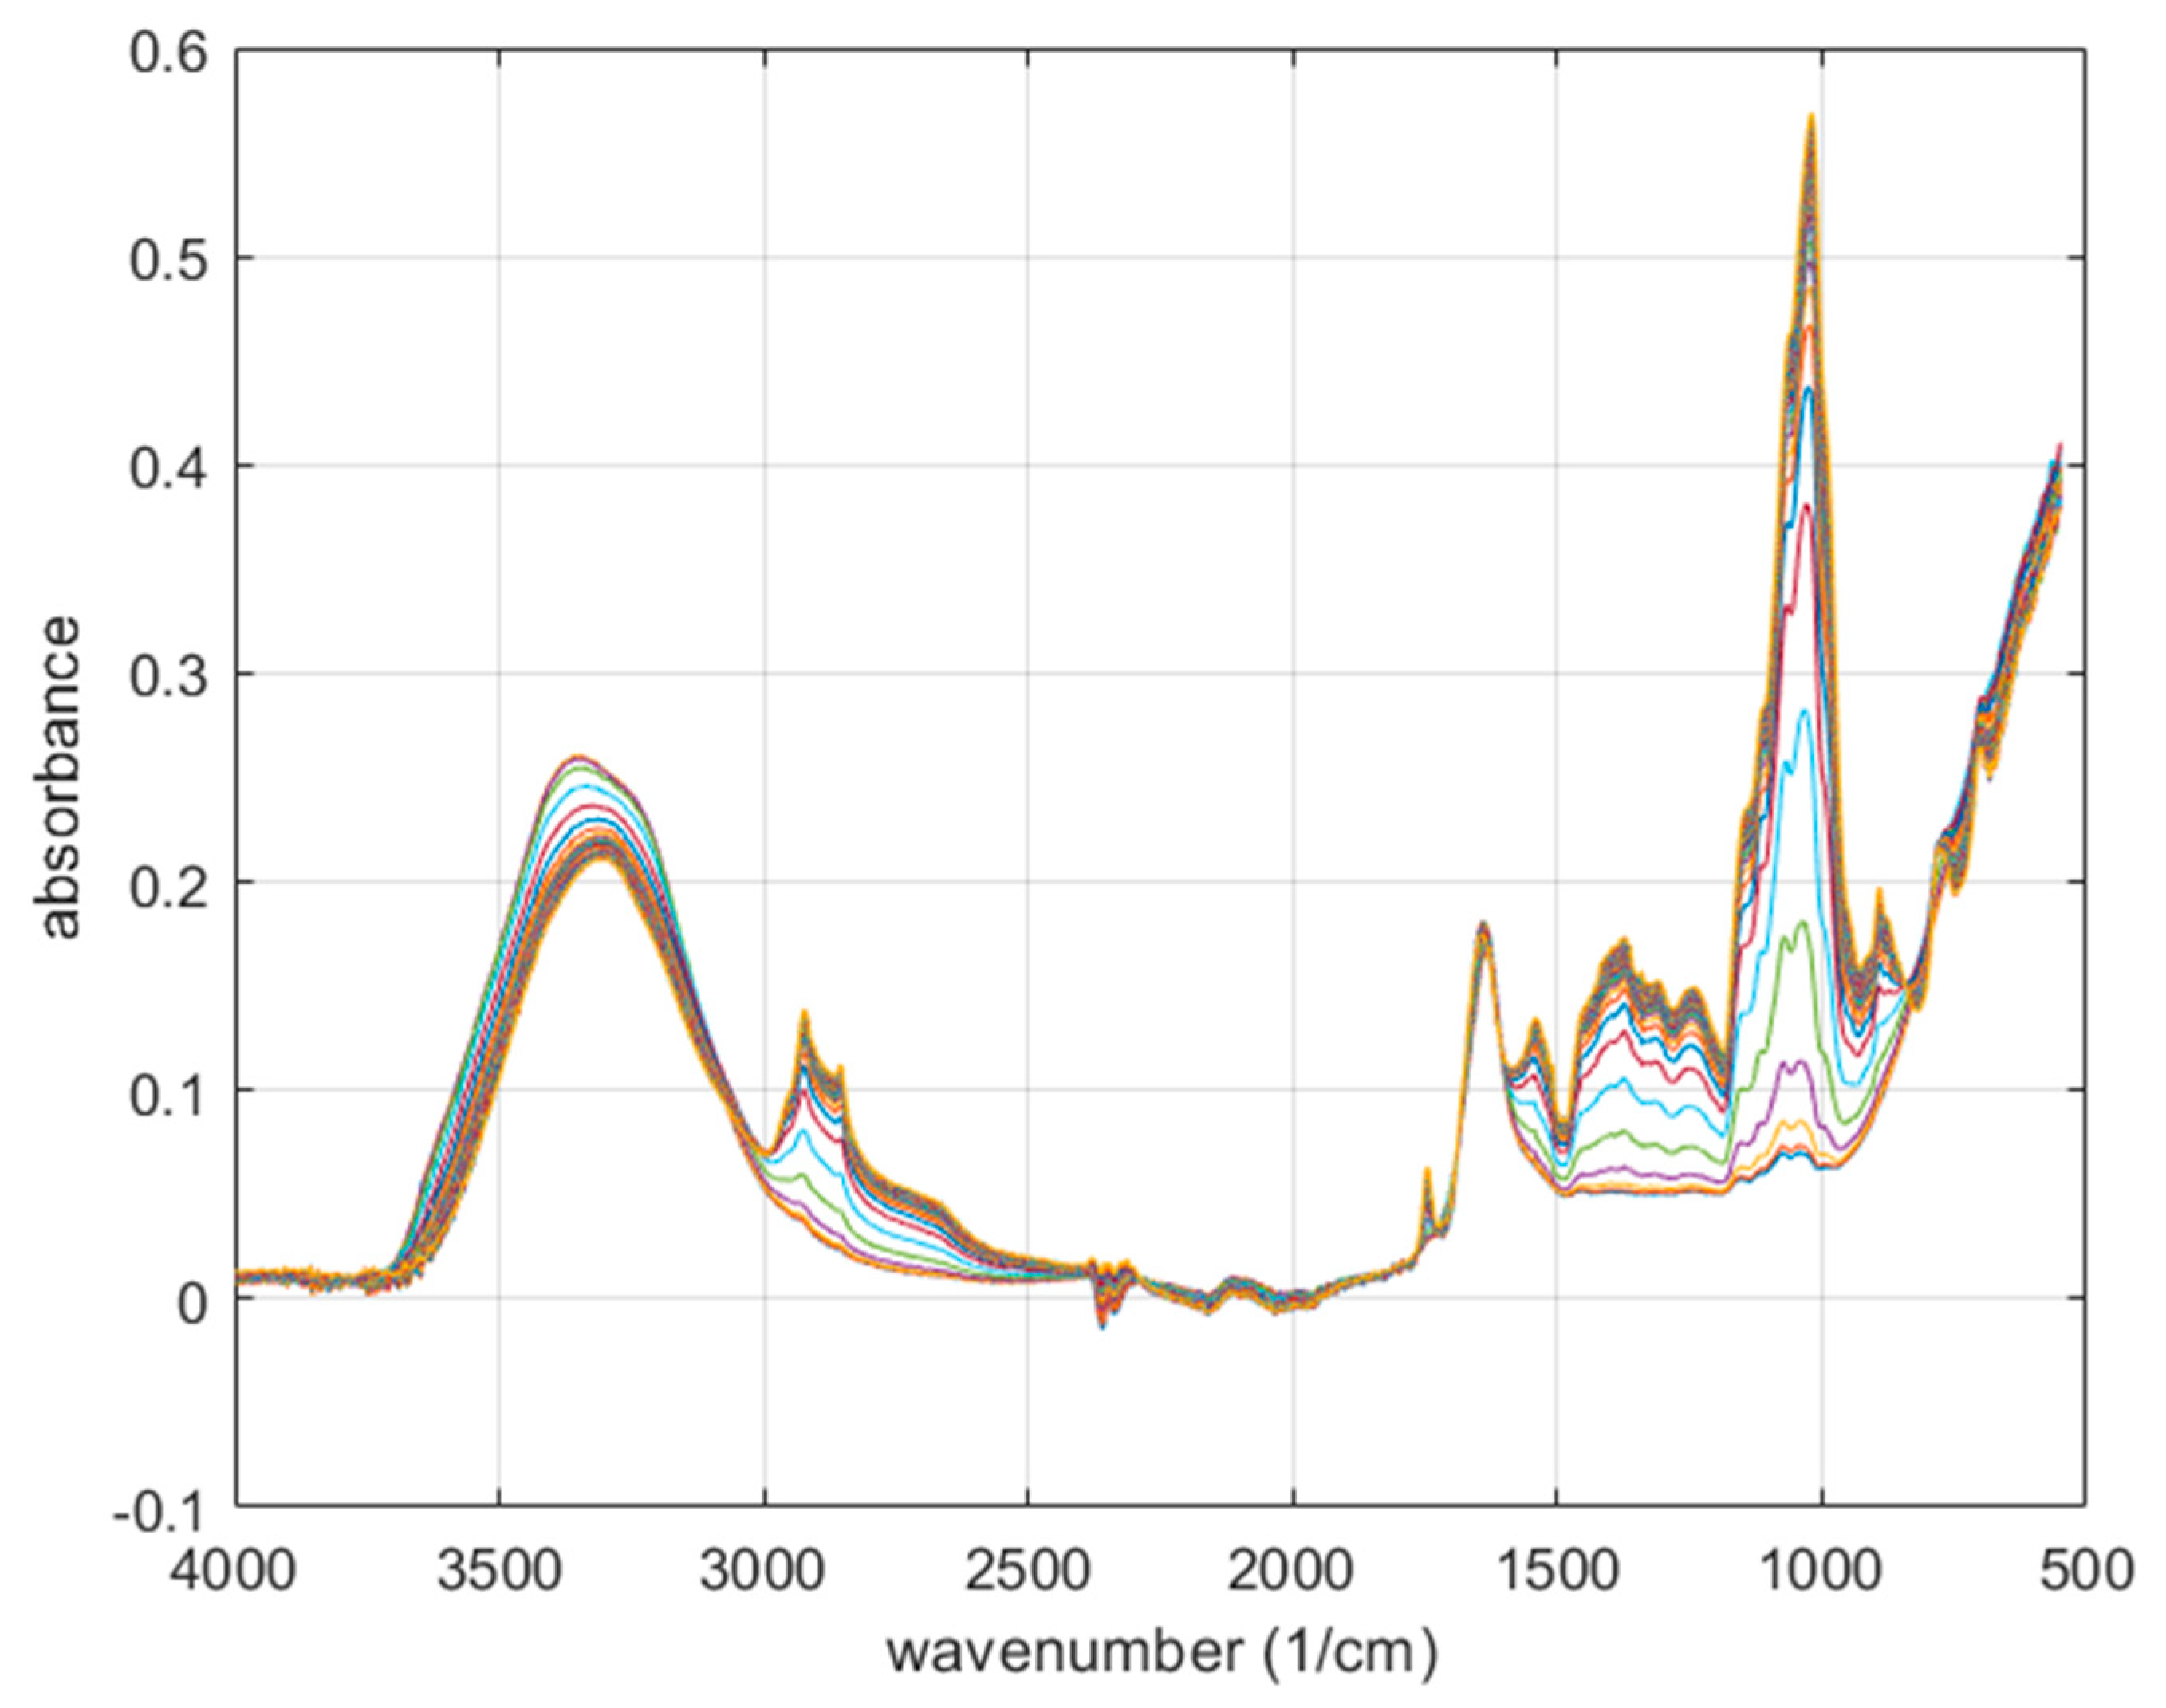
Figure 1 shows the spectra of a drop of milk dried on an ATR attachment. The changes in the spectra are due to the drying of the milk sample. The spectra show the characteristic vibration bands of water, milk fat and lactose [10]. During the drying of the droplet, the signals in the 3200–3500 cm−1 region decrease. At the same time, a group of signals in the region 2800–3000 cm−1 grows, which refers to the stretching C-H vibrations of hydrocarbon residues of fat, which are also present in lactose and protein molecules, but primarily in CH2 groups of fat molecules. The lactose molecule does not have its own distinct signals that do not overlap with those of other milk components.

Figure 1.
IR spectra of a milk drop.
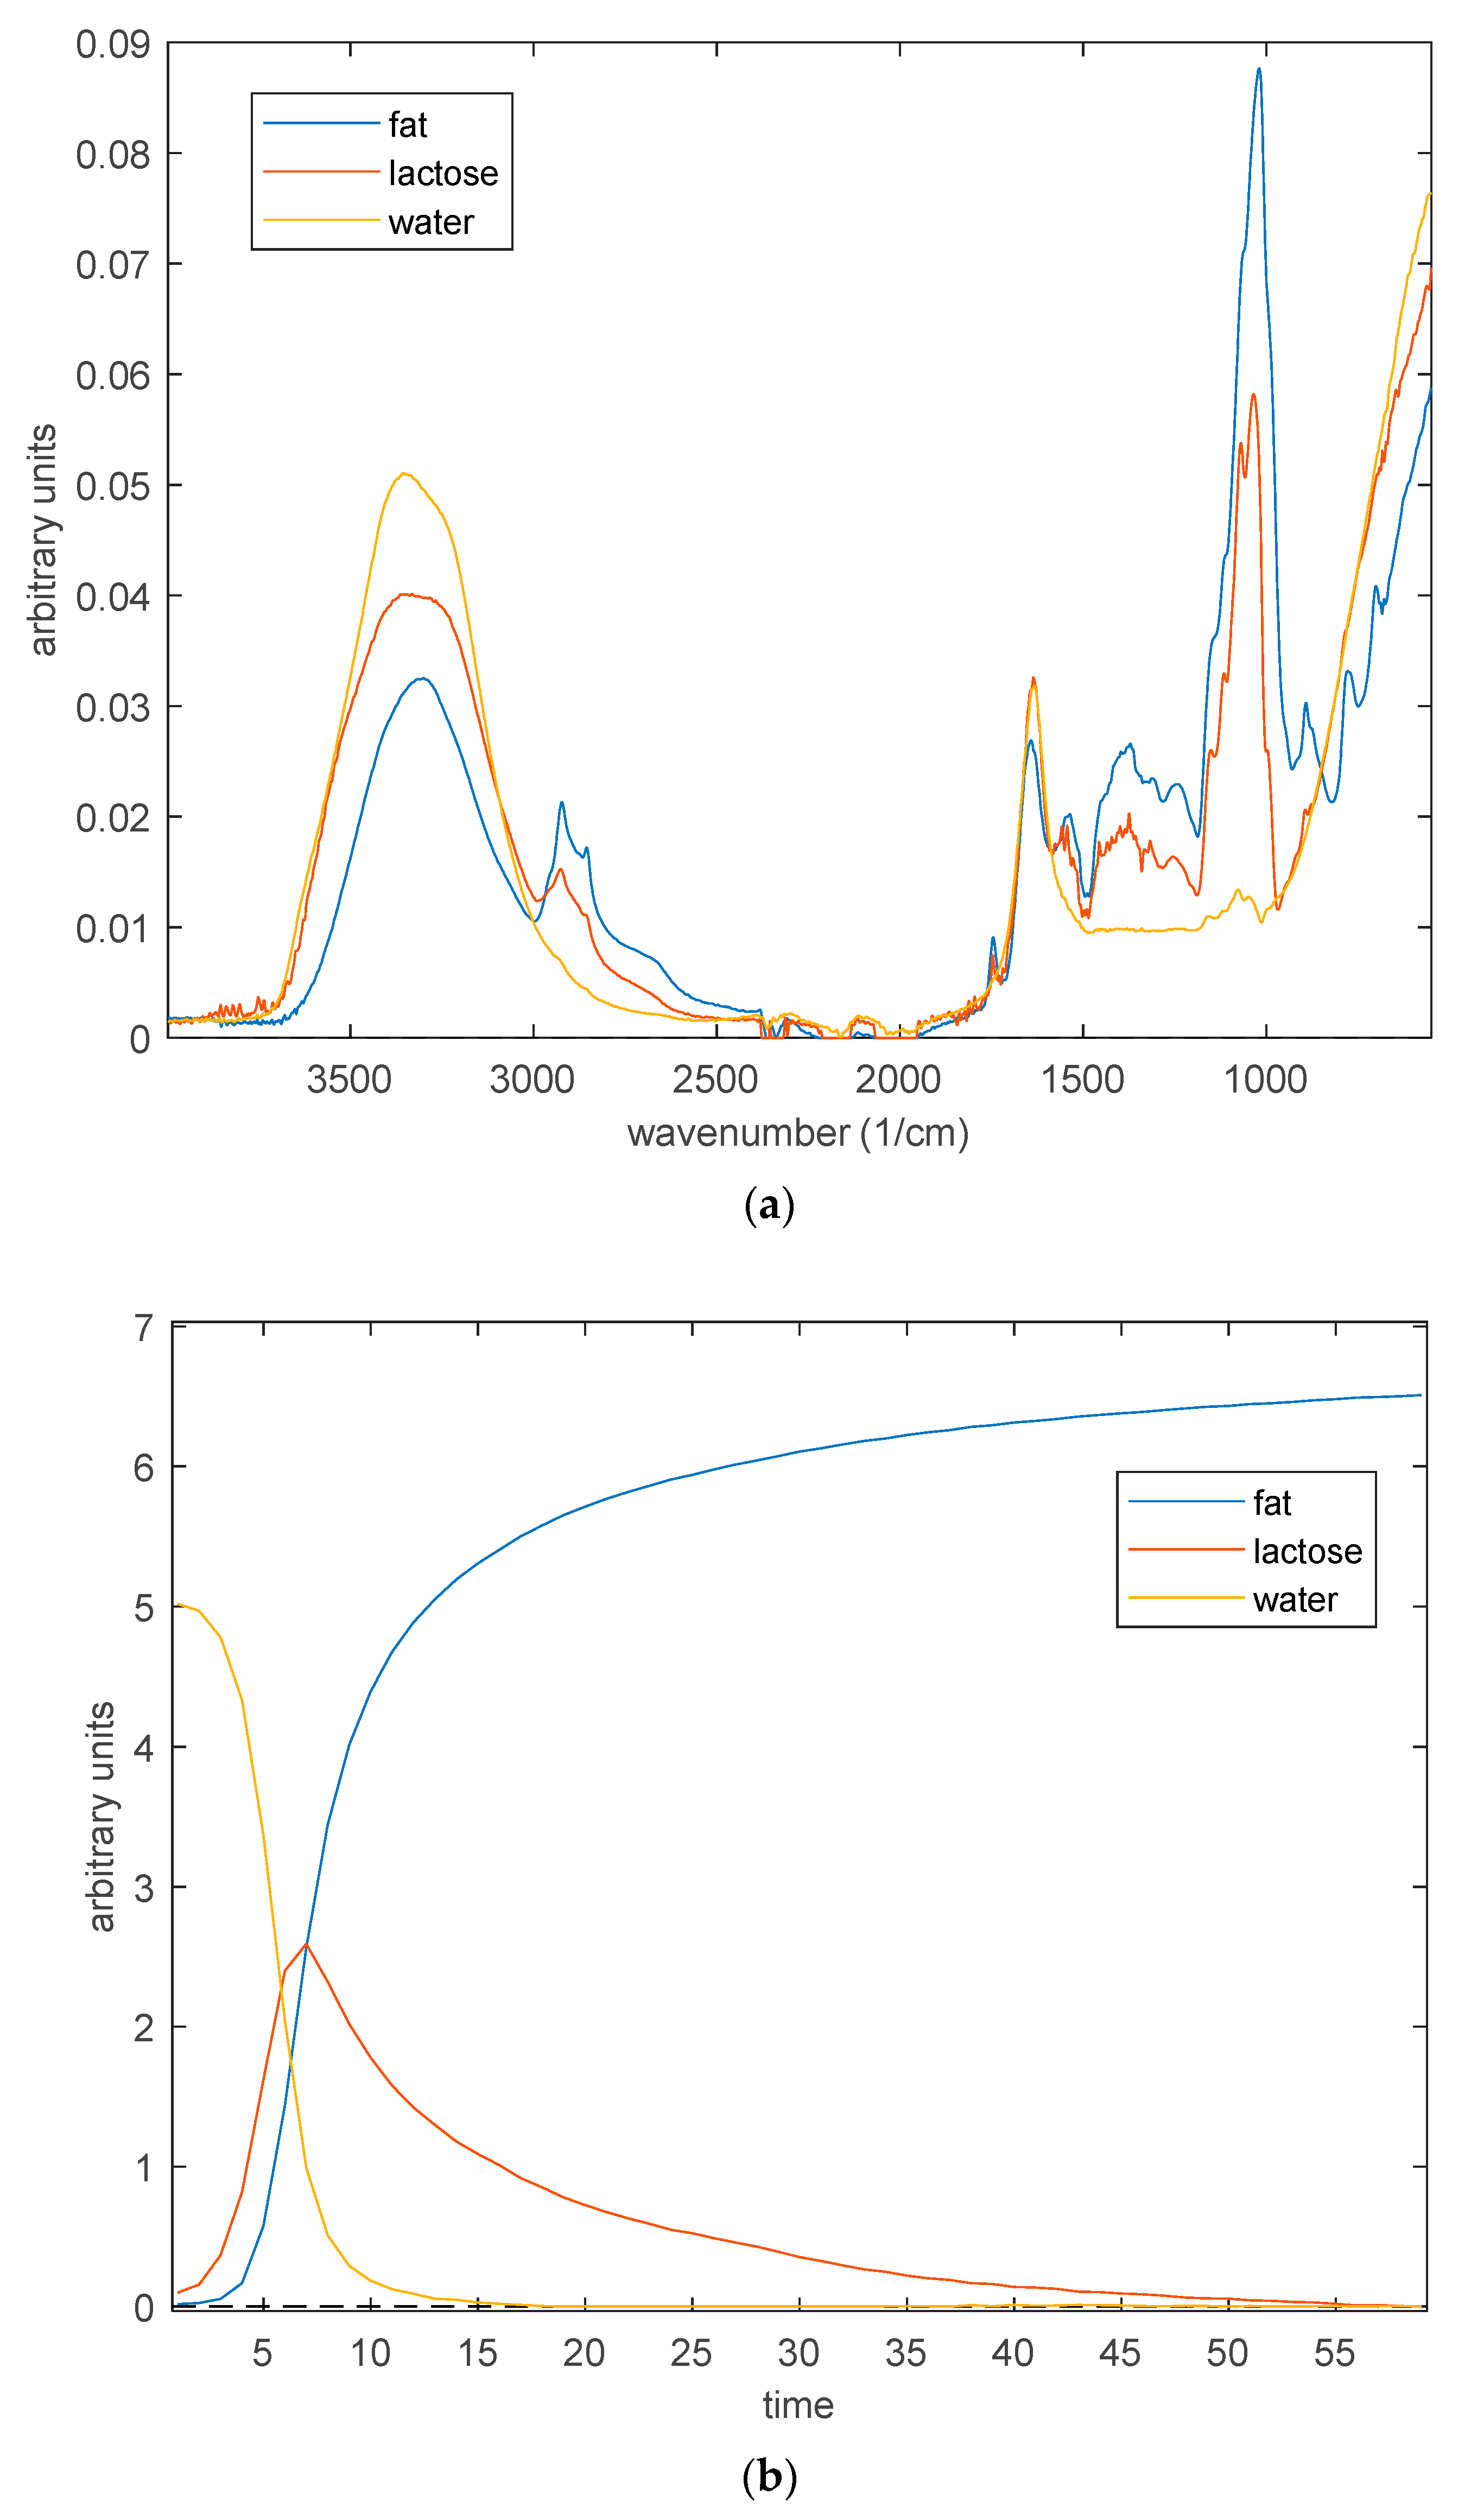
The temporal changes in the signals of different components in the milk spectra during drop drying have different nature. This creates additional information that can be used in data analysis. Application of the MCR method on the data in Figure 1, gives three pairs of complementary curves: fat, lactose, and water spectra (Figure 2a), and their corresponding concentration profiles (Figure 2b).
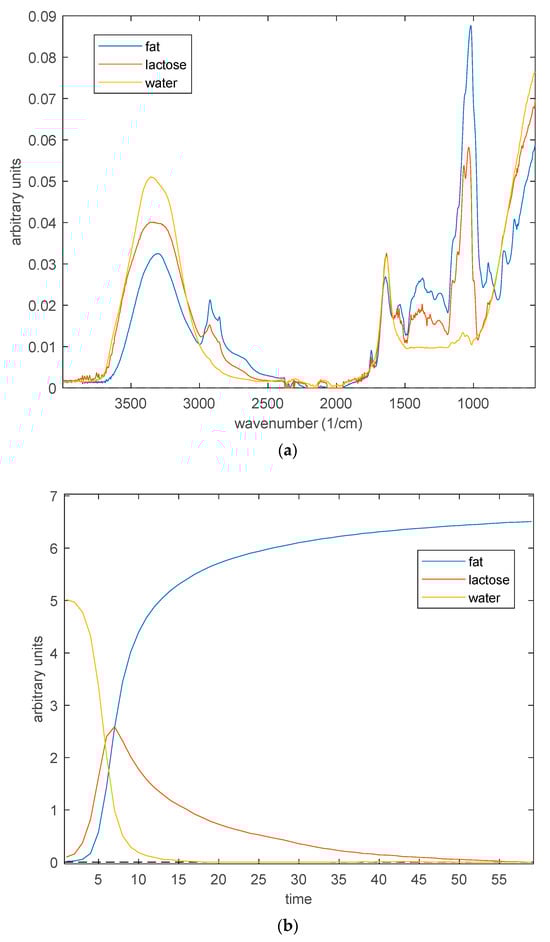
Figure 2.
Resolved (a) spectra and (b) concentration profiles of the milk components.
As it can be seen in Figure 2a, the acquired resolved spectra are close to the known spectra of the components. The main difficulty in resolving the spectra of milk components is that the spectra of lactose contain signals that largely coincide with those of fat and water. The derived kinetic patterns confirm the correctness of the acquired resolved spectra. The water concentration falls expectedly during drying, slowing down towards the end of drying. The growth curve of the spectral contribution of fat is anti-symmetrical to the decreasing water. Interestingly, at the beginning of the process, colloidal particles—globules of fat—are practically invisible in the ATR method being at a distance from the surface of the ATR crystal, while at the end of drying, the fat signals become the main ones in the spectrum.
The MCR-resolved concentration of lactose passes through the maximum. We explain this by the fact that in the process of drop drying, lactose is first concentrated and then its crystallization begins, followed by the lactose crystals being essentially masked by the fat film formed on the crystal surface at the end of the process.
In this experiment, it was not possible to resolve weak protein signals. They can probably be resolved through a more detailed study with the use of advanced data-analysis methods, including fused data analysis of milk samples of different compositions.
4. Conclusions
The suggested method, equipped with the chemometric analysis, can be used as the basis of a new technique for qualitative and quantitative analysis of milk and milk products.
The reported preliminary results indicate the potential utility of Fourier-transform ATR infrared spectroscopy for the rapid, possibly online, determination of the components of normalized and raw milk.
Resolving the weak spectrum of milk protein is the goal of our subsequent research.
Author Contributions
Conceptualization, J.K. and A.B.; methodology, J.K. and A.B.; formal analysis, J.K. and A.B.; investigation, A.B. and J.K.; data curation, A.B. and J.K.; writing—original draft preparation, A.B. and J.K.; visualization, A.B. and J.K.; supervision, A.B. All authors have read and agreed to the published version of the manuscript.
Funding
The work was supported by the Ministry of Science and Higher Education of the Russian Federation (theme No. FSSE-2023-0003) as part of the state task of the Samara State Technical University.
Institutional Review Board Statement
Not applicable.
Informed Consent Statement
Not applicable.
Data Availability Statement
Not applicable.
Conflicts of Interest
The authors declare no conflict of interest.
References
- ISO 9622:2013|IDF 141:2013; Milk and Liquid Milk Products—Guidelines for the Application of Mid-Infrared Spectrometry. ISO: Geneva, Switzerland, 2013. Available online: https://www.iso.org/standard/56874.html (accessed on 15 June 2023).
- Goulden, J. Analysis of milk by infra red absorption. J. Dairy Res. 1964, 3, 273–284. [Google Scholar] [CrossRef]
- Pereira, C.; Luiz, L.C.; Bell, M.J.V.; Anjos, V. Near and mid infrared spectroscopy to assess milk products quality: A review of recent applications. J. Dairy Res. Technol. 2020, 3, 100014. [Google Scholar] [CrossRef]
- Gorla, G.; Mestres, M.; Boque, R.; Riu, J.; Spanu, D.; Giussani, B. ATR-MIR spectroscopy to predict commercial milk major components: A comparison between a handheld and a benchtop instrument. Chemom. Intell. Lab. Syst. 2020, 200, 103995. [Google Scholar] [CrossRef]
- Melling, J.M.; Thompson, M. Fiber-optic probes for midinfrared spectrometry. In Handbook of Vibrational Spectroscopy; Chalmer, J.M., Griffiths, P.R., Eds.; John Wiley & Sons: Chichester, UK, 2002. [Google Scholar]
- Tauler, R. Multivariate curve resolution applied to second order data. Chemometr. Intell. Lab. Syst. 1995, 30, 133–146. [Google Scholar] [CrossRef]
- Piqueras, S.; Duponchel, L.; Tauler, R.; de Juan, A. Resolution and segmentation of hyperspectral biomedical images by Multivariate Curve Resolution-Alternating Least Squares. Anal. Chim. Acta 2011, 705, 182–192. [Google Scholar] [CrossRef] [PubMed]
- Kucheryavskiy, S.; Windig, W.; Bogomolov, A. Spectral unmixing using the concept of pure variables. In Data Handling in Science and Technology, V. 30. Resolving Spectral Mixtures; Ruckebusch, C., Ed.; Elsevier: Amsterdam, The Netherlands, 2016; pp. 53–99. [Google Scholar] [CrossRef]
- Windig, W.; Bogomolov, A.; Kucheryavskiy, S. Two-Way Data Analysis: Detection of Purest Variables. In Comprehensive Chemometrics: Chemical and Biochemical Data Analysis; Brown, S., Tauler, R., Walczak, B., Eds.; Elsevier: Amsterdam, The Netherlands, 2020; pp. 107–136. [Google Scholar] [CrossRef]
- Da Costa Filho, P.A.; Chen, Y.; Cavin, C.; Galluzzo, R. Mid-infrared spectroscopy: Screening method for analysis of food adulterants in reconstituted skimmed milk powder. Food Control 2022, 136, 108884. [Google Scholar] [CrossRef]
Disclaimer/Publisher’s Note: The statements, opinions and data contained in all publications are solely those of the individual author(s) and contributor(s) and not of MDPI and/or the editor(s). MDPI and/or the editor(s) disclaim responsibility for any injury to people or property resulting from any ideas, methods, instructions or products referred to in the content. |
© 2023 by the authors. Licensee MDPI, Basel, Switzerland. This article is an open access article distributed under the terms and conditions of the Creative Commons Attribution (CC BY) license (https://creativecommons.org/licenses/by/4.0/).