Abstract
In this study, a numerical prediction methodology used to evaluate the fatigue life of complex riveted aluminum alloy structures subjected to variable amplitude loads is presented. This methodology is based on the combination of experimental fatigue tests with the structural stresses approach to generate S(N) curves. Single-riveted specimens (Al5052-H36) with different characteristics (rivet diameter, sheet thickness, assembly configuration) were first tested experimentally. Using a simplified finite element model (FEM) and a probabilistic model to compute the structural stress of these tested samples, fatigue curves for each type of failure encountered during testing (sheet metal and rivet) with a confidence interval were generated. Of the probabilistic models that were studied, the Stüssi model was the most effective to correlate the experimental results. The proposed methodology was then combined with Miner’s law to predict the fatigue life of complex riveted structures subjected to variable amplitude loading. Using the proposed methodology, satisfactory predictions of the fatigue life of multi-rivet specimens and a structural assembly from a recreational vehicle subjected to variable amplitude loads were obtained without the need to use a complex finite element model for the riveted joints. The methodology proposed in this paper is efficient and quick to use, can be used for various states of stress, and is well suited for structural or fatigue optimization problems.
1. Introduction
Fatigue can be defined as the local and progressive damage to a structure that occurs when a material is subjected to cyclic stresses []. The fatigue strength of a structure is dictated by several phenomena related to fracture mechanics as well as the mechanical properties of the material. In the literature, a multitude of models that aim to predict the fatigue life of a material exists. In an industrial context, it is also relevant to take into consideration the simplicity and speed of execution of the numerical tools used since it allows to perform more design iterations, which is highly beneficial when optimizing a complex structure. It is therefore necessary to consider these factors when developing a numerical fatigue life prediction methodology to obtain an effective model that offers the best compromise between speed and precision. In complex structures made with sheet metal, the vast majority of fatigue failures are located at the joints between two different sheets. One of the most common methods to join thin sheet metal is riveting. It is therefore essential to be able to properly predict the behavior of this type of joint when analyzing the fatigue life of complex structural assemblies. The damage accumulation approach is currently the most widely used fatigue life prediction method in industry []. The approach consists of quantifying the damage caused by each load cycle and then summing it up to evaluate the fatigue life of the studied structure. Because of its random nature, fatigue is a difficult phenomenon to predict. Even in a controlled experimental environment, test results can exhibit a high scatter. It is therefore useful to use a deterministic-stochastic model to build probabilistic SN fields (P-S-N field), which gives a better estimate of the fatigue life of a component. In this study, the ASTM 730 model [], the Castillo & Fernendez-Cateli model [] Stüssi model [] are compared to evaluate the most efficient one to predict the fatigue life of complex structures. To make the most of the damage accumulation approach, it is necessary to use an efficient way to evaluate the stress or the strain of the studied structure. Given that a large quantity of structures is subjected to multiaxial forces, it is important to use a fatigue model which makes it possible to model this phenomenon when computing the fatigue of complex assembly. Several reviews in the state of the art deal with these damage criteria [,]. Furthermore, many authors present a brief review of the methodologies used to evaluate the stress of complex assemblies with a numerical model [,,,,,]. Of these methods, the structural stress method [,,,] is based on the calculation of stresses using the nodal forces and moments at the location of the stress concentration with a finite element analysis (FEA). Equations (1)–(3) presented the basis of this methodology.
where and are the linear forces calculated from the nodes of a FEA model and t is the sheet thickness. By using the Von Mises theorem and calculated structural stress, it is possible to obtain an equivalent structural stress amplitude.
In Equation (4), the term is often neglected since it is generally considerably smaller than the other two terms of the equation. If the amplitude of the structural shear stresses is less than one-third of the normal structural stress amplitude, the shear components of Equation (1) can be neglected []. Generally used to carry out fatigue durability analyses of welded components, this method is insensitive regarding the mesh refinement [,]. This particularity of the method is very interesting given that the stress distribution around a geometric discontinuity (weld, edge, radius, etc.) is very mesh sensitive, which can lead to inaccurate fatigue life predictions. For riveted joints, a simplified version of the model exists [,,,,,]. According to this model (1), (2) and (3) become the following for sheet metal failure:
In (5)–(7), d is the diameter of the rivet, and are forces and moments taken directly on the beam element that modelled the rivet. For rivet failure, it is possible to evaluate the stress by using (8) and (9).
In this paper, the structural stress method was used alongside the Stüssi probabilistic model to plot S(N) curves for riveted joints. These curves were then used to predict the fatigue life of complex structures subjected to variable amplitude loads. It was shown that the proposed methodology can accurately predict the fatigue life of complex structures.
2. Material and Methods
2.1. Aluminum Alloy and Rivet Descriptions
The material of the sheet metal used during this study is the AA5052-H36. The mechanical properties of this alloy are given in Table 1. The dimensions and mechanical properties of the two rivets used in this study are presented in Table 2.

Table 1.
Mechanical properties of AA5052-H36.

Table 2.
Rivet description.
2.2. Single-Riveted Specimen Preparation and Mechanical Testing
Four joint configurations were tested experimentally to characterize the behavior of rivet joints to develop a numerical prediction model. The overall dimensions of the samples are presented in Figure 1 and the main characteristics of the samples are presented in Table 3. For the single-lap joint samples, spacers were used to align the samples properly in the jaws of the testing apparatus. Fatigue tests were carried out on an MTS Test frame 322 hydraulically controlled machine. Twelve samples for each configuration were tested using a load ratio of 0.1. For each configuration, samples were divided into four loading levels. Single-lap samples were tested with a frequency of 5 Hz. Coach peel samples were tested with a frequency of 3 Hz to compensate for high displacements measured during testing., This slight difference in frequency has a negligible effect on the results for aluminum alloys [,]. Acoustic emission monitoring (AE) was performed using the Vallen acoustic system (AMSY-6) equipped with 2 piezoelectric sensors attached at the mid-width of the tested specimen (with adhesive tape) to detect fatigue crack initiation. The piezoelectric transducers (VS150-M) have a band width of 100–450 kHz with a peak of 150 kHz. Each sensor is connected to a preamplifier that transmits analogic signals to a sixth-channel acquisition and treatment unit, with a gain set at 40 dB. A noise threshold of 50 dB was used to analyze the data.

Figure 1.
Single-riveted Specimen dimensions (mm); (a) Single lap joint samples; (b) Coach peel samples.

Table 3.
Single-riveted samples characteristics.
2.3. Multi Riveted Specimen Preparation and Mechanical Testing
For the multi-riveted samples, two different configurations were tested experimentally. The overall dimensions of the samples are shown in Figure 2. As with single-riveted specimens, spacers were used for single-lap samples to eliminate any misalignment issues. The same load ratio (0.1) and frequency (5 Hz single lap and 3 Hz coach peel) were used for the fatigue tests of these samples. The main characteristics of the multi-riveted samples used are presented in Table 4. Fatigue tests were carried out with the six samples of each configuration on an MTS Test frame 322. For each configuration, 3 samples were tested with a constant amplitude load and three samples were tested using a variable amplitude load. The main features of these loads are presented in Table 5 and Table 6. AE monitoring was performed to detect fatigue crack initiation using the Vallen system and four piezoelectric sensors.

Figure 2.
Multi Riveted Specimen dimensions (mm); (a) Single lap joint samples; (b) Coach peel sample.

Table 4.
Multi-riveted samples Characteristics.

Table 5.
Multi-riveted fatigue test—Constant amplitude loads description.

Table 6.
Muti-rivet fatigue test—Variable amplitude loads description (unit N).
2.4. Module E Specimen Preparation and Mechanical Testing
To validate the efficiency of the developed fatigue prediction methodology, fatigue tests were carried out on a complex assembly. This assembly, called the module E, is presented in Figure 3a. The main components of this assembly are presented in Table 7. Figure 3b presents the test setup used for this series of tests and indicates the direction of the load applied to the structure. Note that the rivet Avibulb (see Table 2) is used to make this assembly. AE monitoring was performed to detect fatigue crack initiation using the Vallen system and six piezoelectric sensors. As a reminder, a description of the acoustic emission chain is presented in Section 2.2. Fatigue tests were carried out on three samples with an MTS Test frame adapted for large vehicles. Each test was performed with a variable amplitude load (load ratio = 0.1). These loads are presented in Table 8.
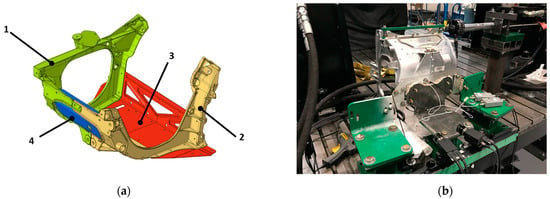
Figure 3.
Module E presentation (a) Module E components; (b) Test setup.

Table 7.
Module E components description.

Table 8.
Module E test—load definition.
2.5. Numerical Model
Numerical simulations were performed with Altair’s Optistruct implicit solver. To model the rivet, a beam element fixed with rigid elements to the aluminum sheets is used. This modeling approach is quick and easy to implement, even for an assembly that has a lot of rivets. Figure 4 shows the numerical models used. In this study, the simplified approach is used to evaluate the structural stress. For module E, the two aluminum castings are modeled with tetra10 solid elements.
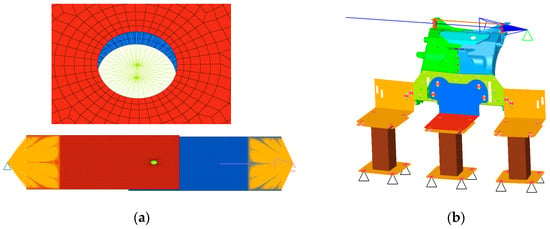
Figure 4.
Finite element models (a) Single lap joint samples & Coach peel samples; (b) Module E.
3. Results and Discussions
3.1. Single-Rivet Joint
Using the structural stress method, the results from all the experimental tests can be combined on the same S(N) curve. Given that two different types of failure were observed during the experimental tests (sheet metal failure and rivet failure), it is, however, necessary to group the samples into two different curves. Figure 5 and Figure 6 show the P-S-N probabilistic fields obtained with the ASTM E739, the Castillo model, and the Stüssi model for the two types of failure.
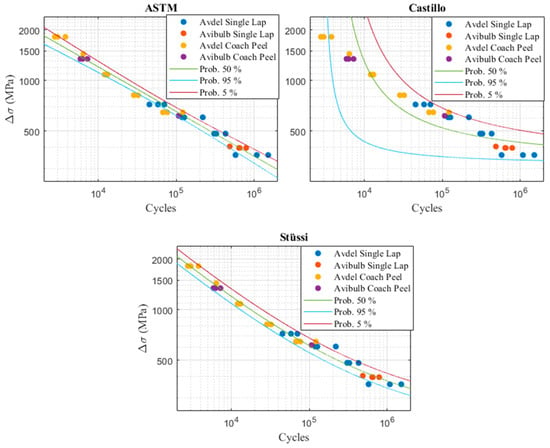
Figure 5.
Probabilistic Models—Sheet Metal Failure.
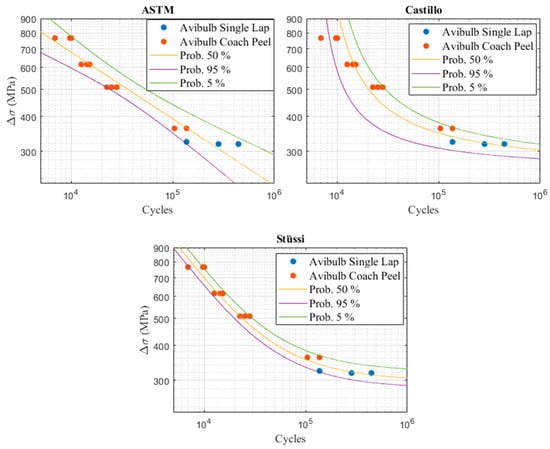
Figure 6.
Probabilistic Models—Rivet failure.
In the two previous figures, one can notice that the probabilistic model of Castillo is less efficient than the other two models, especially for the aluminum sheets failure S(N) curve. Castillo’s model is usually effective for fatigue predictions ranging from a medium to a high number of cycles. It is therefore somewhat effective to plot the P-S-N field of the rivet failure S(N) curve. On the other hand, this model is less efficient if the experimental samples follow a linear line (in a log-log scale), as is the case for the samples that had a sheet metal failure. The ASTM model also has several shortcomings. Indeed, this model is only relevant for a linear fatigue curve (in log-log scale) and assumes that the sample distribution follows a normal law. However, this is generally not the case in fatigue. The ASTM model is therefore not effective in plotting the two extremities of a probabilistic field (for a low or a high number of cycles). It is, however, more efficient than the Castillo model to plot properly the P-S-N field that expresses the crack initiation of the aluminum sheet. For both types of failure, the Stüssi model is the most efficient overall. It will therefore be used for the rest of this study to predict the fatigue life of complex structures.
3.2. Complex Assembly Fatigue Life Prediction
It is possible to evaluate the critical structural stress numerically for the multi-rivet samples and combine this result with the experimentally evaluated fatigue life to validate whether the proposed methodology can correctly predict the fatigue life of each sample. Figure 7 presents the results obtained for the samples that were tested at a constant amplitude. As shown in this figure, each experimental result is set between the 5% and the 95% confidence interval. The developed methodology can therefore predict accurately the fatigue life of multi-rivet samples subjected to a constant load for several stress amplitudes and for the two failure modes encountered during the experimental testing phase.
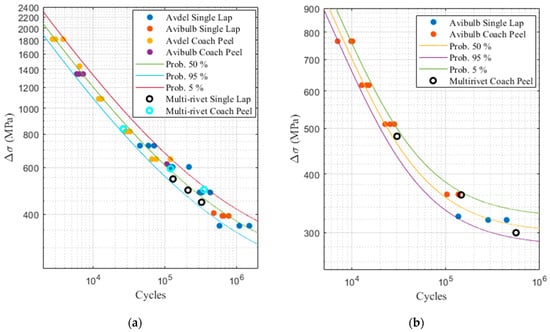
Figure 7.
Multi-rivet sample (a) sheet metal failure (b) rivet failure.
By using the structural stress evaluation method with Miner’s law, it was also possible with the developed methodology to predict accurately the fatigue life of complex structures subjected to a variable amplitude load. As shown in Table 9, the fatigue life of each specimen tested except one is inside the 5–95% prediction interval. The fatigue of the only exception is close to the 5% survival prediction, which means that the proposed approach is a bit conservative.

Table 9.
Variables amplitude predictions of complex assemblies.
4. Conclusions
This study presents an innovative methodology to evaluate the fatigue life of complex riveted aluminum alloy structures. The methodology advocates a probabilistic approach by combining a simple finite element model with experimental fatigue tests with distinct characteristics. During the development of the methodology, it was possible to make several important observations. These are the following:
- The simplified structural stress evaluation method is effective in combining on a single (N) curve the experimental results of several specimen configurations with distinct characteristics (rivet diameter, covering and peeling configurations, sheet thickness);
- Stüssi’s probabilistic model is the most effective in expressing the fatigue behavior of riveted joints in fatigue;
- Miner’s law is effective in evaluating the accumulated fatigue damage of complex riveted assemblies.
Author Contributions
Conceptualization, F.C.; methodology, F.C.; validation, A.D., A.M. and F.C.; formal analysis, F.C.; writing—original draft preparation, F.C.; writing—review and editing, F.C.; supervision, A.M.; project administration, A.D.; funding acquisition, A.D. All authors have read and agreed to the published version of the manuscript.
Funding
This research was funded by the Natural Sciences and Engineering Research Council of Canada (NSERC) and the Advanced Materials Research and Innovation hub (PRIMA Quebec).
Institutional Review Board Statement
Not applicable.
Informed Consent Statement
Not applicable.
Data Availability Statement
The data are not publicly available due to privacy.
Conflicts of Interest
The authors declare no conflict of interest.
References
- Alam, M. A Study of the Fatigue Behaviour of Laser and Hybrid Laser Welds. Doctoral Dissertation, Luleå University of Technology, Luleå, Sweden, 2009. [Google Scholar]
- Cui, W. A state-of-the-art review on fatigue life prediction methods for metal structures. J. Mar. Sci. Technol. 2002, 7, 43–56. [Google Scholar] [CrossRef]
- ASTM E739-10(2015); Standard Practice for Statistical Analysis of Linear or Linearized Stress-Life (S-N) and Strain-Life (ε-N) Fatigue Data. ASTM: West Conshohocken, PA, USA, 2009; pp. 1–7.
- Castillo, E.; Canteli, A.C.F. A Unified Statistical Methodology for Modeling Fatigue Damage; Springer: Berlin/Heidelberg, Germany, 2009; pp. 1–232. [Google Scholar]
- Barbosa, J.F.; Correia, J.A.; Júnior, R.F.; Zhu, S.-P.; De Jesus, A.M. Probabilistic S-N fields based on statistical distributions applied to metallic and composite materials: State of the art. Adv. Mech. Eng. 2019, 11, 1–22. [Google Scholar] [CrossRef]
- Fatemi, A.; Shamsaei, N. Multiaxial fatigue: An overview and some approximation models for life estimation. Int. J. Fatigue 2011, 33, 948–958. [Google Scholar] [CrossRef]
- Santecchia, E.; Hamouda, A.M.S.; Musharavati, F.; Zalnezhad, E.; Cabibbo, M.; El Mehtedi, M.; Spigarelli, S. A Review on Fatigue Life Prediction Methods for Metals. Adv. Mater. Sci. Eng. 2016, 2016, 9573524. [Google Scholar] [CrossRef]
- Rami, K. Modern Fatigue Analysis Methodology for Laser Welded Joints. Master’s Thesis, University of Oulu, Oulu, Finland, 2018. [Google Scholar]
- Maddox, S. Review of fatigue assessment procedures for welded aluminium structures. Int. J. Fatigue 2003, 25, 1359–1378. [Google Scholar] [CrossRef]
- Caccese, V.; Blomquist, P.; Berube, K.; Webber, S.; Orozco, N. Effect of weld geometric profile on fatigue life of cruciform welds made by laser/GMAW processes. Mar. Struct. 2006, 19, 1–22. [Google Scholar] [CrossRef]
- Fricke, W. Fatigue analysis of welded joints: State of development. Mar. Struct. 2003, 16, 185–200. [Google Scholar] [CrossRef]
- Hobbacher, A.F. Recommendations for Fatigue Design of Welded Joints and Components, 2nd ed.; Springer: Cham, Switzerland, 2016. [Google Scholar]
- Dong, P. A structural stress definition and numerical implementation for fatigue analysis of welded joints. Int. J. Fatigue 2001, 23, 865–876. [Google Scholar] [CrossRef]
- Wu, X.; Wei, Z.; Kang, H.; Khosrovaneh, A. A Structural Stress Recovery Procedure for Fatigue Life Assessment of Welded Structures; SAE Technical Papers; SAE International: Warrendale, PA, USA, 2017; Volume 2017. [Google Scholar]
- Shen, W.; Yan, R.; Barltrop, N.; Liu, E.; Song, L. A method of determining structural stress for fatigue strength evaluation of welded joints based on notch stress strength theory. Int. J. Fatigue 2016, 90, 87–98. [Google Scholar] [CrossRef]
- Xiao, Z.-G.; Yamada, K. A method of determining geometric stress for fatigue strength evaluation of steel welded joints. Int. J. Fatigue 2004, 26, 1277–1293. [Google Scholar] [CrossRef]
- Hong, J.K.; Forte, T.P. Fatigue evaluation procedures for multiaxial loading in welded structures using battelle structural stress approach. In Proceedings of the International Conference on Offshore Mechanics and Arctic Engineering—OMAE, San Francisco, CA, USA, 8–13 June 2014; Volume 5, pp. 1–9. [Google Scholar]
- Kang, H.T.; Dong, P.; Hong, J. Fatigue analysis of spot welds using a mesh-insensitive structural stress approach. Int. J. Fatigue 2007, 29, 1546–1553. [Google Scholar] [CrossRef]
- Seyedi, A.; Guler, M.A. Mesh Insensitive Structural Stress Method for Fatigue Analysis of Welded Joints Using the Finite Element Method. In Proceedings of the International Advanced Technologies Symposium (IATS’17), Elazığ, Turkey, 19–22 October 2017. [Google Scholar]
- Cox, A.; Hong, J. Fatigue Evaluation Procedure Development for Self-Piercing Riveted Joints Using the Battelle Structural Stress Method; SAE Technical Papers; SAE International: Warrendale, PA, USA, 2016. [Google Scholar]
- Kang, H.T.; Khosrovaneh, A.; Su, X.; Lee, Y.-L.; Guo, M.; Jiang, C.; Li, Z. A Fatigue Life Prediction Method of Laser Assisted Self-Piercing Rivet Joint for Magnesium Alloys. SAE Int. J. Mater. Manuf. 2015, 8, 789–794. [Google Scholar] [CrossRef]
- Rao, H.M.; Kang, J.; Huff, G.; Avery, K. Structural Stress Method to Evaluate Fatigue Properties of Similar and Dissimilar Self-Piercing Riveted Joints. Metals 2019, 9, 359. [Google Scholar] [CrossRef]
- Kang, H.-T.; Boorgu, S. Fatigue Life Prediction of Self-Piercing Rivet Joints Between Magnesium and Aluminum Alloys. MATEC Web Conf. 2018, 165, 10004. [Google Scholar] [CrossRef]
- Turlier, D.; Facchinetti, M.; Wolf, S.; Raoult, I.; Delattre, B.; Magnin, A.; Grimonprez, N. Seam weld shell element model for thin walled structure FE fatigue design. MATEC Web Conf. 2018, 165, 21007. [Google Scholar] [CrossRef][Green Version]
- Hong, J.K. The Development of a Simplified Spot Weld Model for Battelle Stuctural Stress Calculation. SAE Int. J. Mater. Manuf. 2011, 4, 602–612. [Google Scholar] [CrossRef]
- Schneider, N.; Bödecker, J.; Berger, C.; Oechsner, M. Frequency effect and influence of testing technique on the fatigue behaviour of quenched and tempered steel and aluminium alloy. Int. J. Fatigue 2016, 93, 224–231. [Google Scholar] [CrossRef]
- Mayer, H.; Papakyriacou, M.; Pippan, R.; Stanzl-Tschegg, S. Influence of loading frequency on the high cycle fatigue properties of AlZnMgCu1.5 aluminium alloy. Mater. Sci. Eng. A 2001, 314, 48–54. [Google Scholar] [CrossRef]
Disclaimer/Publisher’s Note: The statements, opinions and data contained in all publications are solely those of the individual author(s) and contributor(s) and not of MDPI and/or the editor(s). MDPI and/or the editor(s) disclaim responsibility for any injury to people or property resulting from any ideas, methods, instructions or products referred to in the content. |
© 2023 by the authors. Licensee MDPI, Basel, Switzerland. This article is an open access article distributed under the terms and conditions of the Creative Commons Attribution (CC BY) license (https://creativecommons.org/licenses/by/4.0/).