
Urban Heat Island Intensity Prediction in the Context of Heat Waves: An Evaluation of Model Performance †


Abstract
1. Introduction
2. Methods
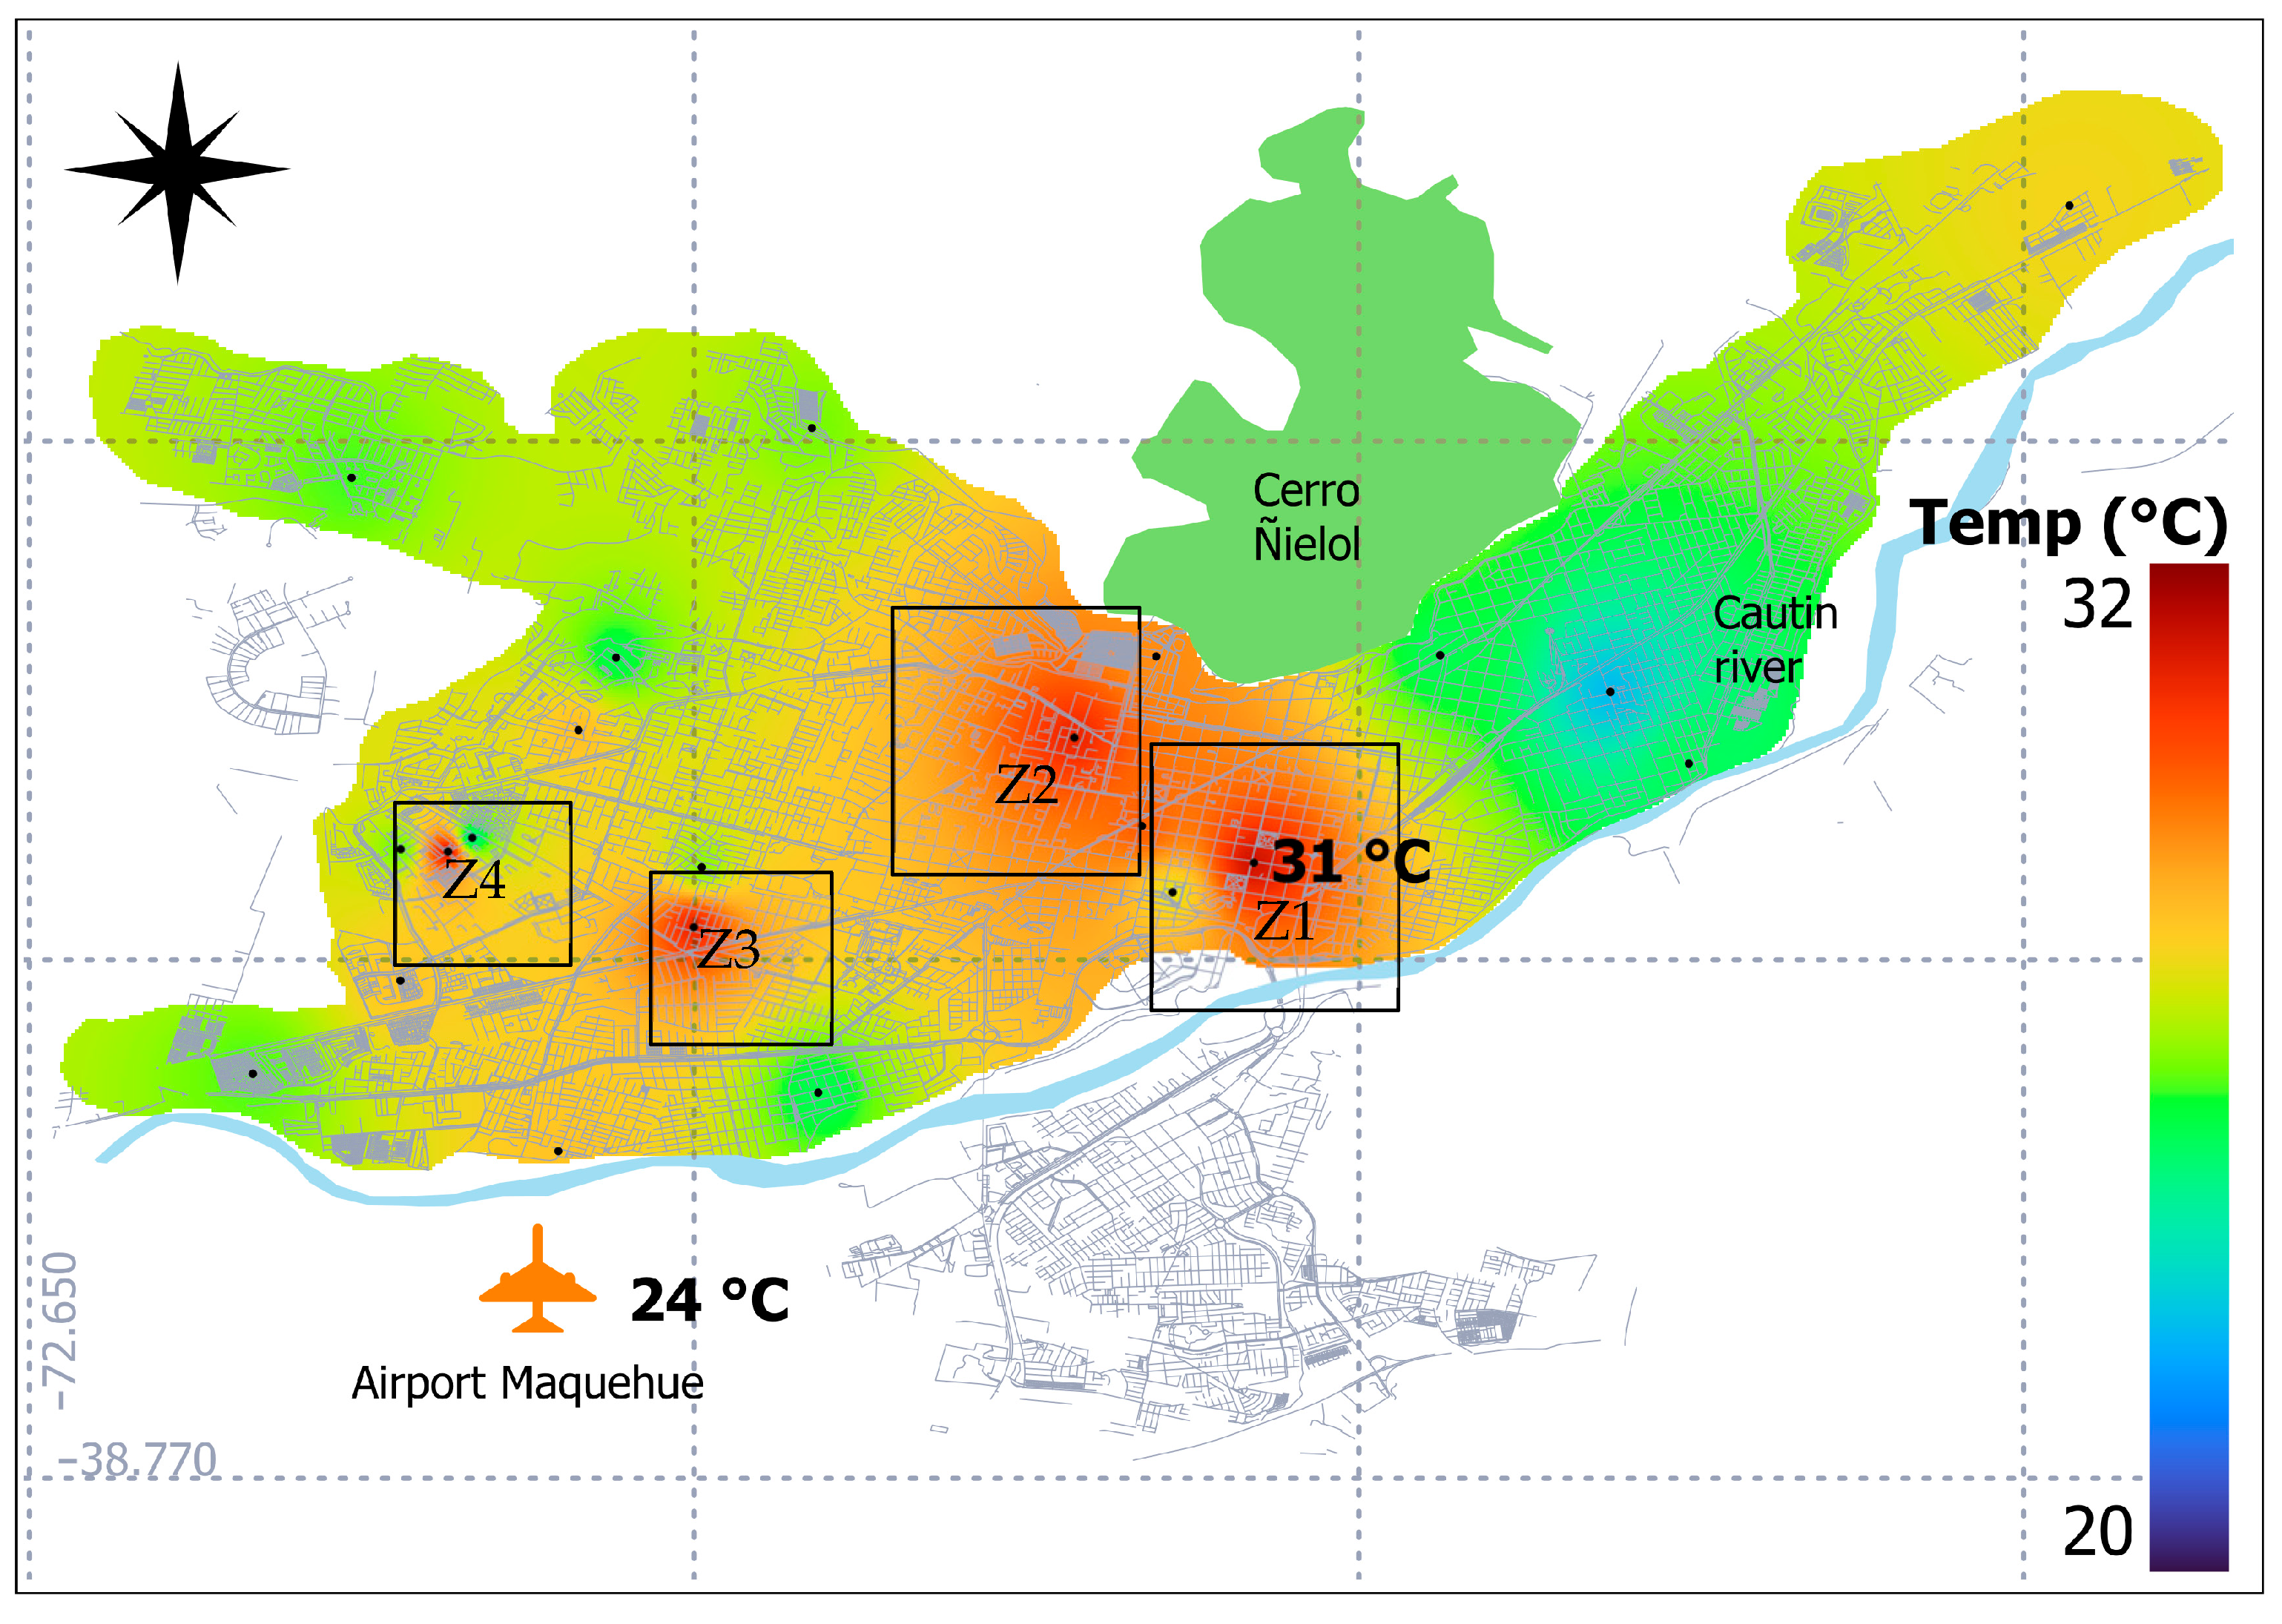
2.1. Case Study
2.2. Measurement of the Temperature and Mapping of the Heat Island
2.3. Prediction of Heat Islands during Heatwaves
- = temperature;
- = reference temperature (measured at the Maquehue airport);
- = time of a day in hours (1, 2 … 24);
- = zone in Temuco where heat islands are identified (1, 2, 3, 4).
3. Results
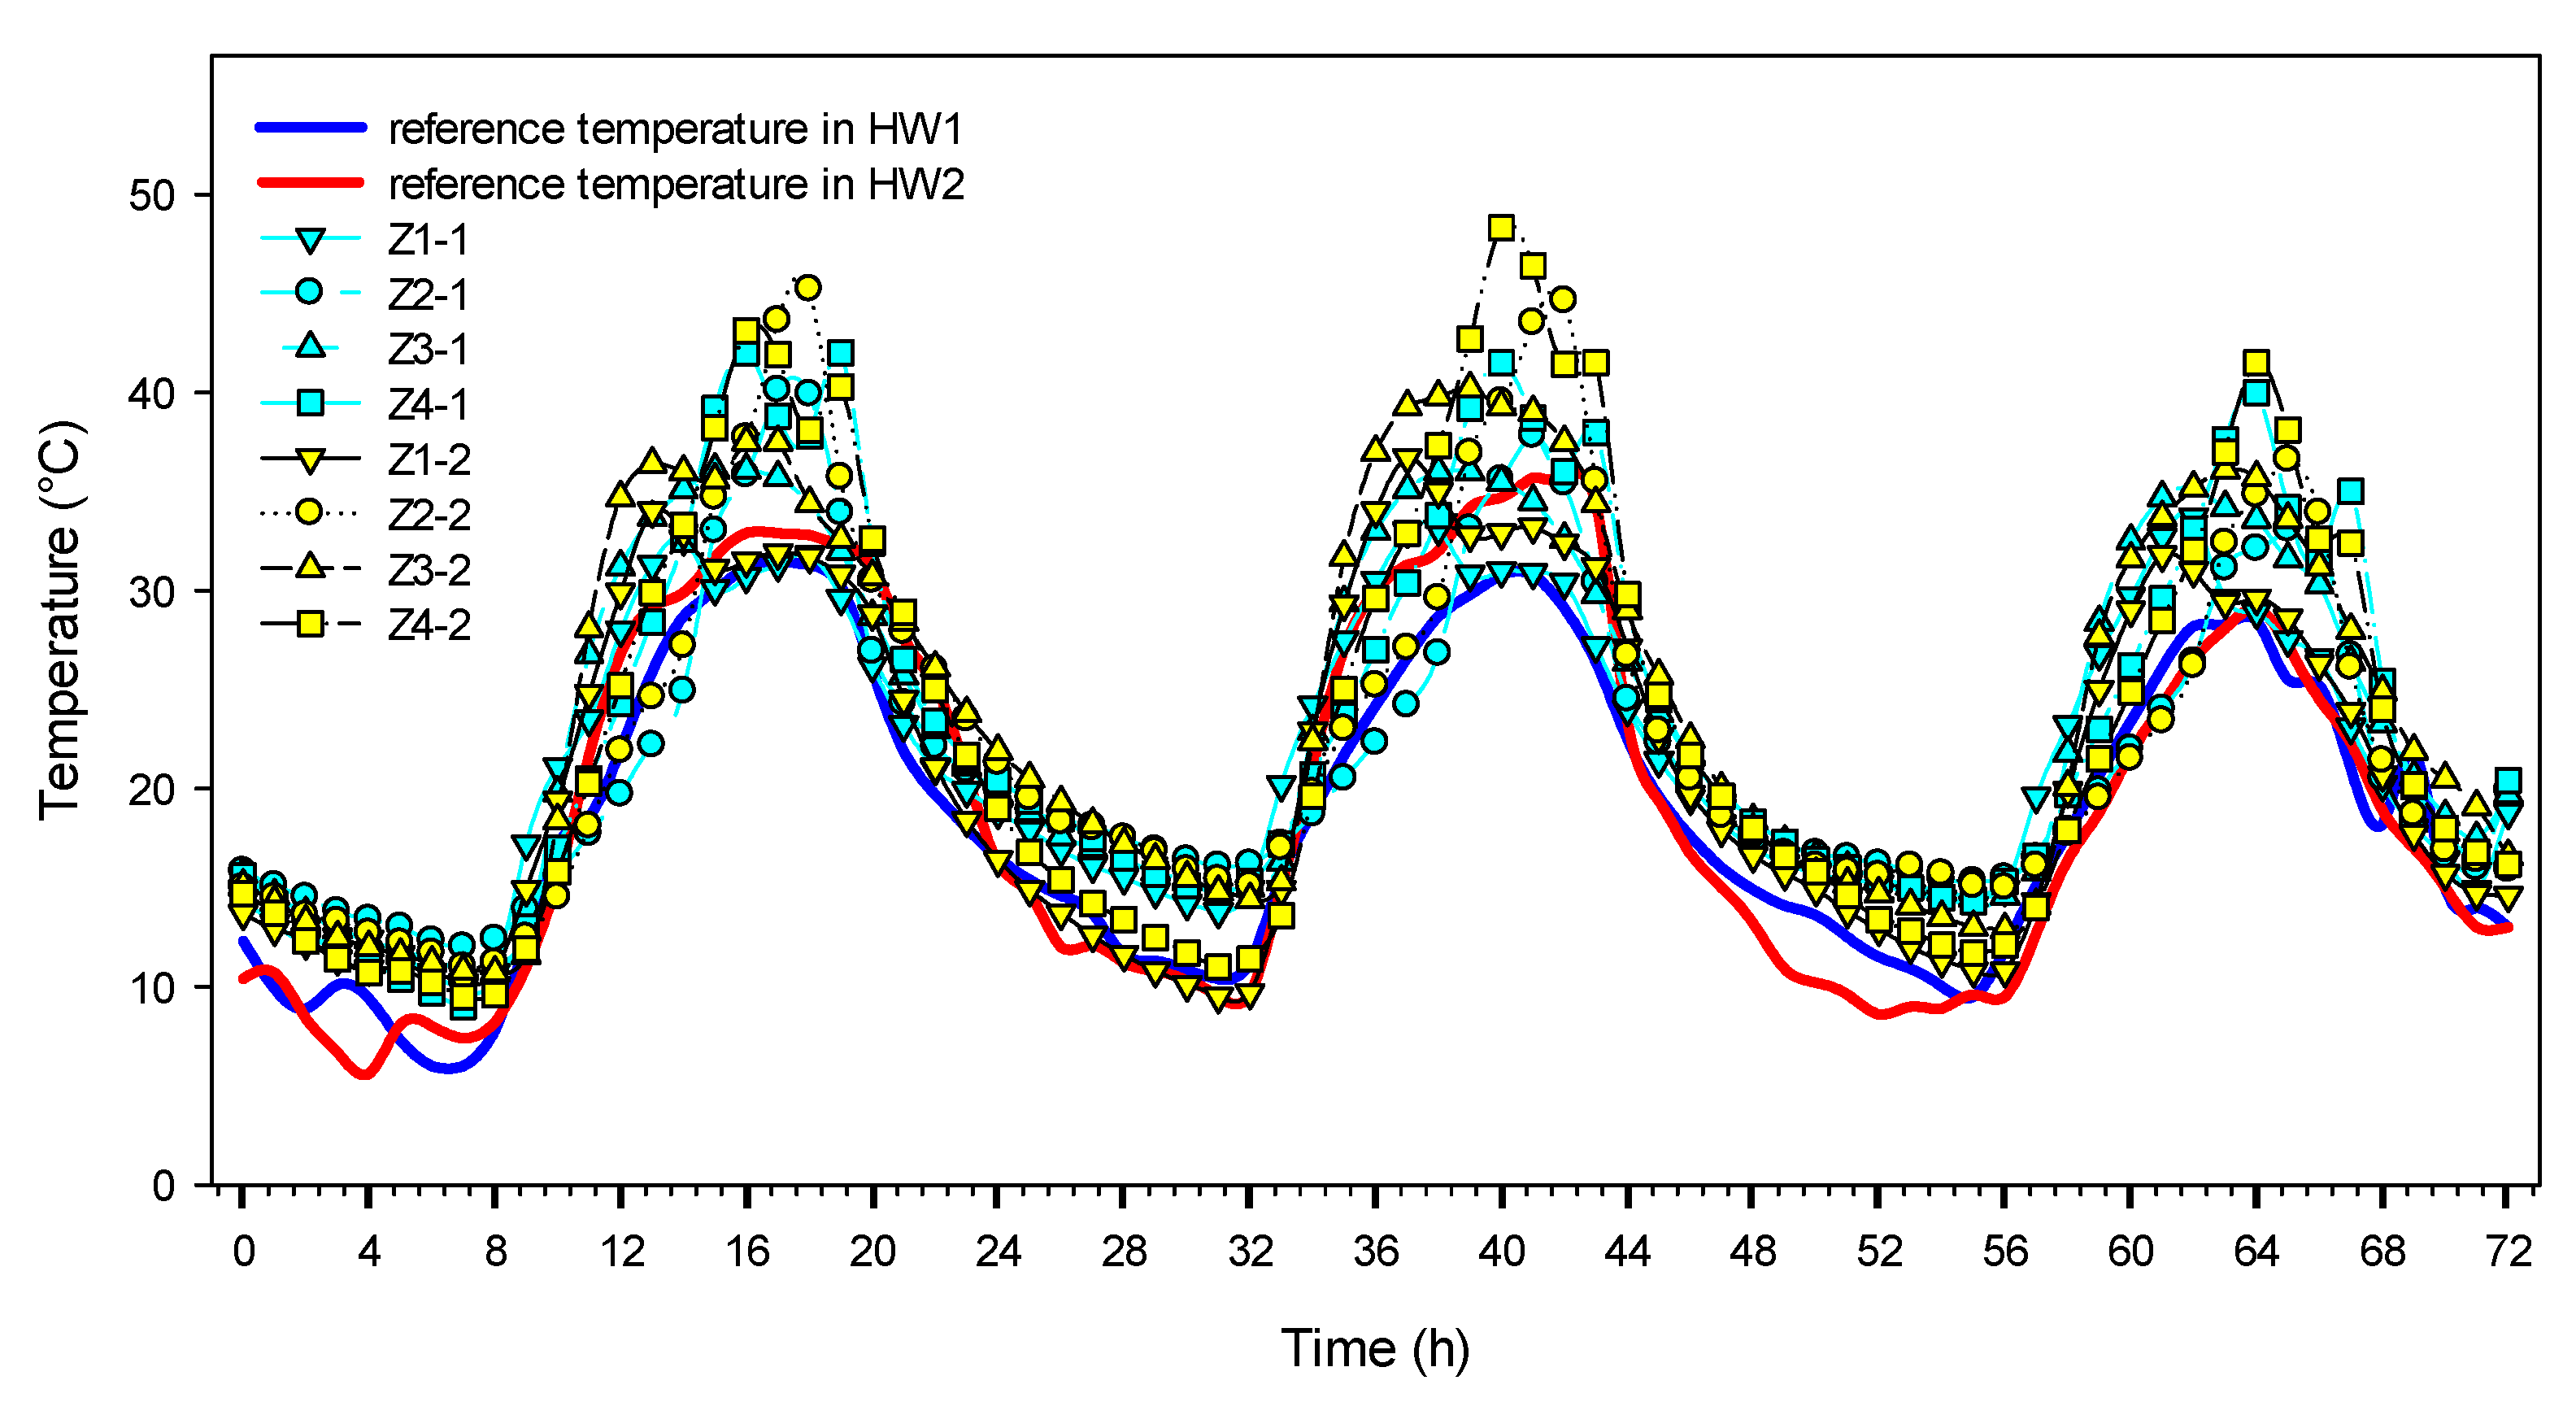
3.1. Measurement and Recording of Temperatures during Heatwave Conditions
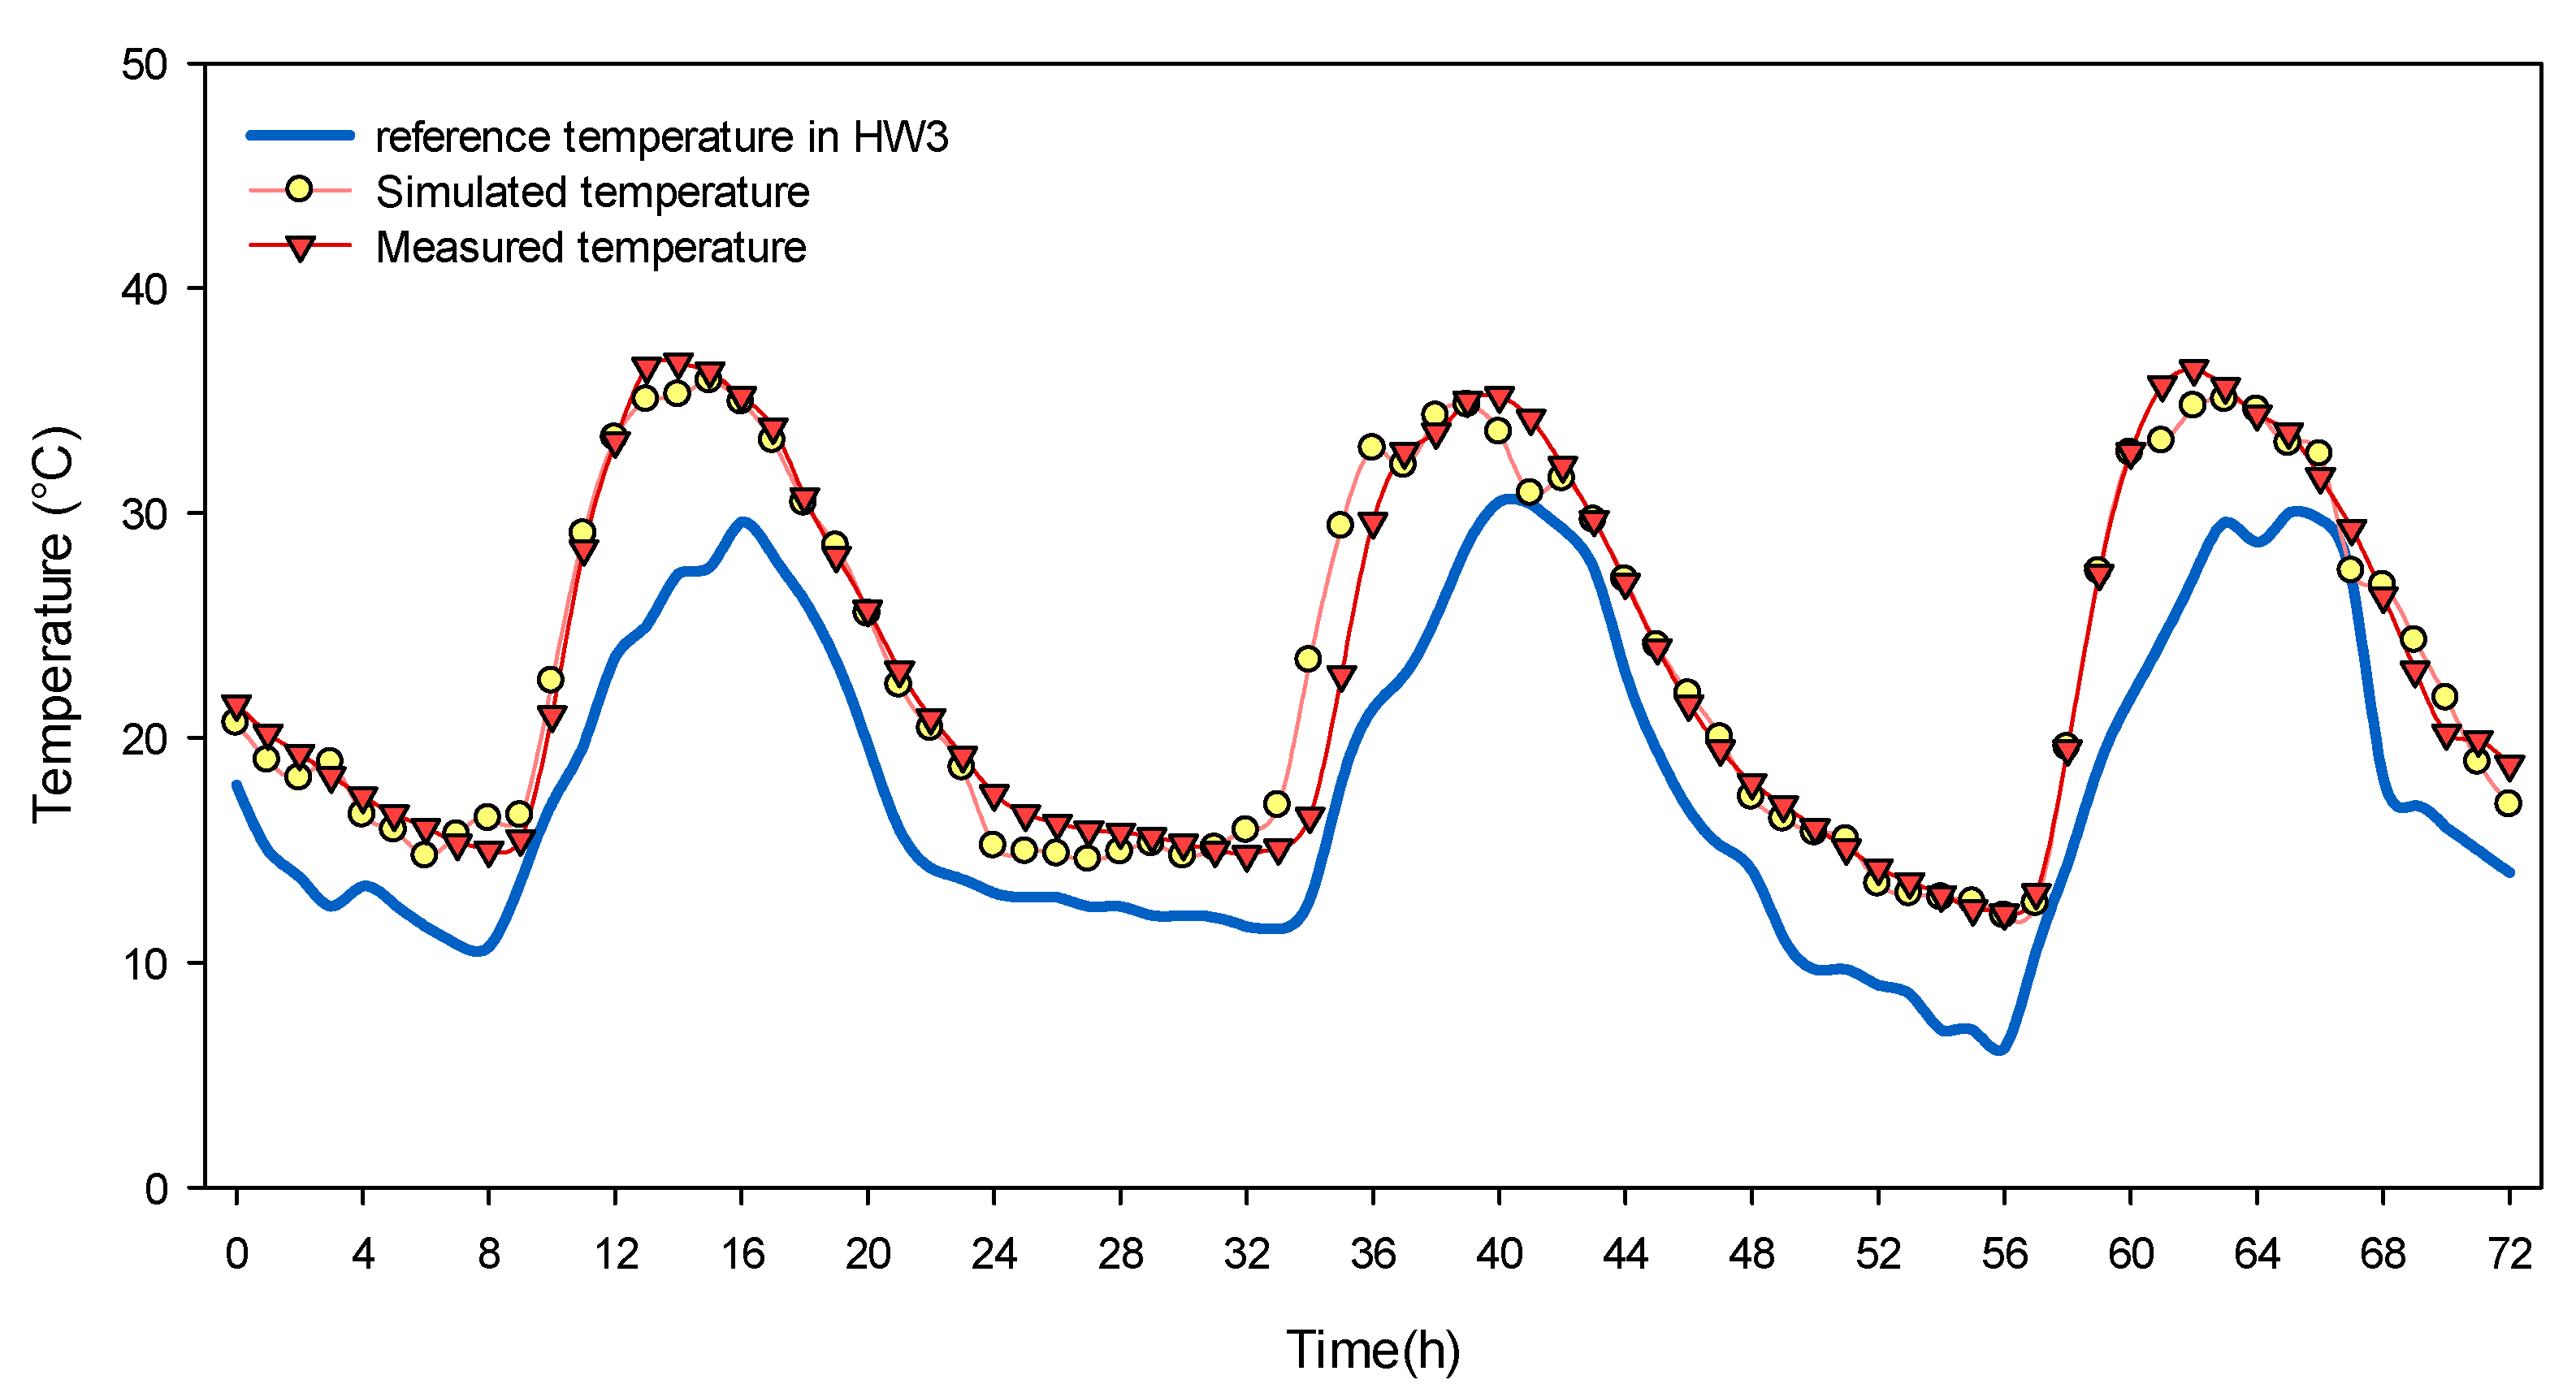
3.2. Prediction of Temperatures during Heatwave Conditions
4. Conclusions
Author Contributions
Funding
Institutional Review Board Statement
Informed Consent Statement
Data Availability Statement
Conflicts of Interest
References
- García-Cueto, O.R.; Jáuregui-Ostos, E.; Toudert, D.; Tejeda-Martinez, A. Detection of the Urban Heat Island in Mexicali, BC, México and Its Relationship with Land Use. Atmosfera 2007, 20, 111–131. [Google Scholar]
- Kuznetsova, I.N.; Brusova, N.E.; Nakhaev, M.I. Moscow Urban Heat Island: Detection, Boundaries, and Variability. Russ. Meteorol. Hydrol. 2017, 42, 305–313. [Google Scholar] [CrossRef]
- Feinberg, A. Urban Heat Island Amplification Estimates on Global Warming Using an Albedo Model. SN Appl. Sci. 2020, 2, 2178. [Google Scholar] [CrossRef]
- Liu, Z.; Zhan, W.; Bechtel, B.; Voogt, J.; Lai, J.; Chakraborty, T.; Wang, Z.H.; Li, M.; Huang, F.; Lee, X. Surface Warming in Global Cities Is Substantially More Rapid than in Rural Background Areas. Commun. Earth Environ. 2022, 3, 219. [Google Scholar] [CrossRef]
- Narumi, D.; Levinson, R.; Shimoda, Y. Effect of Urban Heat Island and Global Warming Countermeasures on Heat Release and Carbon Dioxide Emissions from a Detached House. Atmosphere 2021, 12, 572. [Google Scholar] [CrossRef]
- Santamouris, M.; Cartalis, C.; Synnefa, A.; Kolokotsa, D. On the Impact of Urban Heat Island and Global Warming on the Power Demand and Electricity Consumption of Buildings—A Review. Energy Build. 2015, 98, 119–124. [Google Scholar] [CrossRef]
- Robine, J.M.; Cheung, S.L.K.; Le Roy, S.; Van Oyen, H.; Griffiths, C.; Michel, J.P.; Herrmann, F.R. Death Toll Exceeded 70,000 in Europe during the Summer of 2003. Comptes Rendus-Biol. 2008, 331, 171–178. [Google Scholar] [CrossRef] [PubMed]
- Hashim, N.M.; Ahmad, A.; Abdullah, M. Mapping Urban Heat Island Phenomenon: Remote Sensing Approach. J.-Inst. Eng. 2007, 68, 25–30. [Google Scholar]
- Elmarakby, E.; Khalifa, M.; Elshater, A.; Afifi, S. Tailored Methods for Mapping Urban Heat Islands in Greater Cairo Region. Ain Shams Eng. J. 2022, 13, 101545. [Google Scholar] [CrossRef]
- Abrar, R.; Sarkar, S.K.; Nishtha, K.T.; Talukdar, S.; Shahfahad; Rahman, A.; Islam, A.R.M.T.; Mosavi, A. Assessing the Spatial Mapping of Heat Vulnerability under Urban Heat Island (UHI) Effect in the Dhaka Metropolitan Area. Sustainability 2022, 14, 4945. [Google Scholar] [CrossRef]
- Kopecká, M.; Szatmári, D.; Holec, J.; Feranec, J. Urban Heat Island Modelling Based on MUKLIMO: Examples from Slovakia. AGILE GIScience Ser. 2021, 2, 5. [Google Scholar] [CrossRef]
- Hafner, J.; Kidder, S.Q. Urban Heat Island Modeling in Conjunction with Satellite-Derived Surface/Soil Parameters. J. Appl. Meteorol. 1999, 38, 448–465. [Google Scholar] [CrossRef]
- Voelkel, J.; Shandas, V. Towards Systematic Prediction of Urban Heat Islands: Grounding Measurements, Assessing Modeling Techniques. Climate 2017, 5, 41. [Google Scholar] [CrossRef]
- Wang, K.; Aktas, Y.D.; Stocker, J.; Carruthers, D.; Hunt, J.; Malki-Epshtein, L. Urban Heat Island Modelling of a Tropical City: Case of Kuala Lumpur. Geosci. Lett. 2019, 6, 4. [Google Scholar] [CrossRef]
- Dorigon, L.P.; Amorim, M.C.d.C.T. Spatial Modeling of an Urban Brazilian Heat Island in a Tropical Continental Climate. Urban Clim. 2019, 28, 100461. [Google Scholar] [CrossRef]
- Xu, M.; Bruelisauer, M.; Berger, M. Development of a New Urban Heat Island Modeling Tool: Kent Vale Case Study. Procedia Comput. Sci. 2017, 108, 225–234. [Google Scholar] [CrossRef]
- Kubilay, A.; Allegrini, J.; Strebel, D.; Zhao, Y.; Derome, D.; Carmeliet, J. Advancement in Urban Climate Modelling at Local Scale: Urban Heat Island Mitigation and Building Cooling Demand. Atmosphere 2020, 11, 1313. [Google Scholar] [CrossRef]
- Garzón, J.; Molina, I.; Velasco, J.; Calabia, A. A Remote Sensing Approach for Surface Urban Heat Island Modeling in a Tropical Colombian City Using Regression Analysis and Machine Learning Algorithms. Remote Sens. 2021, 13, 4256. [Google Scholar] [CrossRef]
- Khan, A.; Chatterjee, S.; Wang, Y. Urban Heat Island Modeling for Tropical Climates; Elsevier: Amsterdam, The Netherlands, 2020. [Google Scholar]
- Kim, S.W.; Brown, R.D. Urban Heat Island (UHI) Intensity and Magnitude Estimations: A Systematic Literature Review. Sci. Total Environ. 2021, 779, 146389. [Google Scholar] [CrossRef] [PubMed]


Disclaimer/Publisher’s Note: The statements, opinions and data contained in all publications are solely those of the individual author(s) and contributor(s) and not of MDPI and/or the editor(s). MDPI and/or the editor(s) disclaim responsibility for any injury to people or property resulting from any ideas, methods, instructions or products referred to in the content. |
© 2023 by the authors. Licensee MDPI, Basel, Switzerland. This article is an open access article distributed under the terms and conditions of the Creative Commons Attribution (CC BY) license (https://creativecommons.org/licenses/by/4.0/).
Share and Cite
Martinez-Soto, A.; Fürle, J.; Zipf, A. Urban Heat Island Intensity Prediction in the Context of Heat Waves: An Evaluation of Model Performance. Eng. Proc. 2023, 39, 80. https://doi.org/10.3390/engproc2023039080
Martinez-Soto A, Fürle J, Zipf A. Urban Heat Island Intensity Prediction in the Context of Heat Waves: An Evaluation of Model Performance. Engineering Proceedings. 2023; 39(1):80. https://doi.org/10.3390/engproc2023039080
Chicago/Turabian StyleMartinez-Soto, Aner, Johannes Fürle, and Alexander Zipf. 2023. "Urban Heat Island Intensity Prediction in the Context of Heat Waves: An Evaluation of Model Performance" Engineering Proceedings 39, no. 1: 80. https://doi.org/10.3390/engproc2023039080
APA StyleMartinez-Soto, A., Fürle, J., & Zipf, A. (2023). Urban Heat Island Intensity Prediction in the Context of Heat Waves: An Evaluation of Model Performance. Engineering Proceedings, 39(1), 80. https://doi.org/10.3390/engproc2023039080