Abstract
This paper presents a study on the creation of a tool to help powerlifting athletes and coaches, as well as bodybuilders and other amateur gym athletes, to analyse their data and obtain useful information regarding the athlete’s performance. The tool should also predict future personal records in lifting for both raw (non-equipped) and non-raw (equipped) attempts, and their various exercises. In order to achieve this, a dataset with entries of around 500 k lifters and more than 20 k official powerlifting competitions was used. Among those entries, biometric variables of the lifters and the weights they lift in each of the three movements of this sport discipline were included: squat, bench press, and deadlift. We applied data preprocessing and visualising as well as data splitting and scaling techniques in order to train the machine learning models that are used to make the predictions. Lastly, the best predictive models were used in the implemented tool.
Keywords:
powerlifting; forecasting; prediction; dataset; data mining; data visualisation; machine learning 1. Introduction
Lifting exercises are classified as sports, and the category ranges from well-known sports, such as football (soccer) and basketball, to less popular sports, such as strongman, weightlifting, or powerlifting. Most of the popular sports also incorporate lifting exercises to increase performance. For instance, soccer players perform squats or deadlifts to enhance their sprint or jump performance.
Powerlifting is a sport that focuses on three movements: squat, bench Press, and deadlift. In this sport, the lifter has three attempts to perform one repetition in each movement with as much weight as possible. Competitions start with the squat and finish with the deadlift, where each lifter has three attempts in each exercise to lift the highest load they can. These competitions are known as SBD, which stands for the first letter of each movement. However, there are also competitions focused on only one of the lifts or a combination of them. In addition, attempts can also be either performed with or without equipment, such as squat suits, compression bands, and slingshots, among others. The equipped attempts are known as non-raw, whereas unequipped trials are called raw trials.
Progressive overload is the key to achieving an increase in performance over time. To improve in a particular movement, the lifter must increase the weight being lifted. However, knowing when to increase the weight is not straightforward, and can have negative consequences for the athlete, such as nervous fatigue, muscle fatigue, performance reduction, or demotivation. Performing such highly demanding lifts, for example, a one-repetition max (1RM), also has additional risks associated with it.
Nowadays, some free online tools are available for athletes to estimate their 1RM based on their weight, age, height, and their results from less-demanding weight lifts, such as 5RM, 3RM, etc. However, there are no tools that can predict or estimate how much weight someone can lift in equipped powerlifting according to the same biometric inputs and their 1RM performance in non-equipped powerlifting, and vice versa.
Thus, the purpose of this work is to build a tool that can predict the future performance of lifters in both raw and non-raw competitions according to their current records in either discipline. It will be based on the application of data mining and machine learning methods on a complete real dataset, comprising data from more than 500 k athletes, both women and men, and belonging to different age and weightlifting category ranges. The application will allow lifters to predict how much a raw athlete will lift in a future non-raw competition, or how well a non-raw lifter can perform in a raw competition, based on their current progress in the raw/non-raw discipline.
To this end, an exploratory data analysis was conducted in order to better understand the data, and to extract some estimates that could be useful for the prediction models. Then, several regression algorithms were tuned and applied to the dataset in order to predict future weightlifting results from current variables, such as the athlete’s gender, bodyweight, previous records, and equipment use.
2. Related Work
There are few studies in the literature related to powerlifting predictions. We have reviewed the main ones, which have served as inspiration and are the basis for comparison in the present study. In addition, these works have some weaknesses and flaws that have been addressed in our study.
- Analysis of USA Powerlifting Federation data (2012–2016) [1]: This work highlights the importance of considering equipped and raw powerlifting as different sports, and the substantial differences in performance between the two disciplines. Squats and bench presses are much more affected by equipment than deadlifts due to their eccentric and concentric phases. Lifters do not benefit as much from equipment when performing deadlifts, since there is no eccentric phase. Given this, in our study, we analysed raw and equipped lifting separately, and also considered gender differences. Women tend to reach their plateau sooner than men, but their performance declines earlier. Males reach their peak performance later, but tend to hold it for a much longer time period. The ideal age for performance ranges from 24 to 39 years, with the mean age established at 30 years. This work [1] has some limitations, such as the limited amount of data and the tedious process of manually searching through the International Powerlifting Federation (IPF) website. In our study, we processed an already well-developed database from OpenPowerlifting. Published statistics in [1] regarding ages, weights, genders, raw vs. equipped, and exercises were used as a reference for further analysis. We complement this information with additional graphic resources and analyses, in order to gain further insights.
- Influence of Compressive Gear on Powerlifting Performance: Role of Blood Flow Restriction Training [2]: In this paper, the blood occlusion induced by compressive gear is described. The summary proposes that the occlusion can be maximum while performing squats. That is, the gear used in non-raw competitions can totally occlude the blood flow in the legs, which resulted in an increase in performance. What is more, this increase is not as significant either in bench presses or deadlifts. This may be due to the nature of the movement itself (deadlift) and the fact that it lacks an eccentric phase, or that it is impossible to totally occlude the muscles involved in the exercise (pectoral muscles in bench press) to such an extent as is possible with squats. The fact of the matter is, wearing such gear will still increase the performance in both movements, especially when compared to raw users, but not to the extent as in squats. However, the deadlift is the least affected out of the three. For these reasons, the idea of splitting the dataset into two different disciplines (raw vs. equipped) was reinforced.
- The Role of FFM Accumulation and Skeletal Muscle Architecture in Powerlifting Performance [3]: The importance of distinguishing between muscle mass and fat mass was explained in this study. Basically, it shows that more fat-free mass (FFM), i.e., muscle, is related to performance in powerlifting: the more the better. However, it is still limited by the muscle structure itself, as well as the muscle longitude and the degree in which those muscle fibres are distributed. All these variables are involved in determining how much strength each muscle section can produce. All in all, the more fat-free mass the lifter has, the stronger they will be, and stronger athletes tend to lift heavier weights, making them better-performing powerlifters.
- The Effect of Experimental Alterations in Excess Mass on Pull-Up Performance in Fit Young Men [4]: In this work, the authors explain how the differences in body fat percentage of a lean athlete (low body fat) and a heavier one (high body fat) can affect their pull-up and their bench press performance. To begin with, they show that there is a strong relationship between how heavy the lifter is (tall and/or muscular individual), or how high their body fat percentage is, and performance, since increasing body fat percentage by 10% will result in a significant reduction in performance (fewer repetitions). It is said that this could apply to other forms of exercise, such as the bench press. So, if an individual lifts 100 kg for eight repetitions, and this same individual adds 10 kg to the bar, they will then only be able to perform four repetitions, that is, half of what they achieved previously (assuming eight repetitions is close to the athlete’s maximum performance). It is shown that pull-ups are not as good at measuring an athlete’s performance as they are at measuring their bodyweight, either as body fat percentage or muscle mass. Essentially, this work showed us how important it is to take the athlete’s weight into consideration when analysing our own dataset, since variations in weight do make a difference.
- Adjusting Powerlifting Performances for Differences in Body Mass [5]: In this work, there is a comparison between the formulas of Stiff and Sinclair as well as other aspects that must be taken into consideration when working with a dataset similar to the one we used. It is said that the Stiff formula is better, since it works regardless of weight, and this makes it more accurate than the Sinclair formula. Additionally, it is advised that one separates the data for males and females, as well as raw and non-raw, and thus avoids mixing everything together. It also mentions that the larger the number of instances the better. The key lesson we learned from this study is that it is very important to split the database into different groups, even though, supposedly, the fact that one group is raw and the other is non-raw does not influence the results of the Stiff formula as much as it does the Sinclair formula, since the former does not use the weight variable in its calculations, whereas the latter does.
In summary, the majority of the studies mentioned are in agreement that there are two disciplines (raw and non-raw), and they should be considered as two different sports altogether. For these reasons, in our study, we compared them as separate disciplines and sports from the beginning. Doing so provides further insights as to how these powerlifting variations compare to one another. More importantly, it will allow us to see how our results compare to those of [1], the most important work to date on this topic, given the fact that the considered database in our study has considerably more instances and it is up to date. Additionally, our study provides a very detailed visualisation of gender distribution, both at the very beginning of the sport and in current years, as well as how it fluctuates throughout the months and years. Finally, we showcase the record evolution for each movement according to gender and year.
3. Dataset Description
Data were obtained from a website named OpenPowerlifting [6]. It includes information about almost every international powerlifting competition since 1965 to present, and is constantly updated.
The dataset contains information about every lifter: name, age, gender, weight, age class, weight class, the three attempts of every movement (squat, bench, and deadlift), as well as a column with the best out of the three, and the sum of those best three. There is even information about whether or not the athletes were drug tested. It also contains data concerning the competition (powerlifting meet) itself: name, country, state, town, federation, parent federation, and date of the event.
Finally, it also provides the results of some formulas relevant to the sport, such as Goodlift (whether or not a certain lift was performed correctly), or Wilks/Glossbrenner/Dots (three different computations of the relative strength of the lifter according to their bodyweight category), as well as the lifter’s place in each meet. However, these last variables are not considered in our model.
As described above, the dataset holds a great deal of information. In fact, the initial dataset had 41 columns (features), of which 22 were floats and the others were strings or dates. From these, we selected 19, these variables being the most relevant according to previous studies. They can be seen in Table 1.

Table 1.
Selected variables for our study.
The dataset considered in the present study can be downloaded from https://openpowerlifting.gitlab.io/opl-csv/bulk-csv.html (accessed on 20 June 2023). There was a preprocessing step, in which the data were anonymised, unknown values were removed, and the patterns were separated by sex and equipment use, and grouped into age ranges.
After this, a preliminary exploratory analysis was conducted (described in the following section) in order to visualise and better understand the data.
4. Exploratory Data Analysis
This is an initial analysis of the considered dataset, which aims to show the magnitudes and distribution of the data as well as to present some facts about them to take into account. It is important to remind the reader that raw means ‘unequipped attempt’, while non-raw corresponds to an ‘equipped attempt’.
First of all, the number of samples can be seen in Table 2, grouped by gender and equipment use.
Table 2.
Total number of samples per gender. Each one corresponds to the best weight lift attempt by each athlete in a competition for each of the three movements (squat, bench press, and deadlift).
As can be seen in the table, the amount of data is more than 1.5 million samples, whereas in the reference work [1], the data included 15,800 men and 6000 women patterns. Thus, we can push our study much further than the previous work, reaching stronger conclusions, i.e., better supported by the data.
Figure 1 plots the data in a density graph, grouped by gender, showing the distribution of samples per age range and per athlete weight class (weightlifting athletes compete in a different category or class according to their bodyweight as well as their gender).
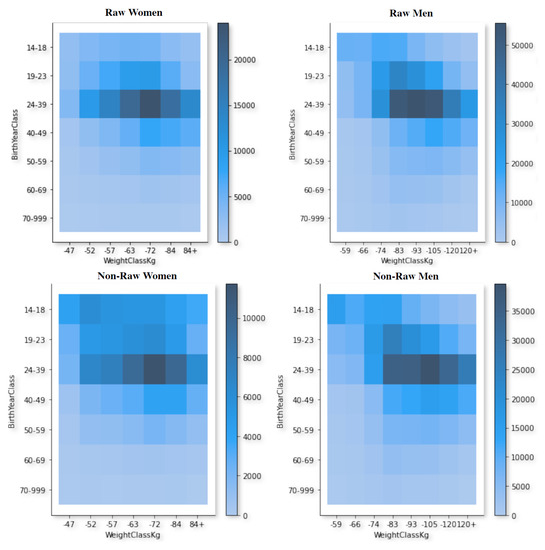
Figure 1.
Women’s and men’s distributions by age range and weight categories according to the equipment used in their weight lift attempts. The colour of each cell represents the number of samples/instances in that specific age range and weight category (the darker the colour, the higher the number).
As can be seen in the density graphs, there are subtle distinctions that can be perceived. It seems that for non-raw male lifters, the weight category with the highest density is the under 105 kg category, whereas for raw lifters, the most common weight class is under the 93 kg category, followed very closely by the under 83 kg and under 105 kg categories. In spite of this, the age range in all of them is 24–39 years, as was also concluded from the previous study [1]. The graphs also show that, in the most popular weight classes for both men and women, there is a more balanced gender distribution in raw competitions, compared to equipped ones, in which there is a higher degree of male density (around 3.5 times more males than females).
With regard to the performance, we have analysed how it behaves according to each gender, equipment, and lift. Figure 2 and Figure 3 show box plots of the weights lifted by the athletes according to their weight category.
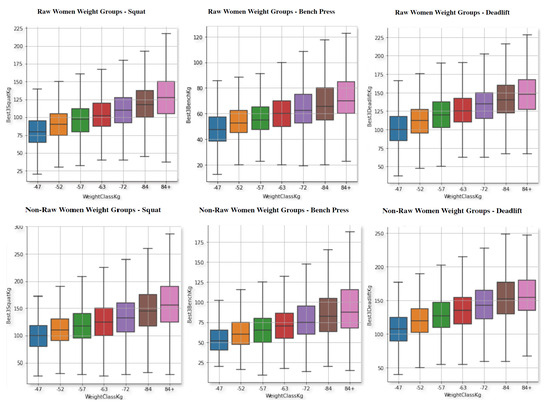
Figure 2.
Powerlifting weight in the three movements for women, raw (top) and non-raw (bottom), separated by weight categories.
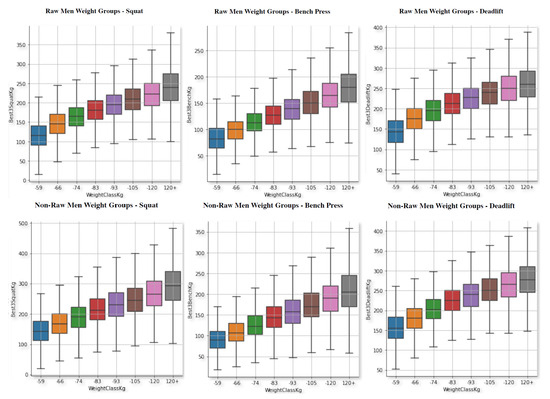
Figure 3.
Powerlifting in the three movements for men, raw (top) and non-raw (bottom), separated by weight categories.
There are obvious trends, such as the correlation between the weight lifted and the weight class. Moreover, as expected, the main result is the positive impact of the equipment on the increase in performance in both genders and for all the weight classes. This affects men much more than women. Furthermore, the use of equipment does not help as much in deadlifts as in other movements.
The following analysis is similar to the previous one, but focused on the age range of the athletes. Thus, Figure 4 and Figure 5 show box plots of the weights lifted by the athletes according to their age category.
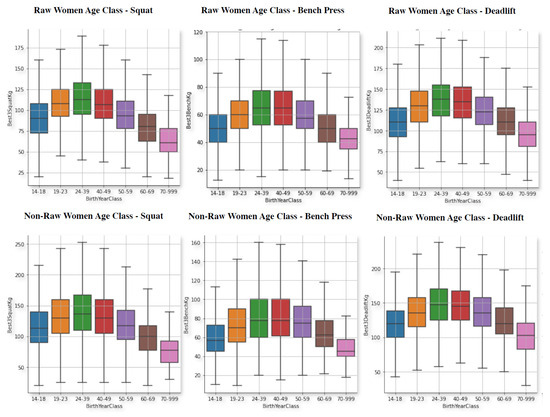
Figure 4.
Powerlifting weight in the three movements for women, raw (top) and non-raw (bottom), separated by age ranges.
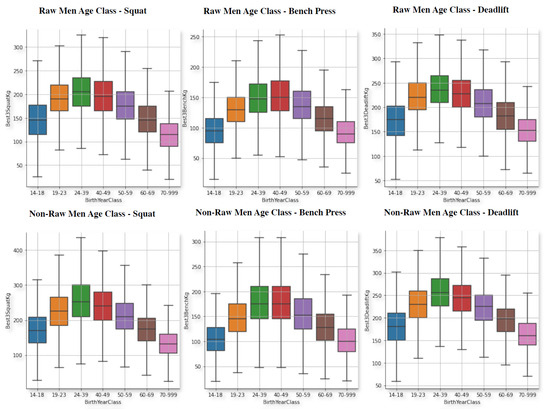
Figure 5.
Powerlifting in the three movements for men, raw (top) and non-raw (bottom), separated by age ranges.
It is interesting to see, that the best performing age group is, in all of them 24 to 39 years of age. Which is the same age group, that has the highest amount of lifters as shown in Figure 1. Nonetheless, in the bench press exercise the differences between 40 to 49 yeas of age and this age group are almost non existent. So, it could be possible to say that in this particular movement, women and men tend to perform equally as good as the younger lifters or that athletes tend to maintain their bench press performance much better compared to the other two movements. In addition, with this data, it is save to say that younger male and female athletes perform better across all the movements except for bench press, where the differences are not as big and, in fact, can be surpassed by older athletes in the 40 to 49 age group. It is important to note, that the actual differences between 24–39 and 40–49 are not that notorious in any of the exercises to begin with, and neither in raw males or females. Additionally, it is confirmed, as pointed in [1] that males tend to reach their peak performance later than women and also hold it for longer, whereas women reach it faster but lose it sooner, as well. For instance, this can be perceived when looking at the performance in the youngest age group (blue) versus the 60–69 year group (brow box). For males, the performance is always either equal or even higher but for females is equal or lower.
Finally, we have analysed the evolution of the records per movement along the years. The data are plotted in Figure 6.
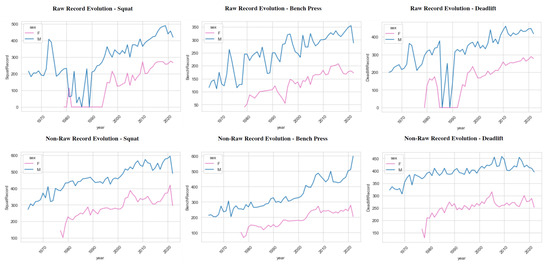
Figure 6.
Records evolution along the years in the three movements for females (pink graphs) and males (blue graphs). Raw (top) and non-raw (bottom).
As can be seen, there are some missing pieces of information in a few periods, such as in the 1980s for squats and deadlifts, probably due to poor accuracy in the recollection of data. Moreover, there are no data for women before 1980. This is because women did not compete in the sport until this time. Furthermore, it is not until after 1995, more or less, that we start to see a somewhat steady increase in records, whereas before that date, the graph is rather unpredictable. The record improvement is a factor that everyone would logically consider important. Meaning that, in every sport, every year, new records are being set, due to improvements in techniques, coaching methods, and so on. Naturally, this applies for raw weightlifting as well. With regard to equipped powerlifting, there is a clear difference. Here, there are no years missing and the graphs show a very smooth increase in records year after year. As expected, the records for non-raw are much higher than for raw (since they wear performance-increasing gear).
In the following section, we will focus on the prediction of weightlifting for athletes.
5. Regression Models
In this section, we apply machine learning models to the data in order to predict results based on certain inputs. First of all, the dataset was preprocessed, removing the instances dating before 1996, since they could be deleterious during the learning phase of the model, as shown in the record evolution analysis in the previous section. Weight and age categories were also removed because they were redundant with regard to weight and age columns. Moreover, the Event column (describes the movement the athlete performed) was also removed, since it is information we decided not to address given the fact that we would create specific models for each movement, and that the vast majority of the instances were athletes that actually performed all three movements (squat, bench, and deadlift, also known as ‘SBD’). We converted data in every column to integers. After this step, the ‘Sex’ column had only two values: ‘0’ for females and ‘1’ for males. Additionally, the ‘Equipment’ column followed the same strategy: ‘0’ for raw and ‘1’ for non-raw. We noticed that some athletes shared exactly the same name; in these instances, we removed inconsistent data. We performed a combination of all the instances for every athlete, with several comparisons between instances on a two-by-two basis (internally renamed as ‘X’ and ‘Y’). This allowed us to compute a new variable ‘DiffDays’, where we stored the difference in days between the date of one instance and the other being compared. These actions provided us with the chance to select only those entries where the difference was no greater than 2 years and had a positive value (only predicting the future). By doing this, our model was capable of accurately predicting an athlete’s performance up to 2 years into the future.
At this point, the dataset was ready to work, considering all the instances were correct and in numeric format, with only the essential and most relevant columns: sex; current equipment; current age; current bodyweight; current best squat, bench, and deadlift; future equipment; future age; future squat, bench, and deadlift; and the number of days until the next competition (‘DiffDays’). Then, we separated the data into a different dataset per movement so that we could use a model devoted to each one of them. We split the datasets into 75% for training and 25% for testing.
Before applying the machine learning models, we analysed the relationship in terms of correlation between the dependent variable (‘Y’), which is the weight lift per movement, and the rest of the variables (‘X’), using Seaborn heat maps. The results can be seen in Figure 7.
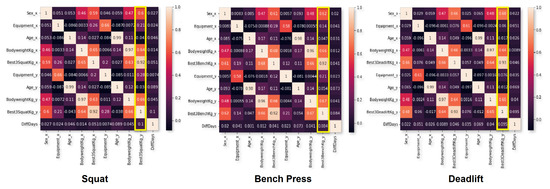
Figure 7.
Correlation between features in each dataset (one per movement). Yellow rectangle highlights the target column.
As can be seen in the figure (squat subgraph), for the ‘X’ axis target column (“Best3SquatKg_y”), the “Best3SquatKg_x” feature is the the most influential towards the target (value 0.92), followed by future bodyweight (0.64), current bodyweight (0.62), sex (0.6), future equipment (0.28), and current equipment (0.2). The same results can be also seen in the case of bench press and deadlift, where the current ‘_x’ best weight lifted, in that particular movement, is the feature with the strongest correlation towards the target best future weight lifted column ‘_y’.
We then used different regression models, since our goal was to predict a single numeric value depending on other numeric values. We applied linear, lasso, and ridge regression [7], as well as KNN [8], random forest [9], and decision tree [10] algorithms for regression. Additionally, we applied MARS (multivariate adaptive regression splines) [11] and ANN [12]. The configurations of all the methods were tuned after an exhaustive experimentation process, mainly in the case of the random forest ( finally having 150 estimators, 5 minimum samples split, 1 minimum sample leaf, and no bootstrap) and ANN (3 layers: 9-4-1 neurons, RELU-TANH activation functions, MAE as loss metric, 128 batch size, 20 epochs). For all the methods, we computed, as performance metrics, the mean square error (MSE) [13], the mean absolute error (MAE) [14], and R-squared ( Score), or the coefficient of determination [15], which indicates the percentage of the dependent variable interpreted from the independent variables, i.e., how well the regression model fits the data.
Table 3.
Squat—regression model results.
Table 4.
Bench press—regression model results.
Table 5.
Deadlift—regression model results.
All the tables show the best performance with the random forest method, followed very closely by ANN and KNN, with an between 91% and 92%, depending on the problem/movement, which is a relatively reliable result for a forecasting tool such as the one we aimed to build. However, the generated models in the case of the random forest required almost 20 GB of hard disk space, while ANN models only required 100 KB, which is a remarkable difference for just a 1% difference in ; so, in order to be used in a software tool, we chose to apply ANN models.
This tool has actually been implemented and deployed on the following website: https://medinajromero-webapptestfinal-webapplocal-6zlgiv.streamlitapp.com (accessed on 25 May 2023).
Figure 8 shows the webpage where the prediction application can be used.
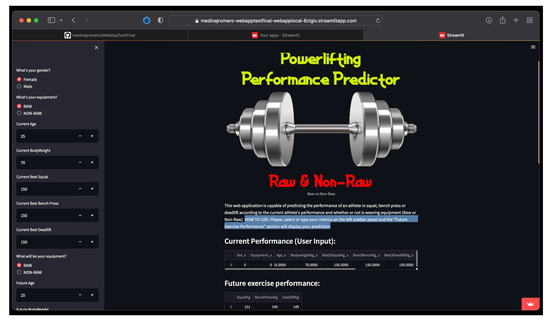
Figure 8.
Webpage created with the implementation of the prediction tool.
The users can input their data, i.e., gender, current equipment (raw or non-raw), current age, current bodyweight, current best lift in each movement (squat, bench press, and deadlift), and their future age (could be the same), future bodyweight (could be the same), future equipment (can be raw or non-raw, in order to predict how much of a difference in performance the equipment will make), and the number of days until the desired competition takes place. The output will present the expected weight lift results for each of the movements.
6. Conclusions and Future Work
This paper presents a study on the creation of a tool based on machine learning (regression models) for the prediction of future results in powerlifting competitions for athletes. It takes into account gender, age range, weight category, and the possible use of equipment for the different attempts at three movements: squat, bench press, and deadlift.
To this end, a large dataset (more than 1.5 million instances) has been extracted and processed. After an exploratory analysis and a data preparation procedure, several regression techniques were applied to the data, obtaining (coefficient of determination of the regression models) results of around 91–92%. An artificial neural network was chosen as the predictor, and an actual web-based tool has been implemented.
This tool will be helpful for lifters and their trainers to assess whether they should compete in one competition or another without having to repeat lifts or wear uncomfortable equipment. This will help prevent unnecessary stress to their bodies, and save time associated with repeating lifts. The tool will also provide useful insights for trainers to monitor the progress of their athletes and help them prepare for future competitions.
As future work, we could try to improve the models’ performances in certain ways, maybe using a meta-optimisation process on the parameters of each model by means of evolutionary algorithms.
Author Contributions
Conceptualization: J.M.-R. and A.M.M.; methodology: A.M.M. and J.M.-R.; software development: J.M.-R. and P.Á.C.; validation: J.F.V.-V., P.Á.C. and A.M.M.; formal analysis: all the authors; data preprocessing: J.F.V.-V. and P.Á.C.; data visualization, J.M.-R., P.Á.C. and A.M.M.; writing: J.M.-R. and A.M.M.; supervision: A.M.M.; project administration: J.F.V.-V. and A.M.M.; funding acquisition, J.F.V.-V. All authors have read and agreed to the published version of the manuscript.
Funding
This work was partially funded by projects PID2020-113462RB-I00 (ANIMALICOS), PID2020-115570GB-C22, and PID2020-115570GB-C21, granted by the Ministerio Español de Economía y Competitividad; project TED2021-129938B-I00, granted by the Ministerio Español de Ciencia e Innovación; projects P18-RT-4830 and A-TIC-608-UGR20, granted by Junta de Andalucía; and project B-TIC-402-UGR18 (FEDER and Junta de Andalucía).
Institutional Review Board Statement
Not applicable.
Informed Consent Statement
Not applicable.
Data Availability Statement
Data used in this study can be found at https://openpowerlifting.gitlab.io/opl-csv/bulk-csv.html (acceded on 20 June 2023).
Conflicts of Interest
The authors declare no conflict of interest.
References
- Ball, R.; Weidman, D. Analysis of USA powerlifting federation data from January 1, 2012–June 11, 2016. J. Strength Cond. Res. 2018, 32, 1843–1851. [Google Scholar] [CrossRef] [PubMed]
- Godawa, T.M.; Credeur, D.P.; Welsch, M.A. Influence of compressive gear on powerlifting performance: Role of blood flow restriction training. J. Strength Cond. Res. 2012, 26, 1274–1280. [Google Scholar] [CrossRef] [PubMed]
- Brechue, W.F.; Abe, T. The role of FFM accumulation and skeletal muscle architecture in powerlifting performance. Eur. J. Appl. Physiol. 2002, 86, 327–336. [Google Scholar] [CrossRef] [PubMed]
- Vanderburgh, P.M.; Edmonds, T. The effect of experimental alterations in excess mass on pull-up performance in fit young men. J. Strength Cond. Res. 1997, 11, 230–233. [Google Scholar]
- Cleather, D.J. Adjusting powerlifting performances for differences in body mass. J. Strength Cond. Res. 2006, 20, 412–421. [Google Scholar] [PubMed]
- OpenPowerlifting. Available online: https://www.openpowerlifting.org (accessed on 25 May 2023).
- Freedman, D.A. Statistical Models: Theory and Practice; Cambridge University Press: Cambridge, UK, 2009. [Google Scholar]
- Kramer, O.; Kramer, O. K-nearest neighbors. In Dimensionality Reduction with Unsupervised Nearest Neighbors; Springer: Berlin/Heidelberg, Germany, 2013; pp. 13–23. [Google Scholar]
- Ho, T.K. Random decision forests. In Proceedings of the IEEE 3rd International Conference on Document Analysis and Recognition, Montreal, QC, Canada, 14–16 August 1995; Volume 1, pp. 278–282. [Google Scholar]
- Edwards, W.; Von Winterfeldt, D.; Moody, D.L. Simplicity in decision analysis: An example and a discussion. In Decision Making: Descriptive, Normative, and Prescriptive Interactions; Cambridge University Press: Cambridge, UK, 1988; pp. 443–464. [Google Scholar]
- Friedman, J.H. Multivariate adaptive regression splines. Ann. Stat. 1991, 19, 1–67. [Google Scholar] [CrossRef]
- Haykin, S. Neural Networks and Learning Machines, 3/E; Pearson Education India: Uttar Pradesh, India, 2009. [Google Scholar]
- Bickel, P.J.; Doksum, K.A. Mathematical Statistics: Basic Ideas and Selected Topics, Volumes I-II Package; CRC Press: Boca Raton, FL, USA, 2015. [Google Scholar]
- Hyndman, R.J.; Koehler, A.B. Another look at measures of forecast accuracy. Int. J. Forecast. 2006, 22, 679–688. [Google Scholar] [CrossRef]
- Draper, N.R.; Smith, H. Applied Regression Analysis; John Wiley & Sons: Hoboken, NJ, USA, 1998; Volume 326. [Google Scholar]


Disclaimer/Publisher’s Note: The statements, opinions and data contained in all publications are solely those of the individual author(s) and contributor(s) and not of MDPI and/or the editor(s). MDPI and/or the editor(s) disclaim responsibility for any injury to people or property resulting from any ideas, methods, instructions or products referred to in the content. |
© 2023 by the authors. Licensee MDPI, Basel, Switzerland. This article is an open access article distributed under the terms and conditions of the Creative Commons Attribution (CC BY) license (https://creativecommons.org/licenses/by/4.0/).