Abstract
Energy is the key driver of economic growth; however, the economic leadership position of G7 countries and the rising global manufacturing hub status of the ASEAN-5 countries have yet to achieve the Sustainable Development Goals. Thus, this paper aims to examine the effects of real GDP per capita, urban population, the number of individuals using the internet, carbon dioxide emissions, total trade and net foreign direct investment (FDI) inflows on the renewable energy consumption (REC) of G7 and ASEAN-5 countries from 1990 to 2021 yearly data. Using Studenmund’s and Gujarati and Porter’s procedures of the panel data model, the panel fixed-effect econometric modelling held the best outcome for both G7’s and ASEAN-5 countries’ REC models. Based on the findings, urban population highly and positively affects REC in G7 countries. However, there is also a positive and strong relationship between net FDI inflows and REC in ASEAN-5 countries. The empirical findings prove the importance of macroeconomic, socioeconomic and environmental variables for the outcomes of REC policies across both developed and developing countries.
1. Introduction
Renewable energy (RE) is defined as energy derived from sources that replenish naturally but are limited in flow [1], such as geothermal, solar, hydroelectric, wind and biomass fuels (i.e., biomass waste, biofuels and wood). RE has received increasing attention globally due to its important role in reducing greenhouse gas emissions, energy imports and fossil fuel use, which are crucial to delay climate change. As the key driver of development, the sustainable use of energy is important to ensure that the investments, innovations and growth of economies allow the current and future generations to continue flourishing without affecting growth momentums in accordance with Sustainable Development Goal (SDG) 7: “Ensure Access to Affordable, Reliable, Sustainable and Modern Energy for All”.
In the literature, substantial studies have been performed to identify the factors influencing the sustainable development of renewable energy consumption (REC), which can be broadly categorized into macroeconomic, socioeconomic and environmental. Since there are diverse variables in each category and different methods to estimate each variable, this produces a significant research gap, which should be addressed by narrowing the geographical scope of the research, expanding the variables used and include forecasting methods to forecast the REC rate of our target countries. This research examines the effects of real GDP per capita, urban population, the number of individual using the internet, carbon dioxide emissions, total trade and net foreign direct investment (FDI) inflows on the renewable energy consumption (REC) of G7 and ASEAN-5 countries using the panel data model.
The G7 is an informal block of the seven of the world’s industrialized countries that convenes annually to discuss global issues, such as economic governance, international security and energy (Council on Foreign Relations, 2022). These countries are the United States, Canada, France, Germany, Italy, Japan and the United Kingdom, whose collective gross domestic product (GDP) contributes to about 45% of the global economy as of 2019. In contrast, ASEAN-5 is a formally instituted economic block of the top five strongest-performing ASEAN countries, which are Indonesia, Malaysia, the Philippines, Singapore and Thailand, and was established on 8 August 1967 as the Association of Southeast Asian Nations (ASEAN) [2].
In comparison with the ASEAN-5 countries, the development of RE in the G7 countries is significantly more sophisticated and began earlier, starting from hydroelectricity and biomass fuels. As technology progressed, G7′s RE expanded into solar, wind and geothermal energies, although nuclear energy remained a mainstay in Japan. As for ASEAN-5, RE technology is significantly less-developed, and only Thailand, Indonesia and the Philippines can actively expand their hydro, solar, tidal and geothermal powers due to their geographical advantages [3,4,5]. In contrast, RE development and usage in Malaysia and Singapore is significantly lesser due to limitations in land mass and terrain construction. For example, Malaysia was heavily reliant on petroleum products until the 1980s, then natural gas usage picked up to replace petroleum products until the 2000s, which was then overtaken by coal and coke from 2000 onwards. Meanwhile, for Singapore, REC is nearly negligible—even at present, the island nation is 95% powered by natural gas despite efforts to transition to solar energy [6].
Figure 1 compares the REC of G7 and ASEAN-5 countries as a percentage share of total final energy consumption from 2016 to 2021. The REC of all G7 countries remained fairly constant in the previous 5 years due to disruptions caused by the COVID-19 virus where countries were unable to expend surplus capital to improve their technology or expand their capacity. Most notably, REC became stagnant from 2018 onwards due to COVID-19, which led to energy supply and demand disruption. Overall, among G7 countries, Canada remained consistently at the top at an average of 22.31%, while Japan remained consistently at the bottom at an average of 7.15%. In contrast, among ASEAN-5 countries, Indonesia started at 27.8348 units but was overtaken by Thailand and the Philippines in 2018 and maintained at an average of 20.86 units afterwards. During the period from 2018 to 2021, Thailand achieved an average of 23.72 units, while the Philippines had 23.22 units. Malaysia and Singapore remained at the bottom consistently at an average of 5.15 units and 0.71 units, respectively.
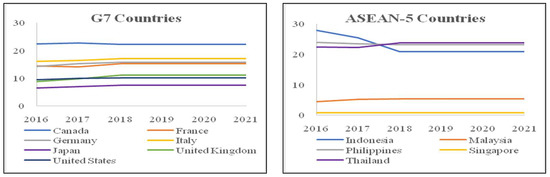
Figure 1.
Renewable energy consumption of G7 and ASEAN-5 countries, 2016–2021. Source: [7].
Figure 2 compares the real GDP per capita (RGDP) (in constant USD2015 terms) of G7 and ASEAN-5 countries from 2016 to 2021. In this instance, the United States charted the highest RGDP at USD 58,811.97 in the G7 bloc on average. Meanwhile, Singapore marked an even higher RGDP across both blocs at USD 59,062.18 on average. This is due to its relatively matured economy that thrives on exports of electrical and electronics (E&E), financial services, tourism and seaport business, and its extremely small population. The rest of the G7 countries marked an average performance RGDP at an average of USD 45,641.83 by the United Kingdom, USD 43,734.42 by Canada, USD 42,209.09 by Germany, USD 37,237.84 by France, USD 35,559.48 by Japan, and USD 30,722.37 by Italy. This is followed by the rest of the ASEAN-5 economies, which marked the lowest RGDP across both blocs. Malaysia had an average RGDP of USD 10,786.49, Thailand USD 6294.97, and Indonesia USD 3695.12, while the Philippines had an average of USD 3368.50. Of all countries, the Philippines had the lowest RGDP.

Figure 2.
Real GDP per capita (‘000) (constant USD 2015) of G7 and ASEAN-5 countries, 2016–2021. Source: [7].
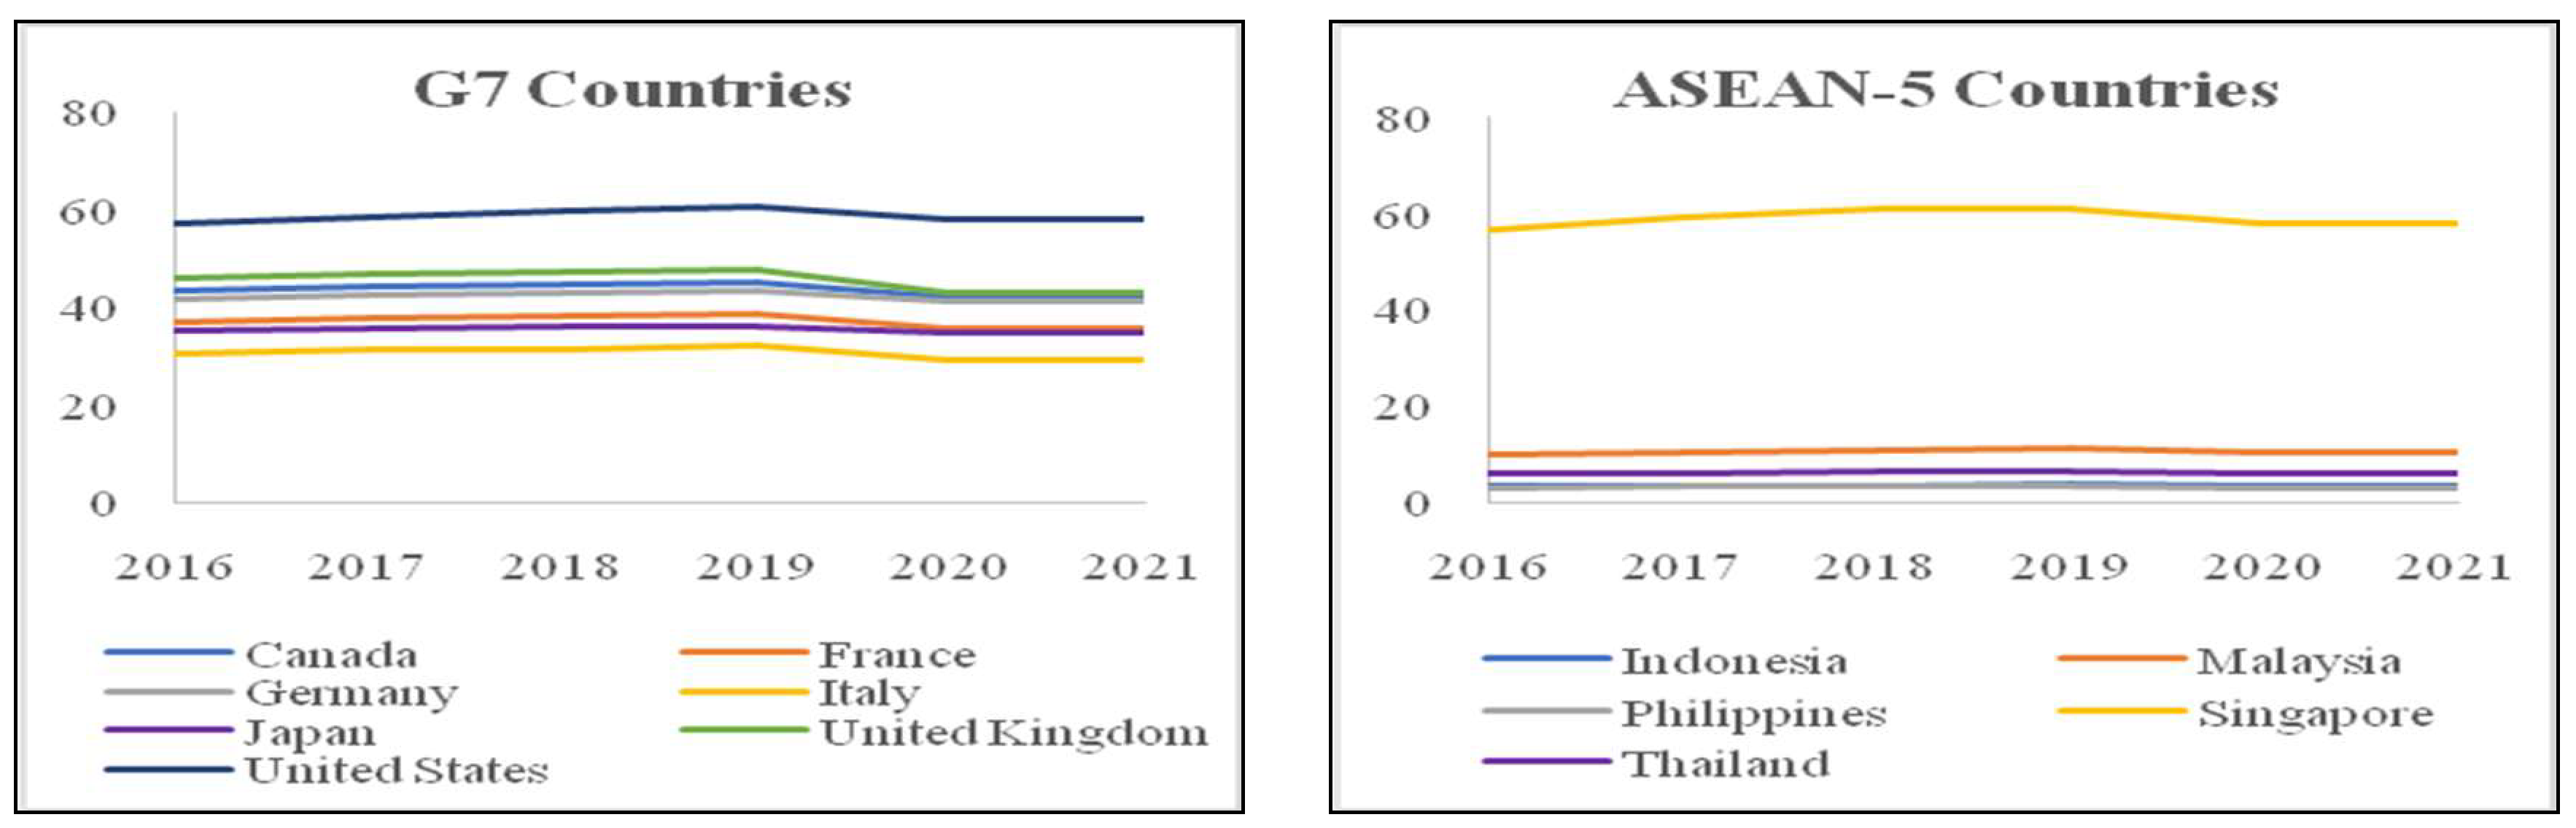
The urban population based on the percentage of the total population of G7 and ASEAN-5 countries data were from 2016 to 2021. In this case, Singapore had the highest urbanization compared to both economic blocs at 100.00% on average. The second highest urbanization was marked by Japan at 91.65% on average, which is another high-population-density country characterized by its highly developed public transport system. Italy is the least urbanized country among G7 countries at an average of 70.54% due to its peninsula-shaped terrestrial form, which is more accommodated to fit rural towns. This caused its urbanization to fall slightly lower than Malaysia from the ASEAN-5 block, which had 76.21% on average. Meanwhile, Indonesia, Thailand, and the Philippines were the least urbanized across both economic regions at 55.54%, 50.19%, and 47.00% on average, respectively.
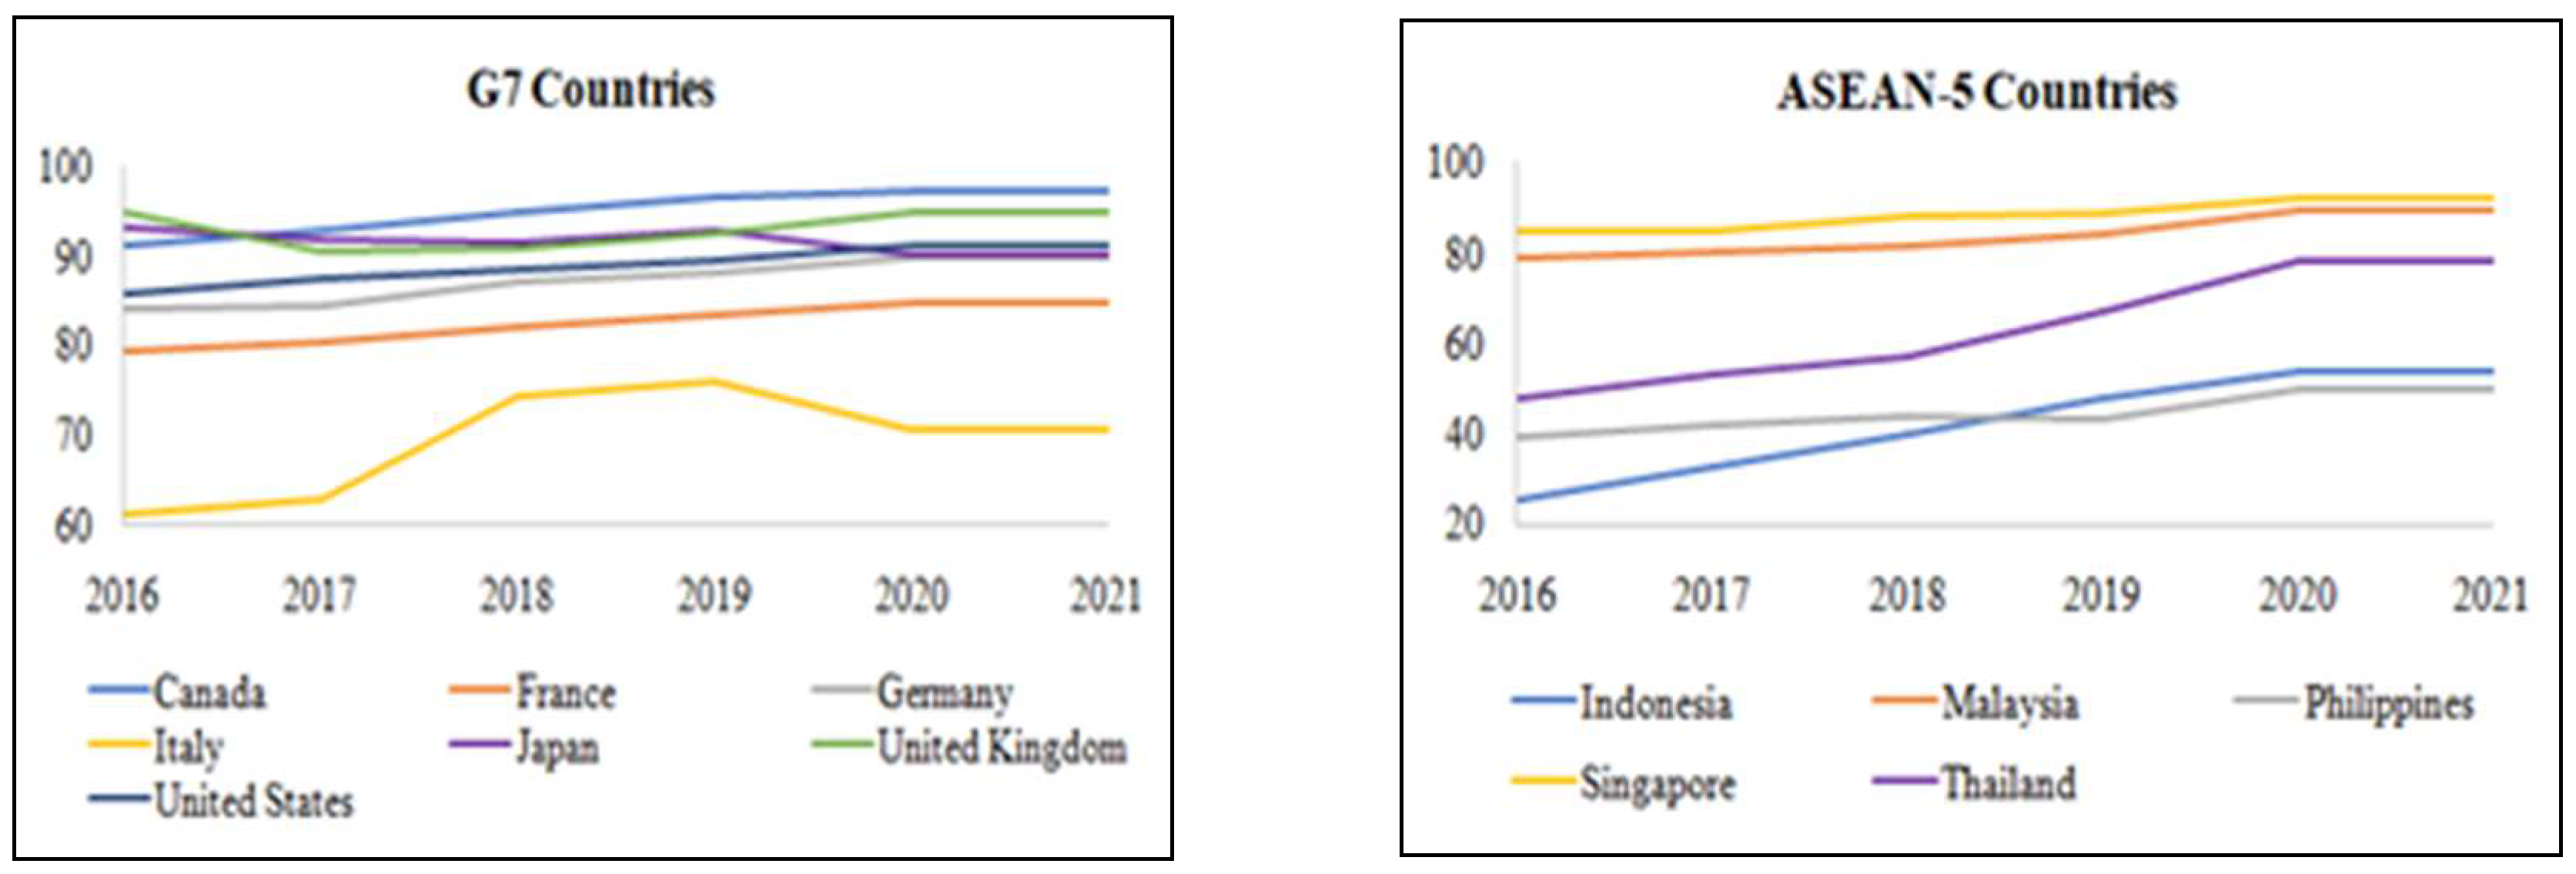
Figure 3 compares the individuals using the internet based on the percentage of the total population of G7 and ASEAN-5 countries from 2016 to 2021. Both economic blocks exhibited a rising pattern across the five years at different rates. In the G7 economic block, Canada achieved an average of 94.82% from 2016 to 2021, where it increased 5.81% over the years; the United Kingdom had an average of 93.01% and it increased only 0.04% across the 5 years; Japan marked an average of 91.56% but the percentage fell 2.96% within the 5 years; the United States marked an average of 88.76% with an increase of 5.36% over the 5 years; Germany marked an average of 87.23% with an increment of 5.65%; France achieved an average of 82.46% with an increment of 5.53%; and Italy marked an average of 69.31% but experienced an increase of 9.16%, the highest in the G7 economic block.
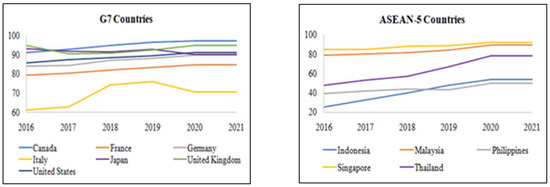
Figure 3.
The individual using the internet based on % of total population of G7 and ASEAN-5 countries, 2016–2021. Source: [7].
Meanwhile, in the rest of the ASEAN-5 block, Singapore had the highest internet usage at 88.34% of the total population on average from 2016 to 2021, where the rate rose 7.55% across the five years. This is followed by Malaysia at an average of 83.90% but experienced an increase of 10.77% across the five years; it is then followed by Thailand at an average of 63.26% but increased 30.34%, which was the highest in ASEAN-5. This is then followed by the Philippines at 44.59% on average, which experienced a modest 10.60% rise across the five years; lastly, Indonesia marked 42.14% due to its extremely large population with a rise of 28.28% over the five years.
We also mentioned the carbon dioxide emissions in million tons of G7 and ASEAN-5 countries from 2016 to 2021. Although the carbon dioxide emissions of both economic blocks are much different (G7 countries produce much more carbon dioxide than ASEAN-5 countries), there is a common trend, and the United States and Indonesia are the top carbon producers of their respective blocks due to their manufacturing-intensive economic activities at an average of 4862.31 million tons and 564.82 million tons, respectively. In addition to these two countries, the rest of the countries charted fairly low carbon emissions, which are indicative of their reliance on manufacturing activities and competence in mitigating carbon emissions. In the rest of the G7 block, Japan emitted 1116.91 million tons on average; Germany 692.87 million tons; Canada 551.45 million tons; the United Kingdom 372.85 million tons; Italy 317.85 million tons; and France 289.75 million tons. Meanwhile, for the remaining ASEAN-5 economies, Malaysia emitted 255.97 million tons of carbon dioxide on average over the 5 years; followed by Thailand at 290.29 million tons; Singapore at 218.45 million tons; and lastly the Philippines at 129.28 million tons.
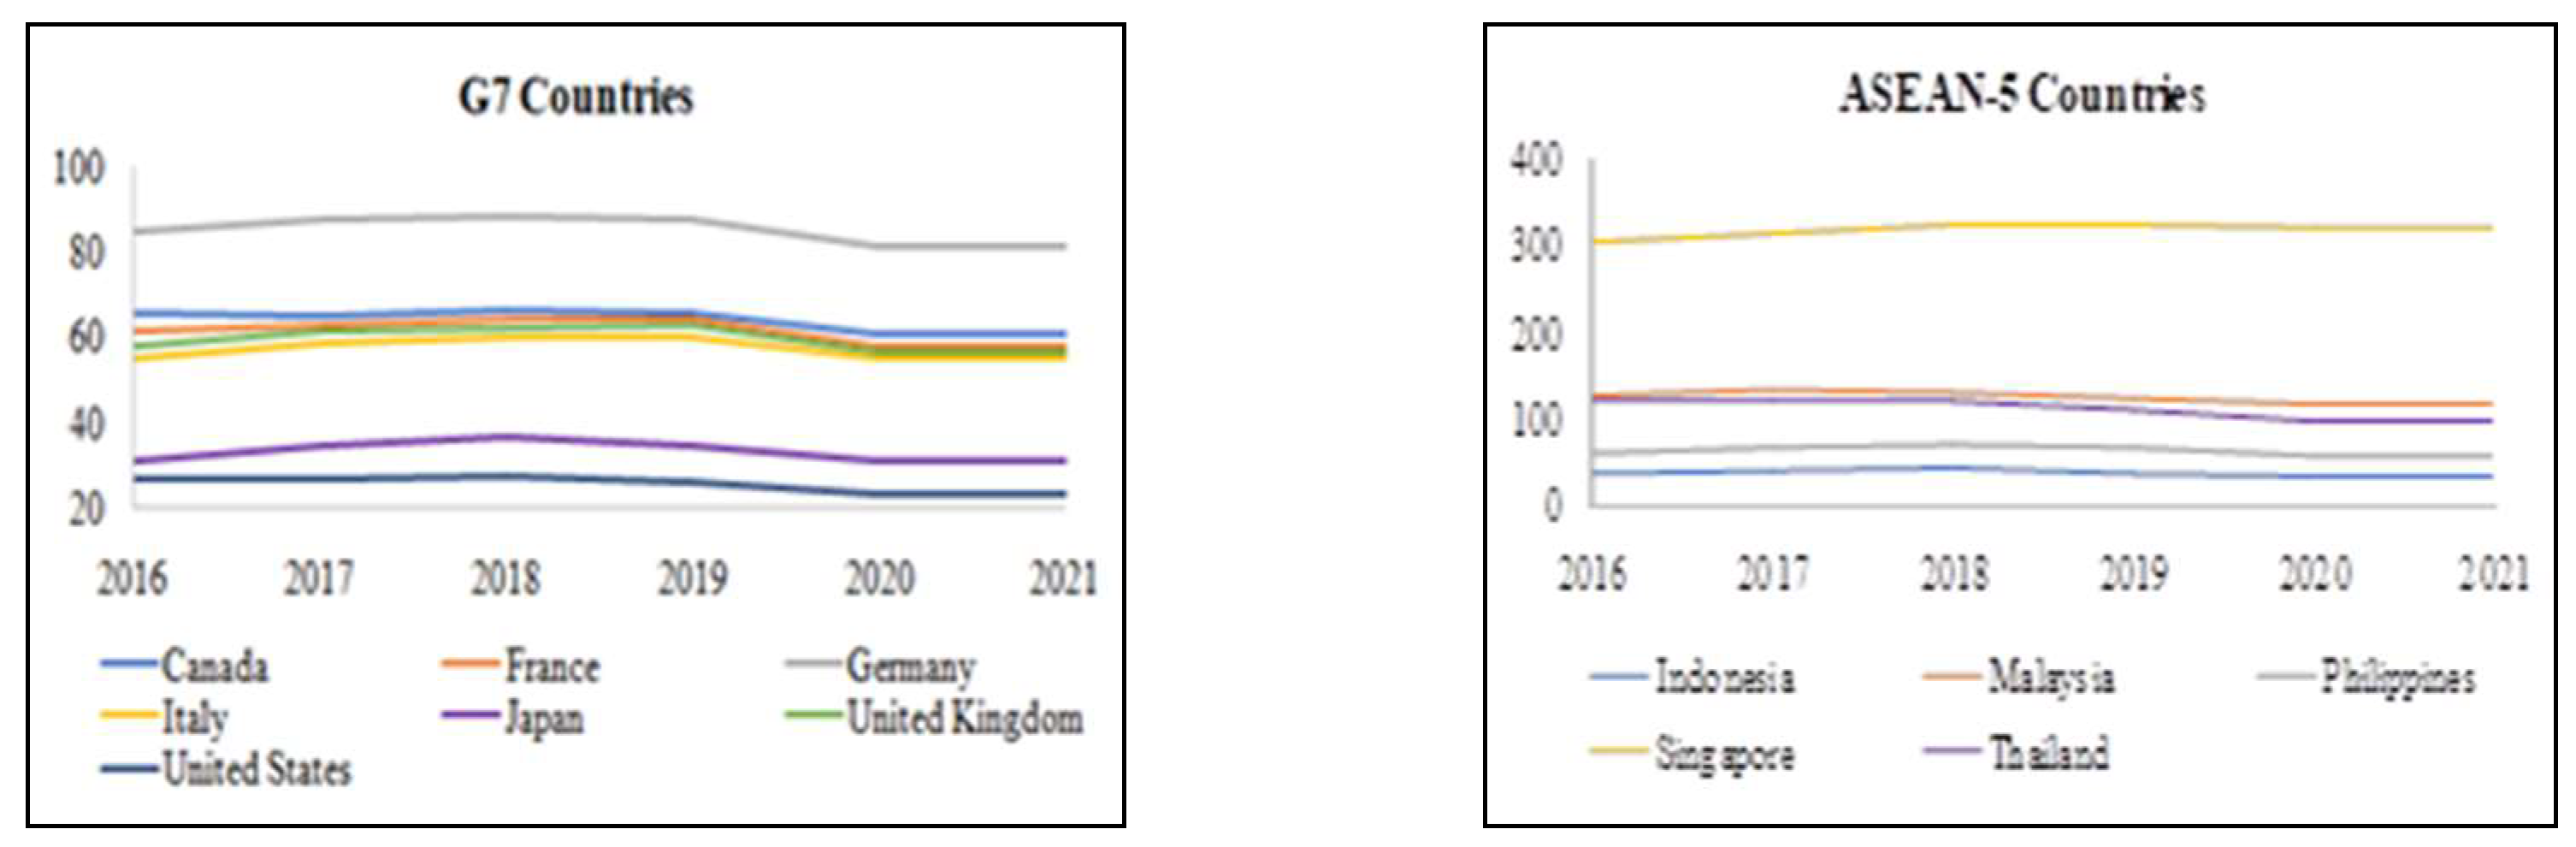
Figure 4 compares the total trade as a percentage of the GDP of G7 and ASEAN-5 countries from 2016 to 2021. Germany marked the highest performance in the G7 countries block at 85.04% on average but is outcompeted by Singapore at a whopping 300% and above. Meanwhile, the United States and Indonesia marked the lowest performance for the G7 and ASEAN-5 economies at 25.70% and 37.28%, respectively, meaning that their economy is very diverse, even though manufacturing is an integral component of their economic activities, such as the services and agriculture sector. For the other countries, performance averaged 63.98% for Canada, 61.36% for France, 59.48% for the United Kingdom, 57.40% for Italy, and 33.21% for Japan on average for the rest of the G7 countries; it was 124.38% for Malaysia, 111.33% for Thailand, and 64.55% for the Philippines on average for the rest of the ASEAN-5 countries.
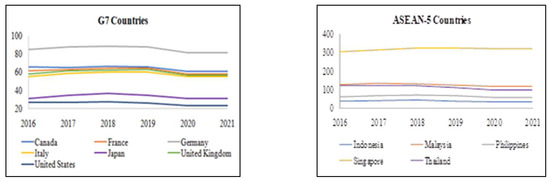
Figure 4.
Total trade (% of GDP) of G7 and ASEAN-5 countries, 2016–2021. Source: [7].
Lastly, compared to the net inflow of FDI as a percentage of the GDP of G7 and ASEAN-5 countries are from 2016 to 2021. In this case, Singapore marked the highest new FDI inflows to GDP at 26.06% on average, meaning it is the most attractive foreign investment destination to its economic size. On the other hand, the FDI net inflow performance of the United Kingdom was bad and fell 10.80% across the five-year period and eventually averaged 3.01%. In general, the ASEAN-5 economies’ performance was very low, similar to that of the G7 economies. For the rest of the G7 economies, Germany marked 2.74%, Canada marked 2.04%, the United States marked 1.49%, France marked 1.43%, Japan marked 0.83%, and Italy marked 0.54% on average; for the rest of the ASEAN-5 economies, Malaysia marked 2.46%, Philippines marked 2.42%, Indonesia marked 1.69%, and Thailand marked 0.70% on average. This can also be interpreted differently as ASEAN-5 economies had very regular FDI attraction performance similar to that of G7 economies, while Singapore had an excessively stellar performance in attracting FDI.
2. Methods
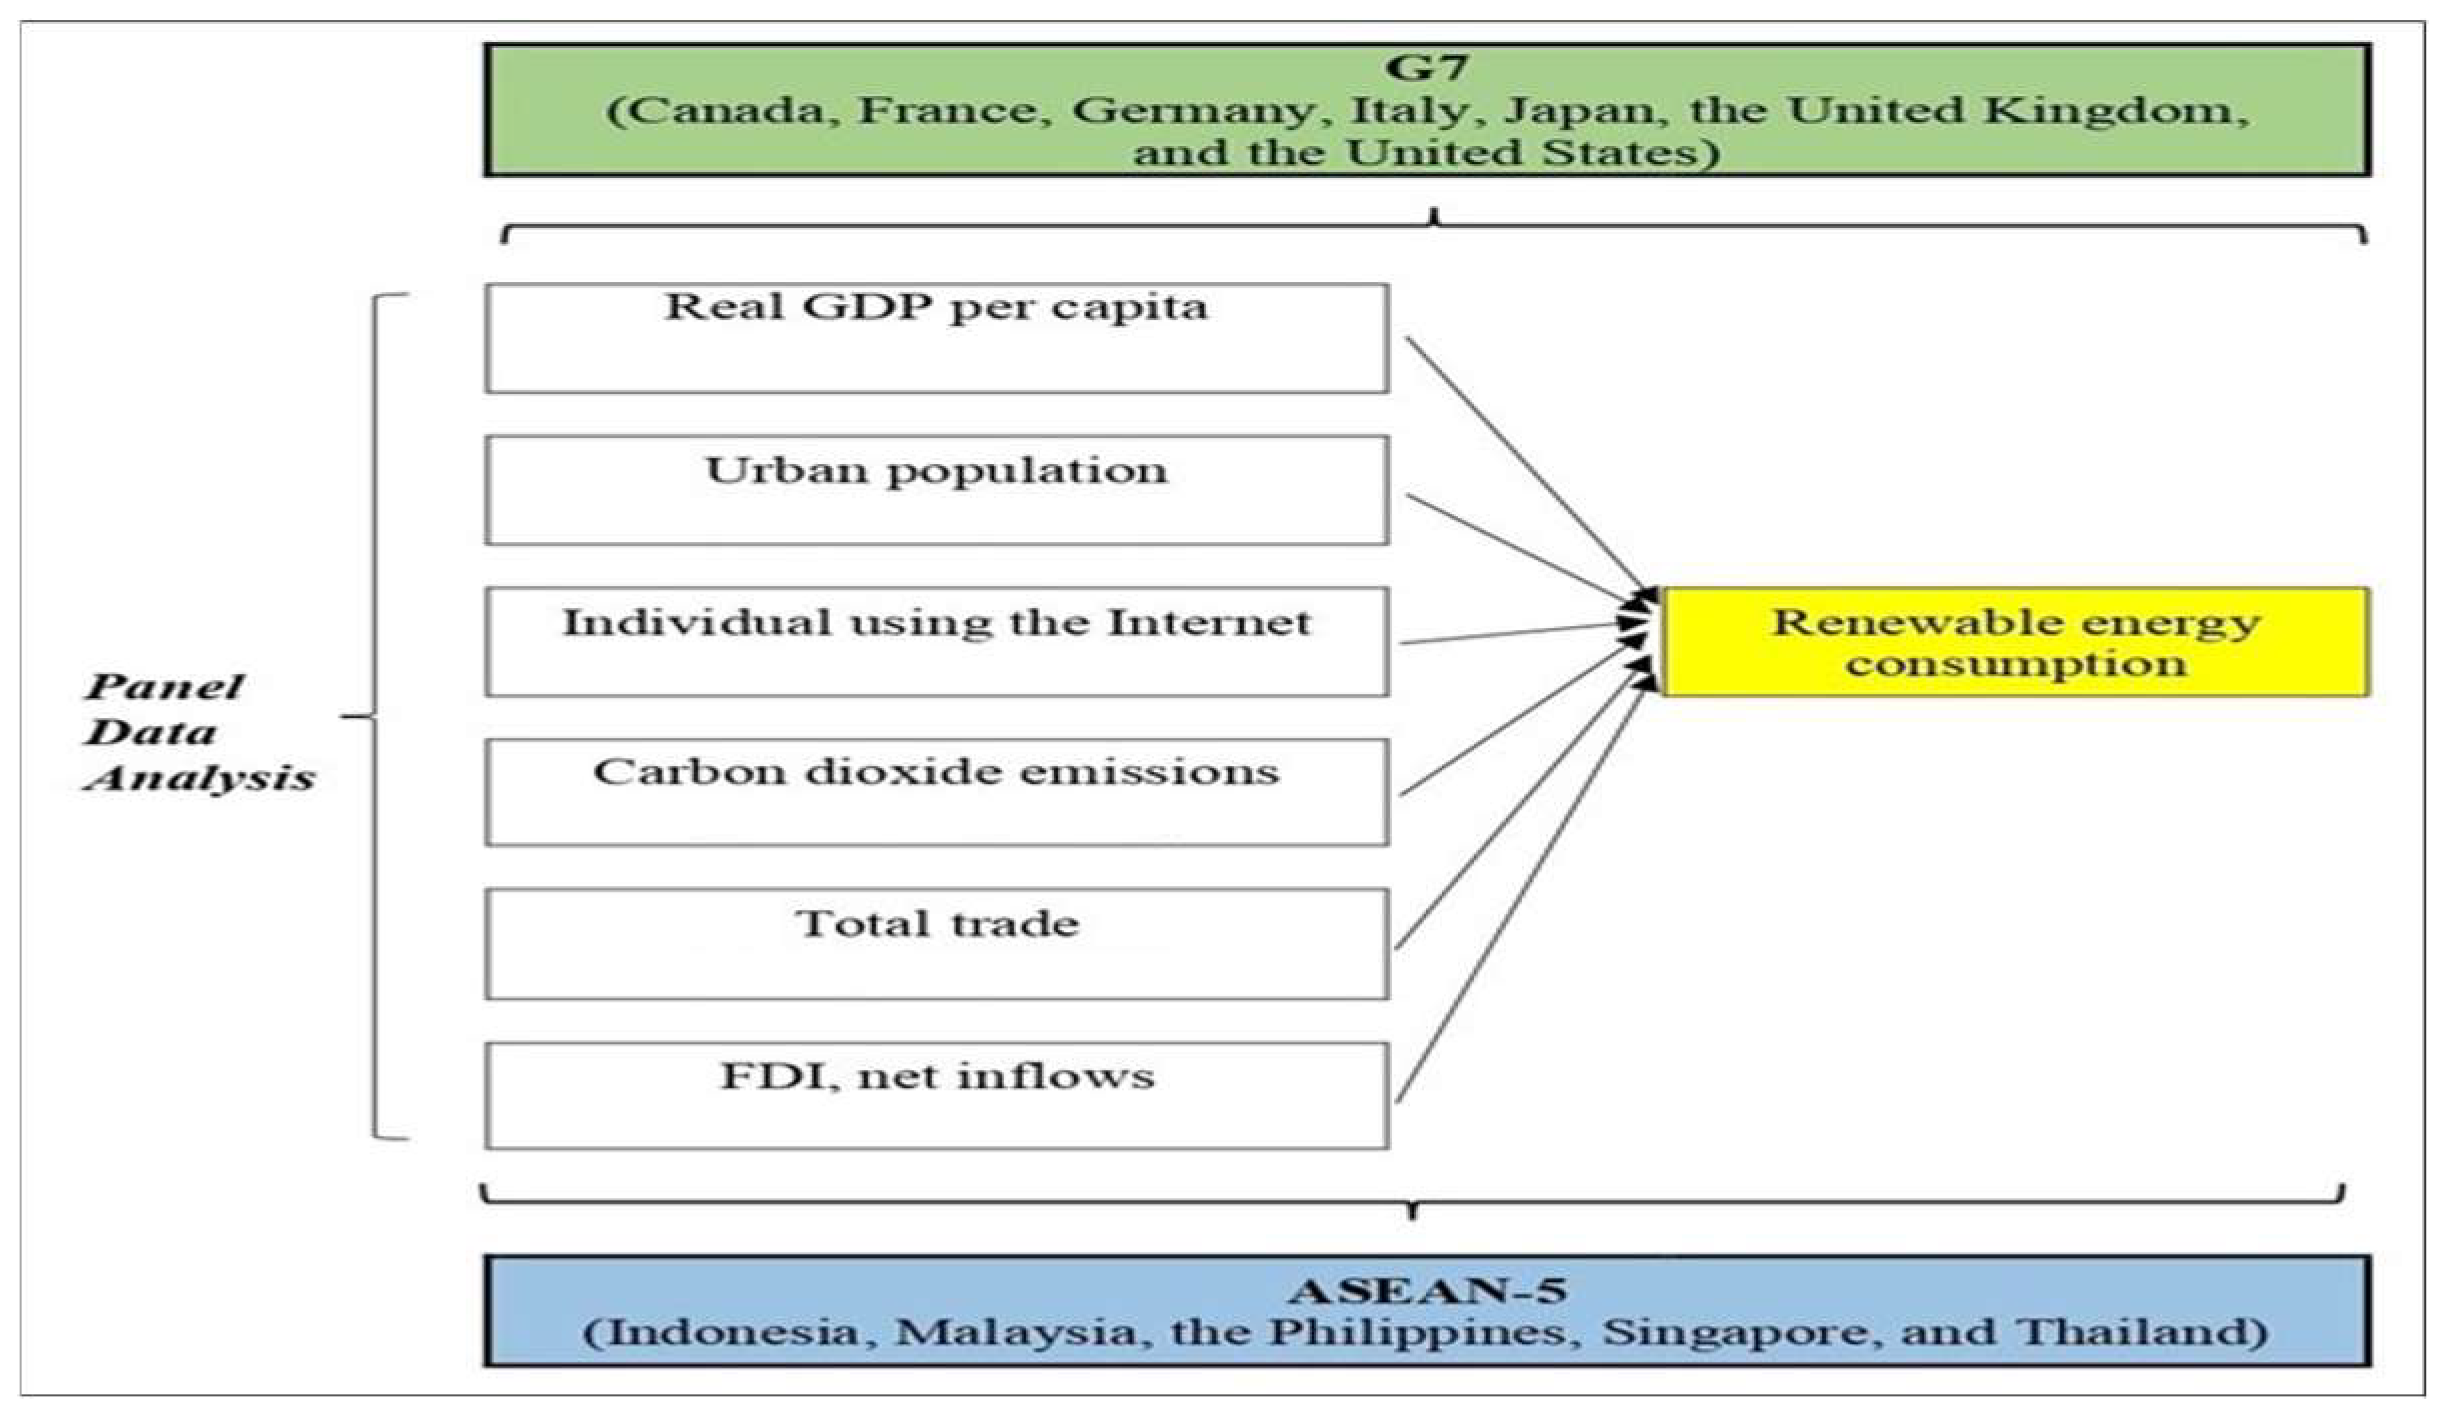
For the panel model analysis of renewable energy consumption (REC) in G7 and ASEAN-5 countries, this study considered macroeconomic variables, including economic growth (real GDP per capita), urbanization (urban population), trade openness (total trade), and foreign direct investment (FDI) levels (FDI, net inflows); a socioeconomic variable, which is access to the internet (individual using the internet); and an environmental variable, which is environmental degradation (carbon dioxide emissions). Annual data from 1990 to 2021 were collected from World Bank and British Petroleum (BP) Statistical Review of Energy. There are two models for analysis, one for the G7 countries while the other for ASEAN-5 countries. Figure 5 presents the proposed conceptual framework of this research.

Figure 5.
Proposed conceptual framework of renewable energy consumption in G7 and ASEAN-5 countries.
2.1. Research Procedure
2.1.1. Panel Data Analysis
The panel data analysis was selected for this study. It is known as a longitudinal study, i.e., a combination of cross-sectional (N) data and time-series (T) data over two or more different time periods [8,9]. In most econometric research, panel data analysis is preferable due to its ability to (1) avoid omitted variable problems, which would otherwise induce biases; (2) allow greater flexibility to study more complicated behavioral models due to its multidimensional data sample; (3) resolve heterogeneity, variability, collinearity, and degree of freedom issues; (4) and account for more dynamics of change [9].
2.1.2. Panel Unit Root Test
The unit root is acknowledged as a stochastic trend in a time series, which results in an unpredictable systematic pattern [9]. The existence of unit root in a series will cause issues in an analysis, such as spurious regressions where the R-squared value is too high even though there is no correlation between the data or erratic behavior in the model, which invalidates the ultimate results. Therefore, if the unit root exists in the series and is tested out, a series of successive differences will be made to transform the non-stationary series into a set of stationary series. There is a systematic method to depict this phenomenon. If the data are stationary at level, they are denoted as I(0); if the data are stationary at the first difference, they are denoted as I(1); and if the data are stationary at the second difference, they are denoted as I(2). The hypotheses H01 and HA1 of the unit root tests are as follows:
H01:
Each time series contains a unit root (sig-p-value > α 0.05).
HA1:
Each time series is stationary (sig-p-value ≤ α 0.05).
The [10] test was employed for the panel model unit root tests for G7 and ASEAN-5 countries. For G7 countries, the results indicate that, at level, all variables are stationary except for REC and carbon dioxide emissions. After first differencing, all variables are stationary except for the urban population and percentage of individuals using the internet. At the second differencing, all variables are stationary except for the urbanization rate. Because the data are stationary at non-uniform difference levels, we conducted a cointegration test afterwards on the data sample. Meanwhile, for ASEAN-5 countries, a similar pattern emerged. At level, all variables are stationary except for real GDP per capita, the percentage of individuals using the internet, and total trade. After the first differencing, all variables are stationary except for the urban population. At second differencing, all variables are stationary except for urban population. Because the data are stationary at non-uniform difference levels, we also conducted a cointegration test afterwards on the data sample. The results are concluded in Table 1.

Table 1.
Panel model unit root test of the renewable energy consumption of G7 and ASEAN-5 countries.
2.1.3. Panel Cointegration Test
Non-stationarity is not necessarily a bad thing. Sometimes when two or more time series exhibit the same stochastic trend, this special case is known as cointegration [11]. Such situations can then be modelled using the vector error correction model, which can help to forecast future values. This can be achieved through the Pedroni test, Kao test, or Engle–Granger-Augmented Dickey–Fuller test. The hypotheses H02 and HA2 of the cointegration test are as follows:
H02:
The time series do not have cointegration (α > 0.01).
HA2:
The time series have cointegration (α ≤ 0.01).
From the results in Table 2 and Table 3, it is identified that all 6 cointegration tests of G7 and ASEAN-5 countries are significant at the 0.01 and 0.05 levels. Therefore, the results of the trace test and the maximum eigenvalue test indicate that 6 cointegrating equations were significant at the 0.01 and 0.05 levels, which meant that the long-term equilibrium between the variables was met.
Table 2.
Johansen–Fisher panel cointegration test for the REC model of G7 countries.
Table 3.
Johansen–Fisher panel cointegration test for the REC model of ASEAN-5 countries.
2.1.4. Panel Model Selection
There are three generic models, which are: (1) Fixed-Effects Model (FEM), (2) Random Effects Model (REM), and (3) Pooled Ordinary Least Squares Model (POLS) [8]. The REM has the advantage of avoiding bias due to omitted variables that remain constant over time and the FEM has the advantage of estimating time-invariant explanatory variables and allowing for higher degrees of freedom, whereas the POLS is the most basic OLS technique run on data that ignores all individually specific effects. To decide whether we should pursue REM, FEM or POLS, we referred to the following tests:
- Firstly, the Redundant Fixed-Effects Test was conducted. The hypotheses H03 and HA3 of this test are as follows:
H03:
POLS is preferred.
HA3:
FEM is preferred.
If the significant p-value is lower than the α-value of 0.05, H0 is rejected, and the fixed-effects model is preferred. If the significant p-value is higher than the α-value of 0.05, H0 is accepted and the POLS effects model is preferred.
- 2.
- Next, the Lagrange Multiplier Test for Random Effects was conducted. The hypotheses H04 and HA4 of this test are as follows:
H04:
POLS is preferred.
HA4:
REM is preferred.
If the significant p-value is lower than the α-value of 0.05, H0 is rejected, and the random effects model is preferred. If the significant p-value is higher than the α-value of 0.05, H0 is accepted and the POLS effects model is preferred.
- 3.
- Finally, the Correlated Random Effects—Hausman Test was conducted. The hypotheses H05 and HA5 of this test are as follows:
H05:
REM is preferred.
HA5:
FEM is preferred.
If the significant p-value is lower than the α-value of 0.05, H0 is rejected, and the fixed effects model is preferred. If the significant p-value is higher than the α-value of 0.05, H0 is accepted and the random effects model is preferred.
Table 4 shows the tests for G7 panel model selection, where the fixed-effects model was identified to be the most appropriate model. Meanwhile, Table 5 shows the test for ASEAN-5 panel model selection, where the panel fixed-effects model (FEM) was also identified to be the most appropriate model.
Table 4.
Panel model selection for the REC model of G7 countries.
Table 5.
Panel model selection for the REC model of ASEAN-5 countries.
3. Results
3.1. FEM of G7 Renewable Energy Consumption
Based on Table 4, the fixed-effect panel model equation for the REC of G7 countries after obtaining the output from EViews is shown in Model (1) below:
Note: * = at α 0.10 statistically significant level; ** = α 0.05 statistically significant level; *** = at α 0.01 statistically significant level.
RECG-7it = 40.3673 + 0.1501 RGDPit + 0.3773 URBANit + 0.07251 INTit + 0.0066 CO2it + 0.1728 TRADEit + 0.2580 FDIit
t = [1.8391 *] [4.4620 ***] [6.0445 ***] [7.6954 ***] [8.0767 ***] [3.3834 ***]
Based on Model (1), the explanatory variables accounted for 92.24% of the variation in the REC of G7 countries. The results show that all the explanatory variables (namely, macroeconomic variables, economic growth (real GDP per capita), urbanization (urban population), trade openness (total trade), and foreign direct investment (FDI) levels (FDI, net inflows); the socioeconomic variable, which is the access to the internet (individuals using the internet); and the environmental variable, which is environmental degradation (carbon dioxide emissions)) are significant for the REC of G7 countries. Moreover, for the heteroskedasticity test, White test F = 1.211262, prob-value = 0.3334 and the outcome of the White test of the auxiliary regression’s R2 value is 0.225228. Therefore, VIF value is 1.2907, which is less than 5. Therefore, Model (1) residuals present no multicollinearity problem. Additionally, the residuals for the normality distribution test’s prob-value = 0.0741, which is more than the α 0.05 level. Thus, the residuals are also normally distributed.
A 1 unit increase in RGDP has a positive effect on the change in REC by 0.1501 units with statistical significance at the 0.10 level holding other variables constant. Next, a 1 unit increase in URBAN has a positive effect on the change in REC by 0.3773 units with statistical significance at the 0.01 level holding other variables constant. Meanwhile, a 1 unit increase in INT has a positive effect on the change in REC by 0.0725 units with statistical significance at the 0.01 level holding other variables constant. Then, a 1 unit increase in CO2 has a positive effect on the change in REC by 0.0066 units with statistical significance at the 0.01 level holding other variables constant. Moreover, a 1 unit increase in TRADE has a positive effect on the change in REC by 0.1728 units with statistical significance at the 0.01 level holding other variables constant. Finally, a 1 unit increase in FDI has a positive effect on the change in REC by 0.2580 units with statistical significance at the 0.01 level holding other variables constant.
3.2. FEM of G7 Renewable Energy Consumption
Based on Table 5, the fixed-effects panel model equation for REC of ASEAN-5 countries after obtaining the output from EViews is shown in Model (2) below:
Note: *** = at α 0.01 statistically significant level.
RECASEAN-5it = 54.7654 + 0.1121 RGDPit + 0.2192 URBANit + 0.2530 INTit + 0.0033 CO2it + 0.1523 TRADEit + 0.6714 FDIit
t = [7.9122 ***] [3.2934 ***] [8.8423 ***] [0.6126] [9.8540 ***] [2.9144 ***]
Based on Model (2), the explanatory variables accounted for 81.17% of the variation in the REC of ASEAN-5 countries. The results show that the macroeconomic variables (economic growth (real GDP per capita), urbanization (urban population), trade openness (total trade), and foreign direct investment (FDI) levels (FDI, net inflows)) and the socioeconomic variable (which is access to the internet (individual using the Internet)) are significant factors. However, the environmental variable, which is environmental degradation (carbon dioxide emission), is not significant for the REC of ASEAN-5 countries. Furthermore, for the heteroskedasticity test, White test F = 2.150000, prob-value = 0.0828 and the outcome of the White test of the auxiliary regression’s R2 value is 0.340369, Therefore, VIF value is 1.5159, which is less than 5. Therefore, Model (2) residuals present no multicollinearity problem. Additionally, the residuals for the normality distribution test’s prob-value = 0.8490, which is more than α 0.05 level. Thus, the residuals are also normally distributed.
A 1 unit increase in RGDP has a positive effect on the change in renewable energy consumption (REC) by 0.1121 units with statistical significance at the 0.01 level holding other variables constant. Next, a 1 unit increase in URBAN has a positive effect on the change in REC by 0.2192 units with statistical significance at the 0.01 level holding other variables constant. Then, a 1 unit increase in INT has a positive effect on the change in REC by 0.2530 units with statistical significance at the 0.01 level holding other variables constant. Moreover, a 1 unit increase in TRADE has a negative effect on the change in REC by 0.1523 units with statistical significance at the 0.01 level holding other variables constant. Lastly, a 1 unit increase in FDI has a positive effect on the change in REC by 0.6714 units with statistical significance at the 0.01 level holding other variables constant.
Energy is the key driver of economic growth. Thus, for the case of G7 countries, for the economic leaders of G7 countries to achieve the sustainable development goals, the urban population (URBAN) and the net FDI inflows (FDI) should be considered, as they have a more positive effect on the change in REC [12,13]. However, for the case of ASEAN-5 countries, for the economic leaders of ASEAN-5 countries to achieve the sustainable development goals, they should focus on the effects of the individuals using the internet (INT) and the net FDI inflows (FDI) on the REC [14,15].
4. Discussion
The empirical findings show the importance of macroeconomic, socioeconomic, and environmental variables to achieve REC in G7. For the case of ASEANN-5, it is macroeconomic and socioeconomic variables that affect REC. However, the environmental variable is not significant. This can be explained by the study in [16]. They found that carbon emissions per capita do not influence investments in renewable energy. This is because they are satisfied with the number of renewable energy initiatives in place to counter the perceived level of environmental degradation.
4.1. Factors Affecting REC in G7
For macroeconomic factors in the case of G7 countries, similar results have been found in previous studies [12,17,18]. Real GDP per capita affects India, and there is a long-term relationship between economic growth and renewable energy consumption [18]. While for the urban population, in the study of [12], the results show that urbanization is an important factor that affects REC. This can be explained by the increased intensity of energy demand in highly urbanized areas, which translates to an increased demand for alternative sources of energy. Based on the study of [17], the results show that trade openness exhibits a significant effect on hydropower energy, wind energy production, and solar and geothermal energy sources, which are renewable alternatives of energy supplied by the government based on domestic demand. While for FDI net inflows, the results of [13] show an effect between FDI and REC, i.e., a long-run U-shaped relationship is present for renewable sources and FDI.
For the socioeconomic variable, i.e., individuals using the internet, the results of [12] show internet usage is a significant factor affecting REC. This is because internet access enables a more efficient dissemination of information on environmental issues that help to increase consumer awareness towards environmental issues. While for the environmental variable, i.e., carbon dioxide emissions, the results are consistent with those of a previous study [19], which shows that energy utilization has a significant impact on carbon dioxide emissions.
4.2. Factors Affecting REC in ASEAN-5
For macroeconomic factors in the case of ASEAN-5 countries, similar results have been found in previous studies [15,20,21,22]. For the macroeconomic factors, the results of [22] show that economic growth (real GDP per capita) has a significant impact on renewable energy. This is especially during periods of high economic growth, and there is unidirectional causality from economic growth to renewable energy. Moreover, for urban population, the results of [21] show urbanization increases renewable energy significantly and there is bidirectional relationship between urbanization and renewable energy consumption. While for total trade, the results of [20] show a negative cointegration direction between trade openness and renewable energy, i.e., an increase in trade openness decreases renewable energy consumption. This is because, when countries’ trade openness increases, they require more energy, which increases energy costs. However, countries can import advanced technologies at the same time, which reduces energy intensity and offsets the energy costs simultaneously. For FDI net inflows, [15] shows a strong relationship between FDI and renewable energy in South Asian nations, and it is suggested that policymakers incorporate FDI into policies to promote environmental sustainability.
For the socioeconomic variable, i.e., individuals using the internet, the results of [14], which used the system-generalized method of moments (GMM) estimator on Chinese provincial panel data from 2007 to 2016, show the popularity of the internet does improve the public’s environmental protection awareness, which indicates a relationship between information and communication technology (ICT) and sustainable development.
5. Conclusions
In conclusion, this research study showed that REC is significantly affected by macroeconomic, socioeconomic, and environmental variables in G7 countries, while for the case of ASEANN-5, it is macroeconomic and socioeconomic variables that affect REC. This implies that policymakers should cater for the relevant indicators in policy formulation for the development of REC. Since ASEAN-5 countries are still in transition towards becoming developed countries, economic activities can become intensify in the mission to achieve sustained economic growth, which would subsequently lead to environmental degradation if REC is not improved. Thus, it is imperative for policymakers to incentivize business owners to transition towards greener alternatives to ensure that the future generations of the country are not left with a heavily polluted country.
Moreover, the significance of the socioeconomic variable is reflected in the importance of policymakers in G7 and ASEAN-5 countries utilizing internet platforms, such as social media, to raise environmental awareness effectively and efficiently. Since the youth is the most active user of social media and the future leaders of the nation, cultivating environmental awareness from a young age is important in ensuring the sustainable development of the country without compromising economic prosperity. Taking Singapore as an example, the Ministry of Sustainability and the Environment of Singapore runs social media accounts (i.e., Instagram and Facebook) and posts trendy pictures and videos that younger generations can relate to and “reshare” to their friends and families. Such initiatives are modern and up-to-date with the latest trends, which ensure that the youths are actively engaged with the work of policymakers.
The governments in G7 and ASEAN-5 countries need to set up special taskforces to track REC, which is crucial to identify the progress of the nation towards achieving the sustainable development goals. The governments can also invest in research and development projects (R&D) to improve public access to the required data, allowing researchers and even the general public to understand better the country’s sustainable development progress.
Author Contributions
Conceptualization, A.A.K.; methodology, S.H.; validation, A.A.K.; writing—original draft preparation, K.M.T.; writing—review and editing, W.Y.W.; funding acquisition, K.M.T. All authors have read and agreed to the published version of the manuscript.
Funding
This research received no external funding.
Institutional Review Board Statement
Informed consent was obtained from all subjects involved in the study. Written informed consent was obtained from the University of Tunku Abdul Rahman to publish this paper.
Informed Consent Statement
Not applicable.
Data Availability Statement
Not applicable.
Acknowledgments
The authors are mainly thankful to the Universiti Tunku Abdul Rahman (UTAR), which provided the opportunity to conduct this research.
Conflicts of Interest
The authors declare no conflict of interest.
References
- United States Energy Information Administration. What Is Renewable Energy? 2022. Available online: https://www.eia.gov/energyexplained/renewable-sources/ (accessed on 27 October 2022).
- ASEAN. The Founding of ASEAN. 2022. Available online: https://asean.org/the-founding-of-asean/ (accessed on 23 October 2022).
- Ministry of Investment Indonesia. Harnessing Renewable Energy Investment Sector in Indonesia. 2022. Available online: https://www5.bkpm.go.id/en/publication/detail/news/harnessing-renewable-energy-investment-sector-in-indonesia (accessed on 23 October 2022).
- World Wildlife Fund (WWF). Renewables Best Way to Power Philippine Development. 2017. Available online: https://wwf.org.ph/what-we-do/climate/renewables/renewables-to-power-ph-dev/ (accessed on 25 October 2022).
- International Trade Administration of United States. Thailand—Renewable Energy. 2022. Available online: https://www.trade.gov/energy-resource-guide-thailand-renewable-energy (accessed on 26 October 2022).
- Energy Market Authority Singapore. Overview. 2022. Available online: https://www.ema.gov.sg/ourenergystory (accessed on 25 October 2022).
- World Bank. Renewable Energy Consumption (% of Total Final Energy Consumption). 2022. Available online: https://data.worldbank.org/indicator/EG.FEC.RNEW.ZS (accessed on 27 October 2022).
- Studenmund, A.H. Using Econometrics: A Practical Guide, 7th ed.; Pearson: Harlow, UK, 2017. [Google Scholar]
- Gujarati, D.N.; Porter, D.C. Basic Econometrics, 5th ed.; McGraw-Hill: New York, NY, USA, 2009; ISBN 978-007-127625-2. [Google Scholar]
- Levin, A.; Lin, C.F.; Chu, C.S.J. Unit root tests in panel data: Asymptotic and finite-sample properties. J. Econom. 2002, 108, 1–24. [Google Scholar] [CrossRef]
- Stock, J.H.; Watson, M.W. Introduction to Econometrics, 3rd ed.; Pearson: Harlow, UK, 2015. [Google Scholar]
- Baye, R.S.; Olper, A.; Ahenkan, A.; Musah-Surugu, I.J.; Anuga, S.W.; Darkwah, S. Renewable energy consumption in Africa: Evidence from a bias corrected dynamic panel. Sci. Total Environ. 2021, 766, 142583. [Google Scholar] [CrossRef] [PubMed]
- Shahbaz, M.; Sinha, A.; Raghutla, C.; Vinh Vo, X. Decomposing scale and technique effects of financial development and foreign direct investment on renewable energy consumption. Energy 2022, 238, 121758. [Google Scholar] [CrossRef]
- Zhang, J.; Zhang, H.; Gong, X. Government’s environmental protection expenditure in China: The role of Internet penetration. Environ. Impact Assess. Rev. 2022, 93, 1318–1328. [Google Scholar] [CrossRef]
- Kang, X.; Ullah Khan, F.; Ullah, R.; Arif, M.; Ur Rehman, S.; Ullah, F. Does Foreign Direct Investment Influence Renewable Energy Consumption? Empirical Evidence from South Asian Countries. Energies 2021, 14, 3470. [Google Scholar] [CrossRef]
- Abban, A.R.; Hasan, M.Z. Revisiting the determinants of renewable energy investment—New evidence from political and government ideology. Energy Policy 2021, 151, 112184. [Google Scholar] [CrossRef]
- Khezri, M.; Heshmati, A.; Khodaei, M. The role of R&D in the effectiveness of renewable energy determinants: A spatial econometric analysis. Energy Econ. 2021, 99, 105287. [Google Scholar] [CrossRef]
- Das, N.; Bera, P.; Panda, D. Can economic development & environmental sustainability promote renewable energy consumption in India? Findings from novel dynamic ARDL simulations approach. Renew. Energy 2022, 189, 221–230. [Google Scholar] [CrossRef]
- Ulucak, R.; Erdogan, S. The effect of nuclear energy on the environment in the context of globalization: Consumption vs. production-based CO2 emissions. Nucl. Eng. Technol. 2022, 54, 1312–1320. [Google Scholar]
- Zeren, F.; Akkus, H.T. The relationship between renewable energy consumption and trade openness: New evidence from emerging economies. Renew. Energy 2020, 147, 322–329. [Google Scholar] [CrossRef]
- Hashemizadeh, A.; Bui, Q.; Kongbuamai, N. Unpacking the role of public debt in renewable energy consumption: New insights from the emerging countries. Energy 2021, 224, 120187. [Google Scholar] [CrossRef]
- Chen, Y.; Mamon, R.; Spagnolo, F.; Spagnolo, N. Renewable energy and economic growth: A Markov-switching approach. Energy 2022, 244, 123089. [Google Scholar] [CrossRef]

Disclaimer/Publisher’s Note: The statements, opinions and data contained in all publications are solely those of the individual author(s) and contributor(s) and not of MDPI and/or the editor(s). MDPI and/or the editor(s) disclaim responsibility for any injury to people or property resulting from any ideas, methods, instructions or products referred to in the content. |
© 2023 by the authors. Licensee MDPI, Basel, Switzerland. This article is an open access article distributed under the terms and conditions of the Creative Commons Attribution (CC BY) license (https://creativecommons.org/licenses/by/4.0/).