1. Introduction
Honeybee colonies are dependent on suitable temperatures for healthy colony development [
1,
2,
3,
4], including maintaining 32–35 °C to enable brood to develop [
2].
Many studies investigating temperature inside a beehive have done so using a single sensor which is placed in or around the hive [
1,
3,
5], for example, at the centre of the colony to monitor for brood-rearing temperatures [
1,
3]. Other investigations have placed the sensor above the hive to detect changes in temperature relevant to the colony [
3,
5].
Choosing a single location to place a temperature sensor is inexpensive and simple but has a major disadvantage in that the highly localized measurement will often be a poor indicator of the entire colony’s status [
6]. As such, placing a sensor at the centre of the hive may be the optimum position for measuring temperatures consistent with brood rearing; however, the colony does not necessarily fill all the available volume at its centre. Similarly, a sensor placed at the periphery of a hive will have measurements affected by external temperatures, which will usually be considerably different to those experienced by the colony centre.
A number of studies have investigated temperature variation across a honeybee colony [
2,
5,
6,
7,
8,
9], including over a short time period using thermal imaging to produce heat maps of the colony nest [
7] and at several locations to detect differences in temperature between the colony centre, the periphery, the edge of the hive, and the outside [
3].
Using an array of thermocouples laid onto a frame is a potential solution that was proposed fifty years ago [
8]. However, the implementation of such a measurement system for spatial variation in temperature on a frame is still at a very early stage and has only been trialed modestly [
9]. Obtaining a highly reliable measurement using such a setup would constitute a major step forward towards furthering the scientific understanding of how a colony develops [
1,
2,
4,
5] or how a colony uses a beehive at different points in time [
2,
5,
7].
Temperature sensors are readily available and inexpensive in the form of negative temperature coefficient thermistors [
10]. These thermistors work by exhibiting a resistance. An increase in temperature reduces the resistance and lower temperatures result in a higher resistance. It is well known that honeybees will propolise anything alien which is placed in the colony [
6]. However, similar thermistors have been used before and their performance remains unaffected by propolisation [
3]. As such, these thermistors are highly appropriate and can be soldered into a grid and used to measure temperatures at multiple locations.
We investigate the use of an array of negative temperature coefficient thermistors in a honeybee colony brood box to collect spatially resolved temperature measurements.
2. Materials and Methods
The spatially resolved temperature measurement systems used negative coefficient temperature thermistors [
10] to collect data from the hive. The quoted resistance of the Littlefuse 104JG1F thermistors is 100,000 Ω and the resistance tolerance at 25 °C is 1%; the temperature coefficient at 25 °C is −4.4%/°C and the temperature range is −55 to +300 °C.
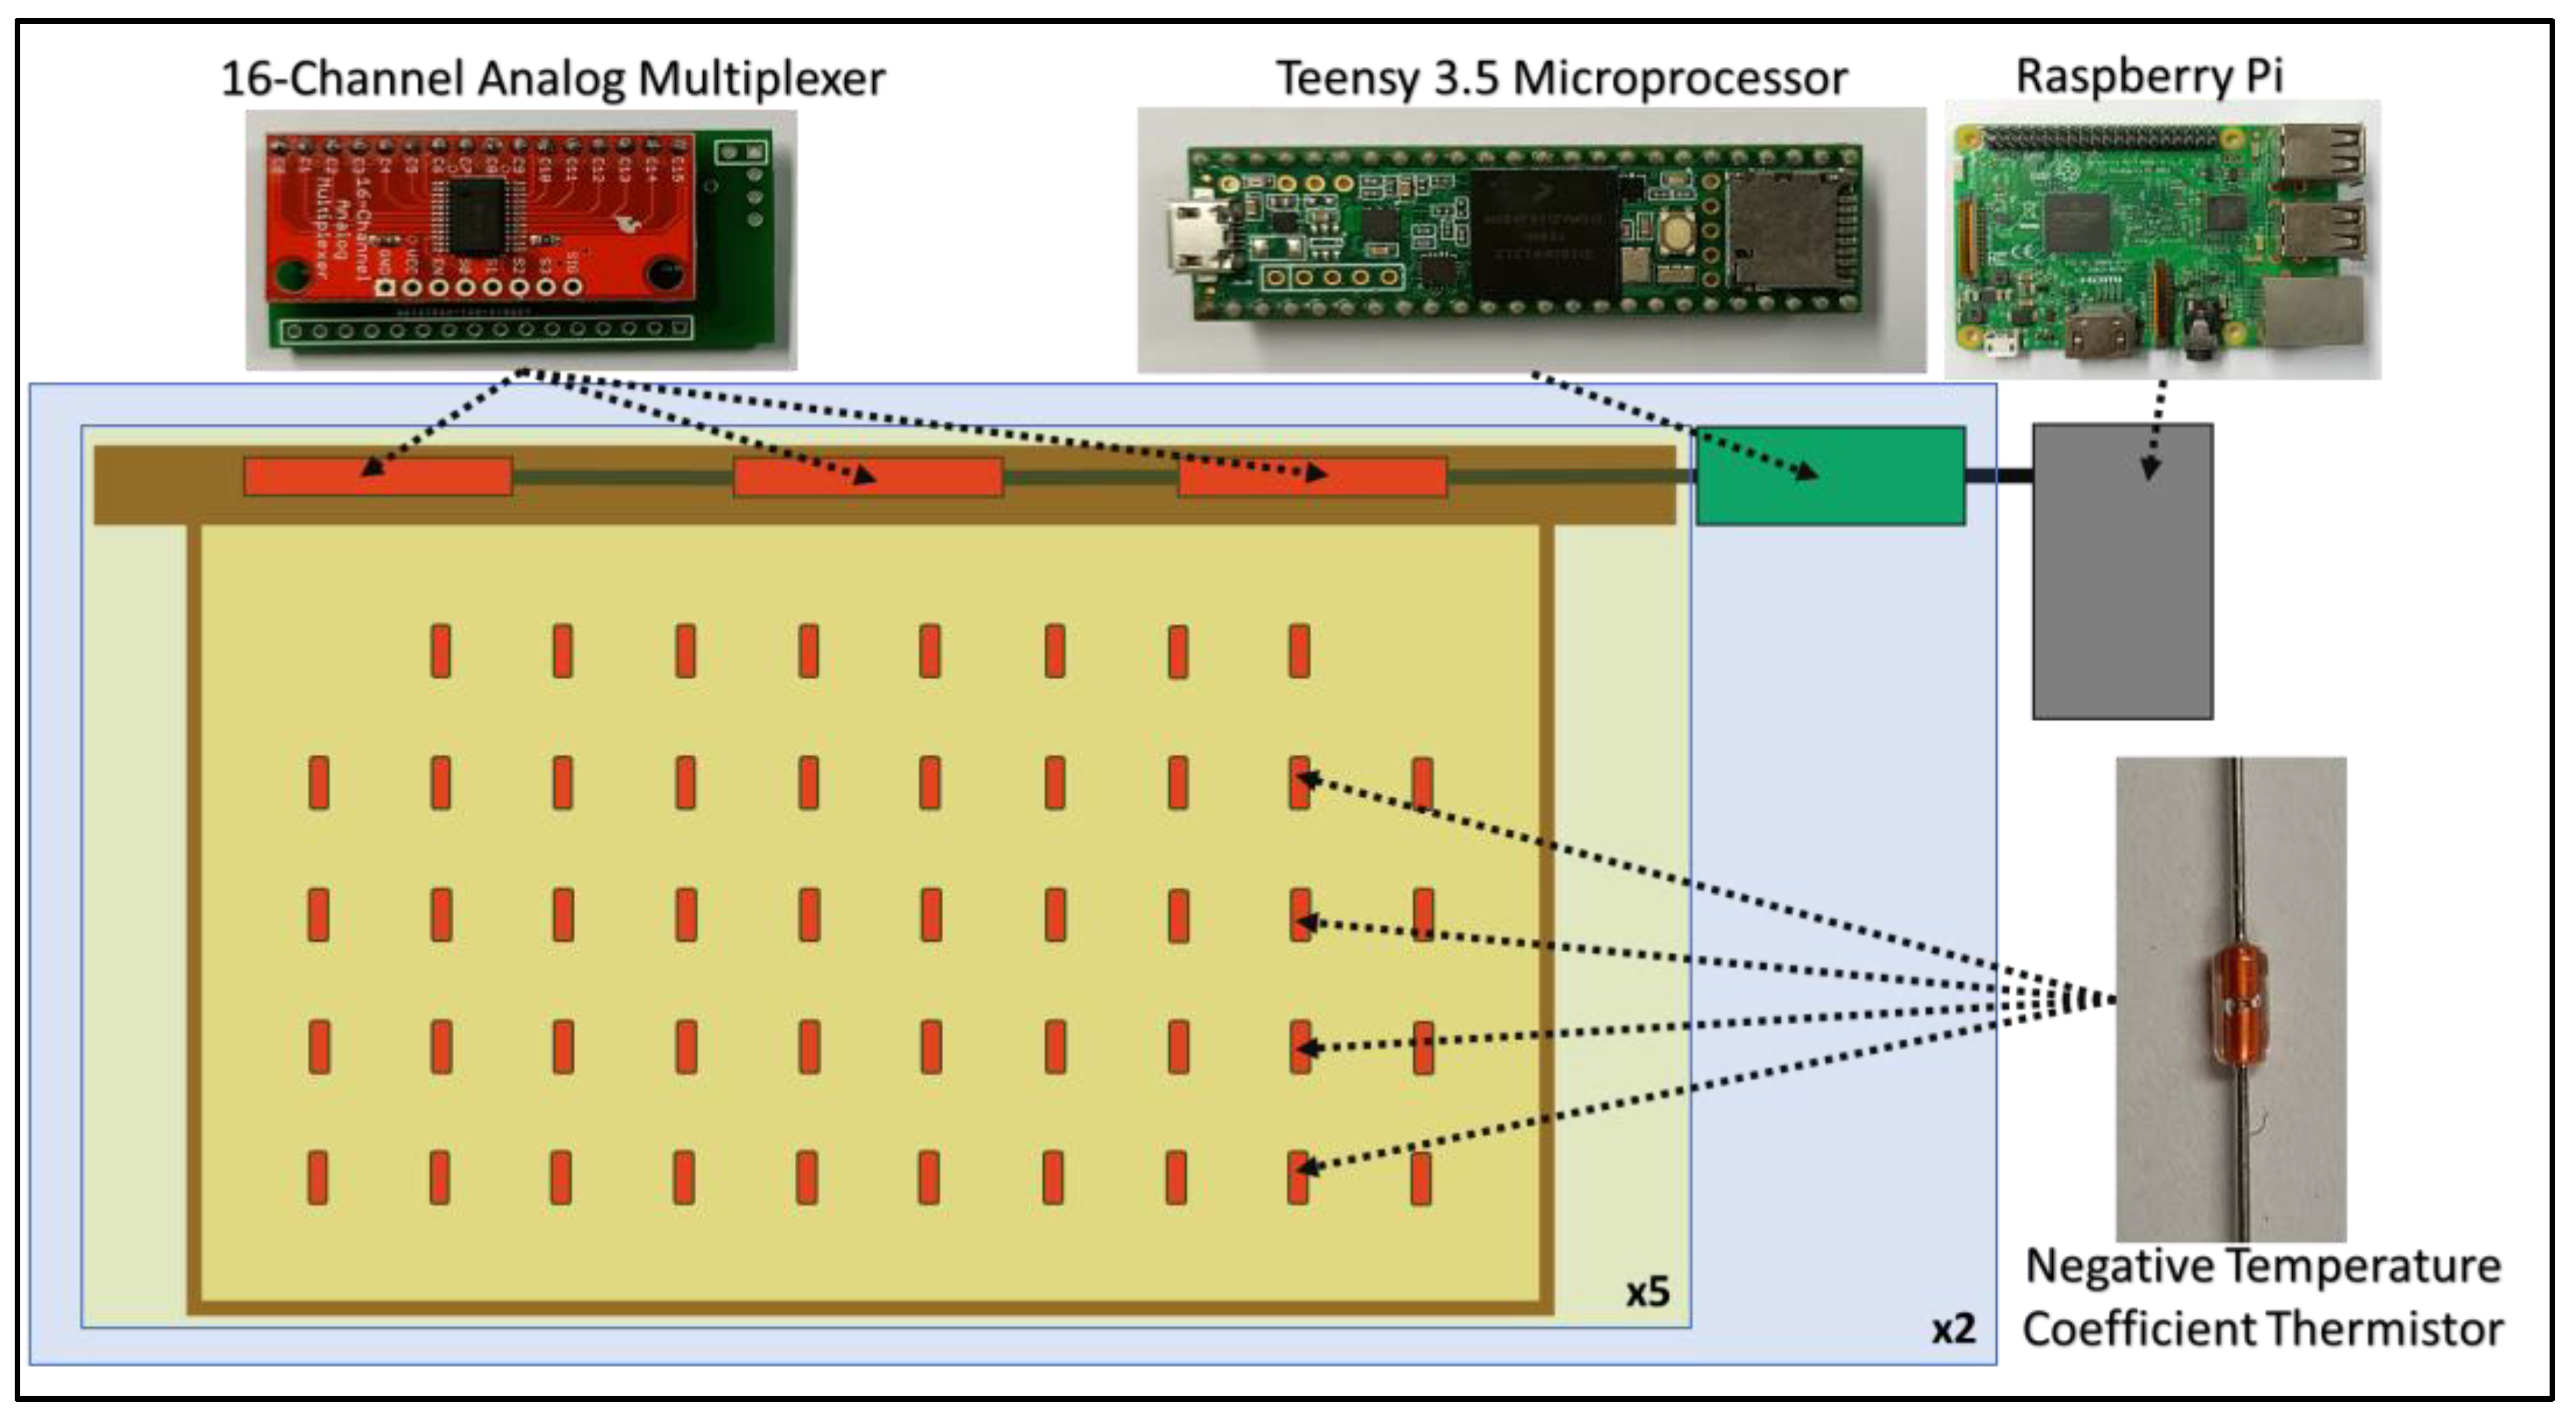
We used a British National hive and adapted it with ten customized brood frames. Each frame had a grid of forty-eight thermistors which were connected to three sixteen-channel analogue multiplexers [
11]. Each multiplexer could handle sixteen inputs, and this dictated that forty-eight sensors was the maximum number of sensors per frame.
The sensor array was laid out evenly with each thermistor being 3 cm away from another in all directions (
Figure 1). The multiplexers handled the successive reading of each sensor it was connected to, and the outputs were connected to a Teensy 3.5 microprocessor [
12]. Each Teensy has twenty-seven analogue input pins which could handle nine frames. However, the hive has ten frames; as such, two Teensy 3.5 were used to accommodate five frames each.
The Teensy 3.5 were programmed to read the resistance of the thermistors in sequence, calculate the temperature, and send it to a Raspberry Pi [
13]. The Raspberry Pi automatically reads the serial COM port data and saves every measurement and its corresponding timestamp to a file for further processing.
At the end of each day, a separate Octave software processes the temperature data collected into 5 min averaged values and into daily CSV files and figures, which are saved and emailed to the researchers.
Two spatially resolved temperature measurement systems were produced; the first prototype was ready for tests with live bees in March 2021. This system had the sensor array embedded between four layers of foundation wax, in order to place the sensors deep inside the structure, well away from bees’ access, and to make the frames more appealing to the bees. The first system was installed at Holme Pierrepont Hall and was populated with a colony in May 2021. However, the honeybees rejected the frames, exposing the electronics before building new honeycomb.
The second system was tested in April 2022, and it used a single sheet of foundation wax (≅1 mm thick) onto which the sensor array was laid. This system was installed at Nottingham Trent University Clifton Campus and was populated with a swarm in May 2022.
3. Results
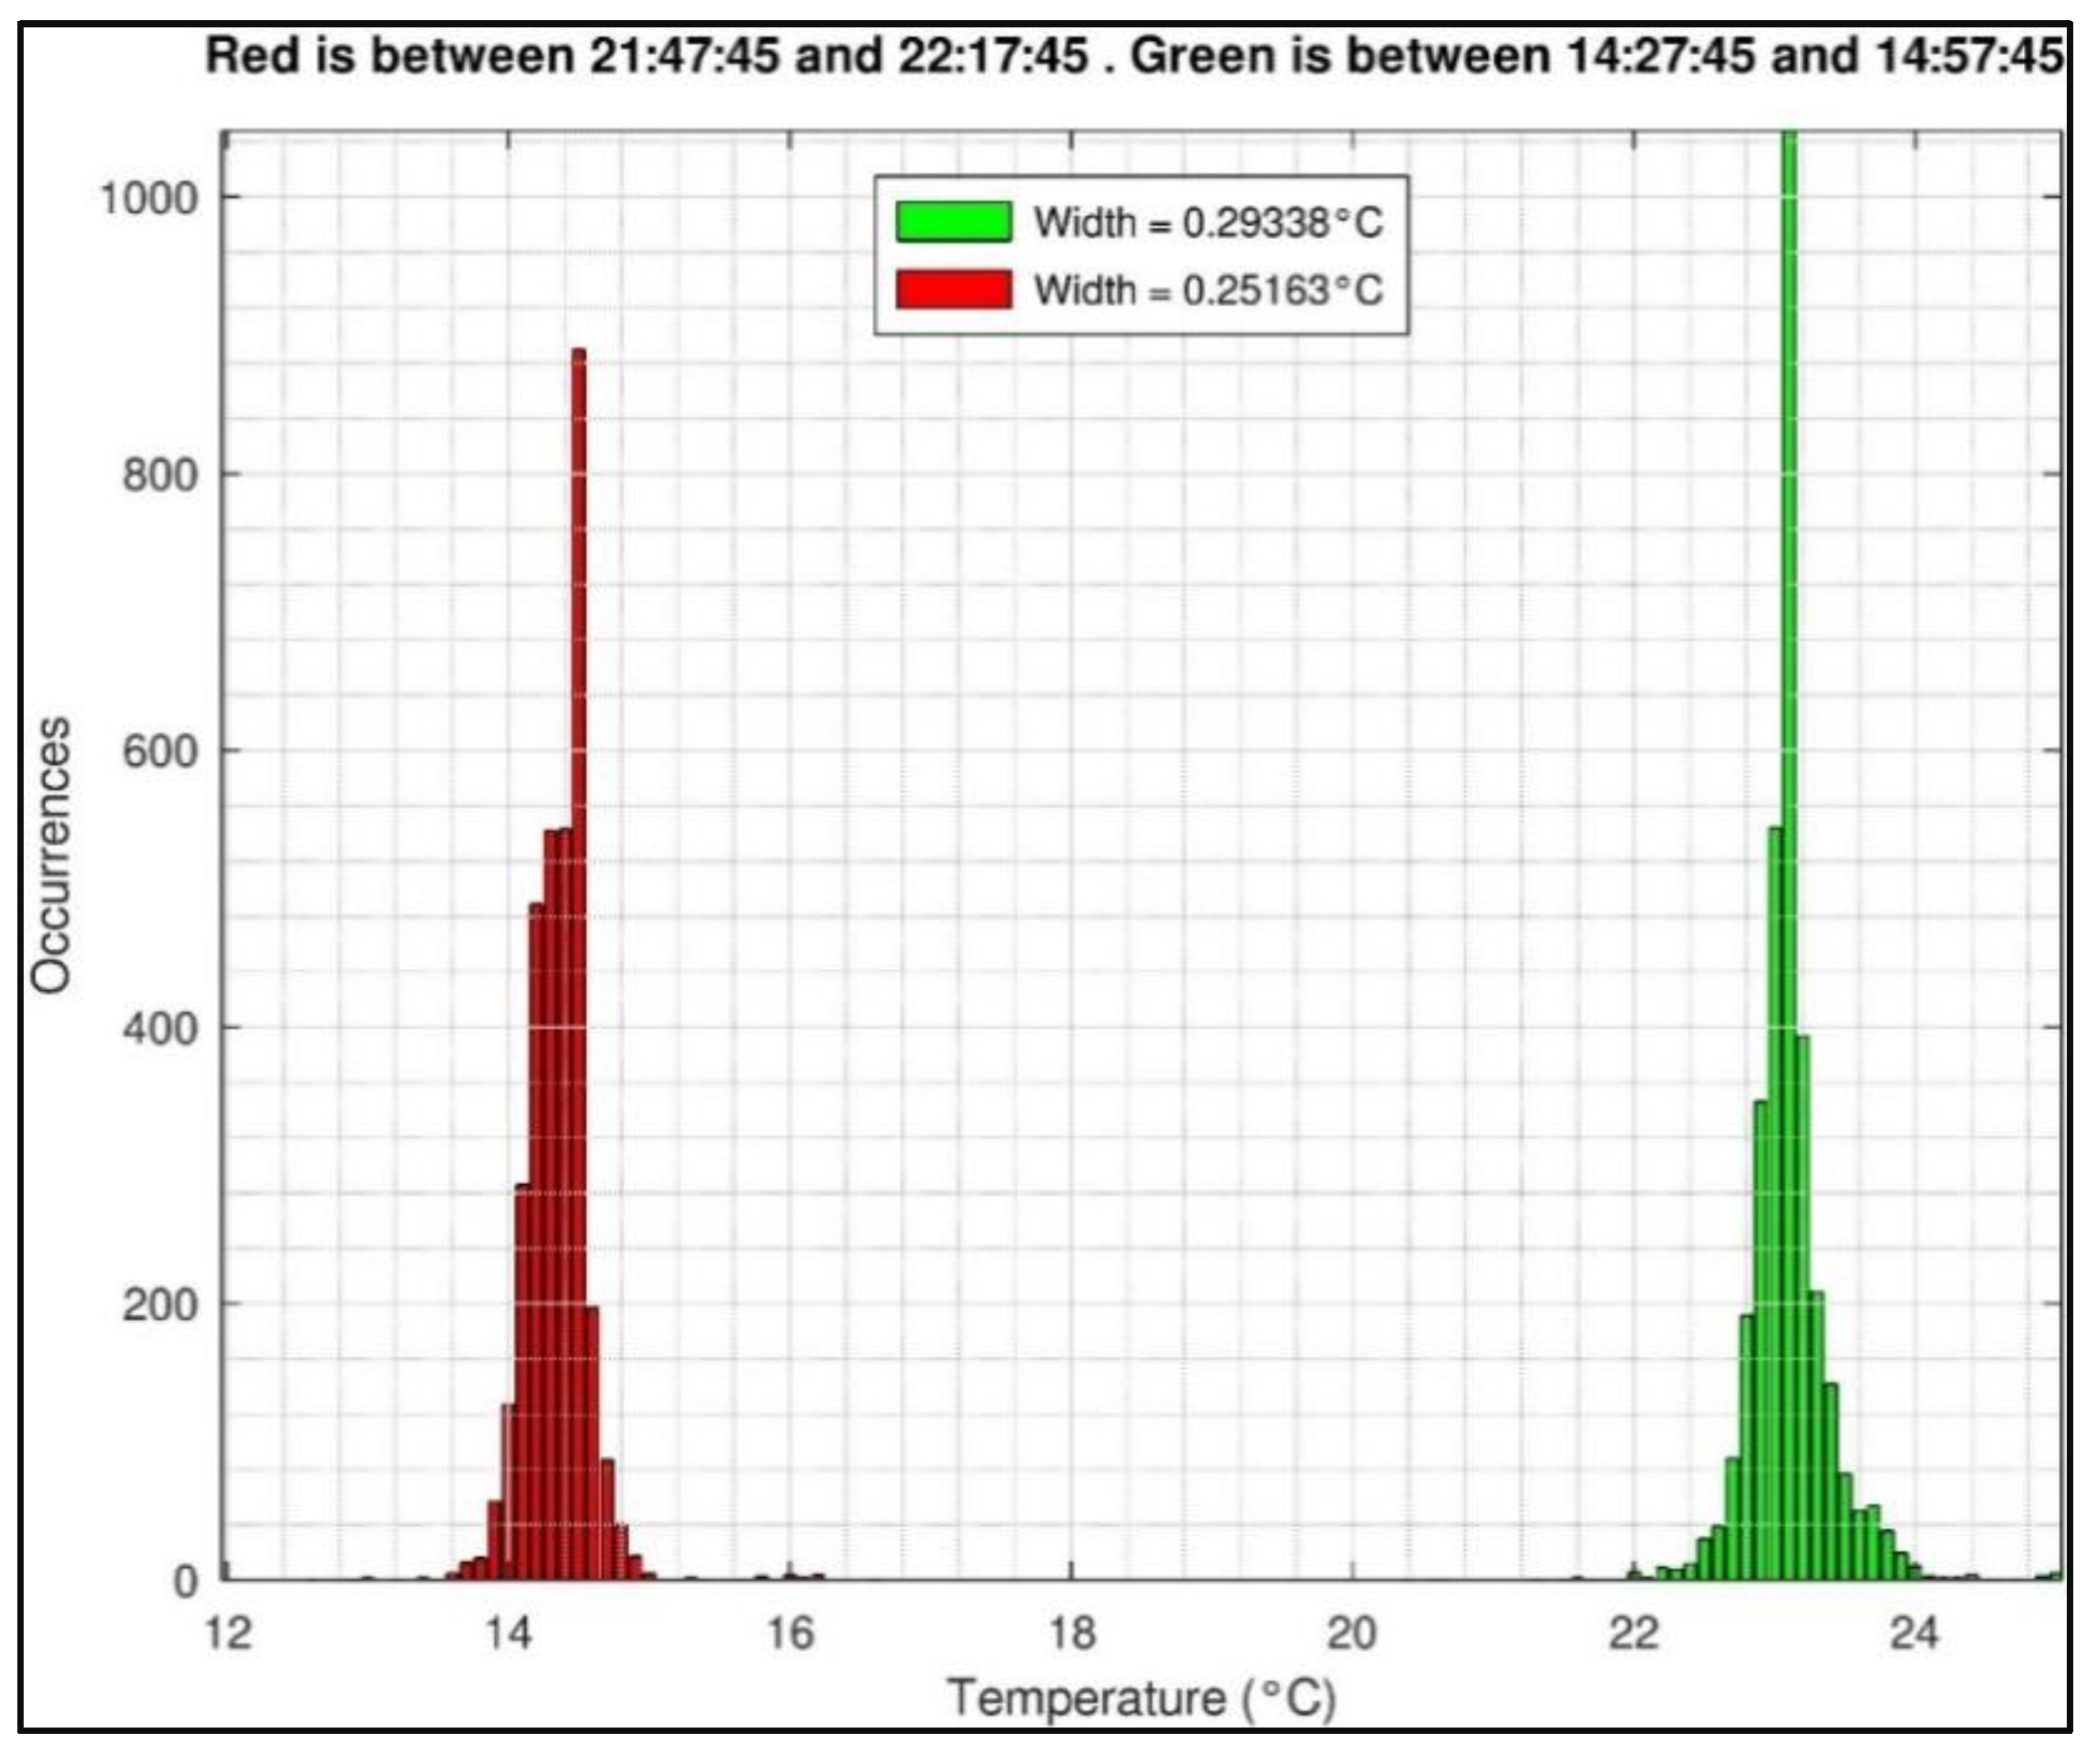
The second spatially resolved temperature system was tested in April 2022 and data were collected for several days before a colony was introduced. The sensors showed consistent measurements across the hive and displayed a small error in line with the manufacturer’s quoted tolerances and coefficients.
Figure 2 displays the temperature recorded by all sensors on a single day at two separate times. The recorded temperatures are consistent and reflect the ambient temperatures.
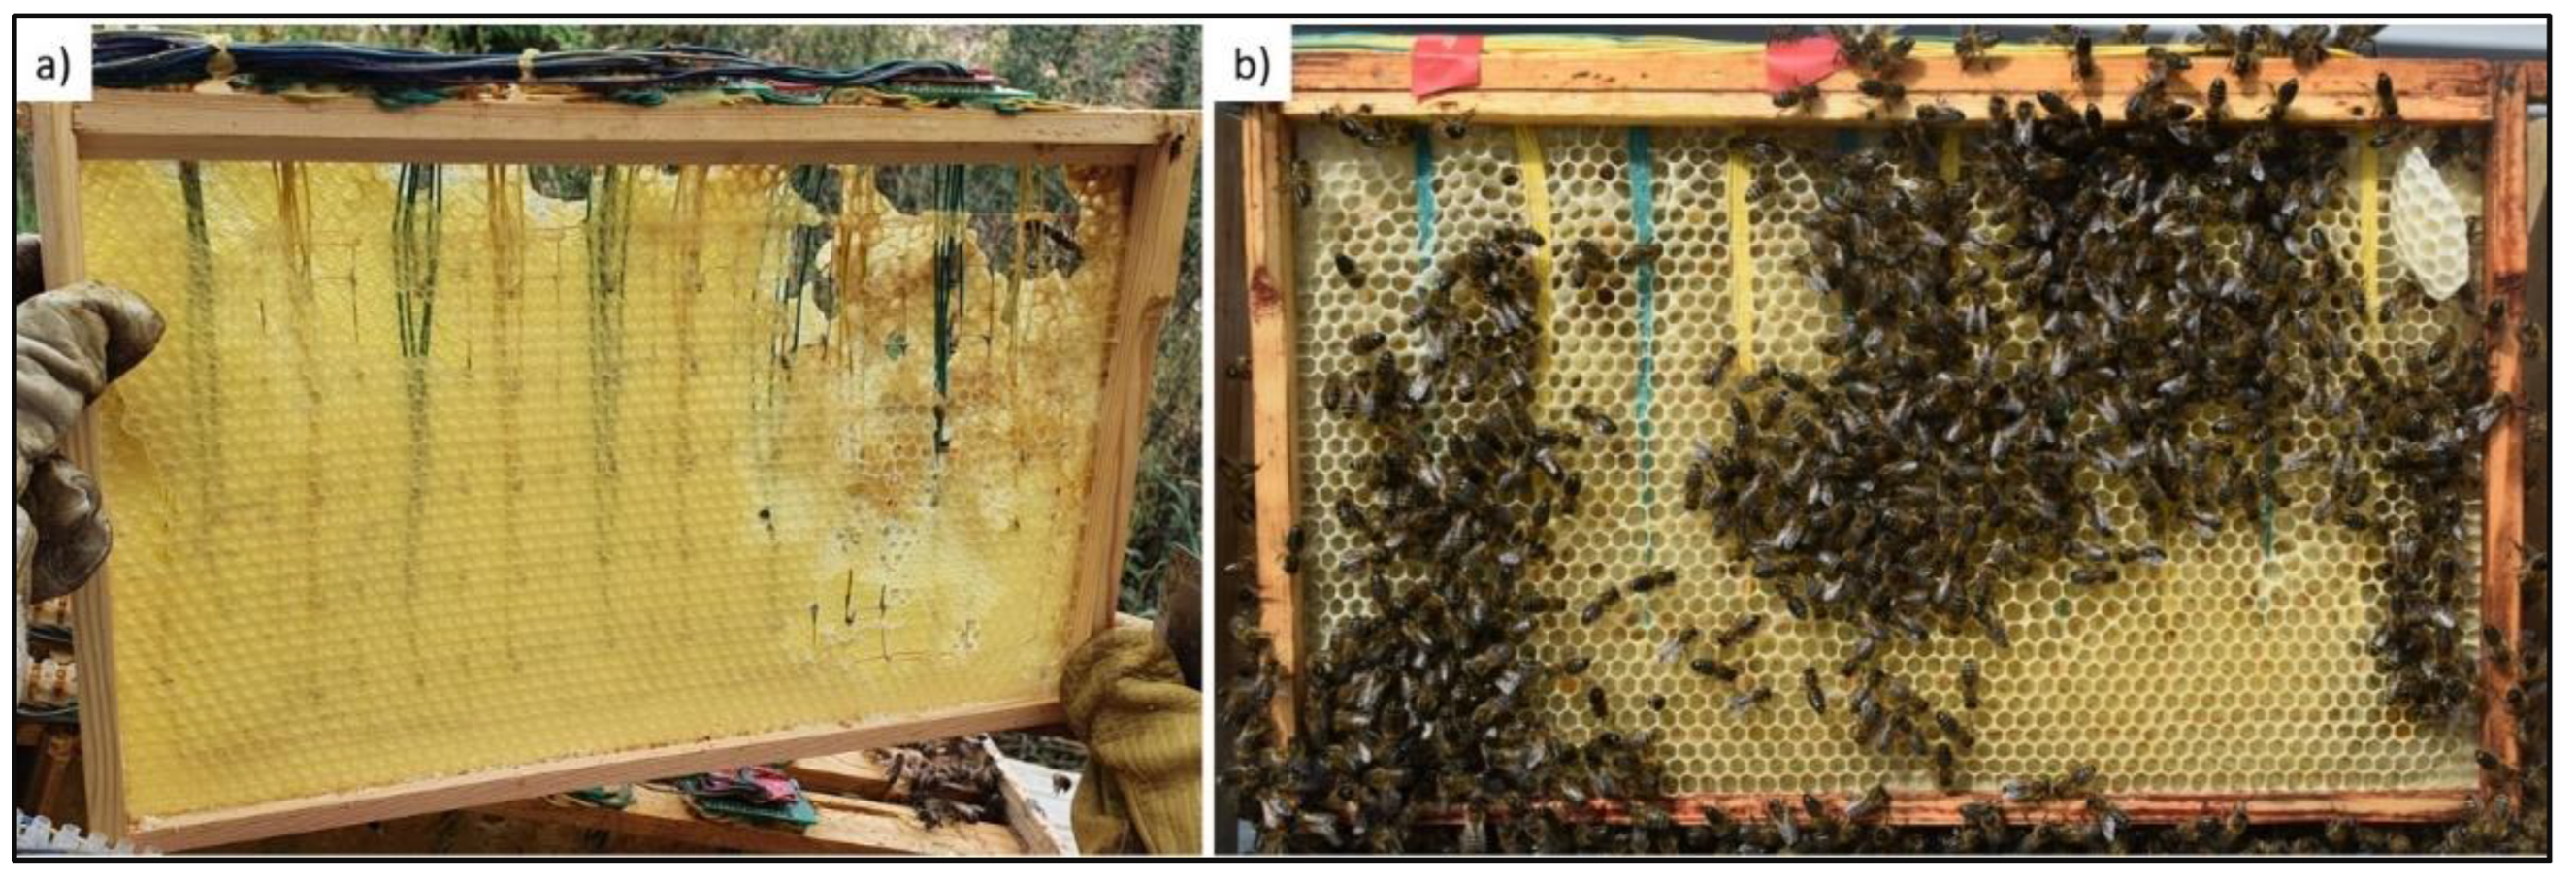
Figure 3 demonstrates the rejection of the first spatially resolved temperature measurement system and the acceptance of the second. The first system suffered from the bees chewing away the foundation wax, exposing electronics, before new honeycomb was built. The second system was accepted by the colony, which built honeycomb over the sensors, embedding the thermistors, and allowing spatially resolved temperatures to be taken of the colony developing normally.
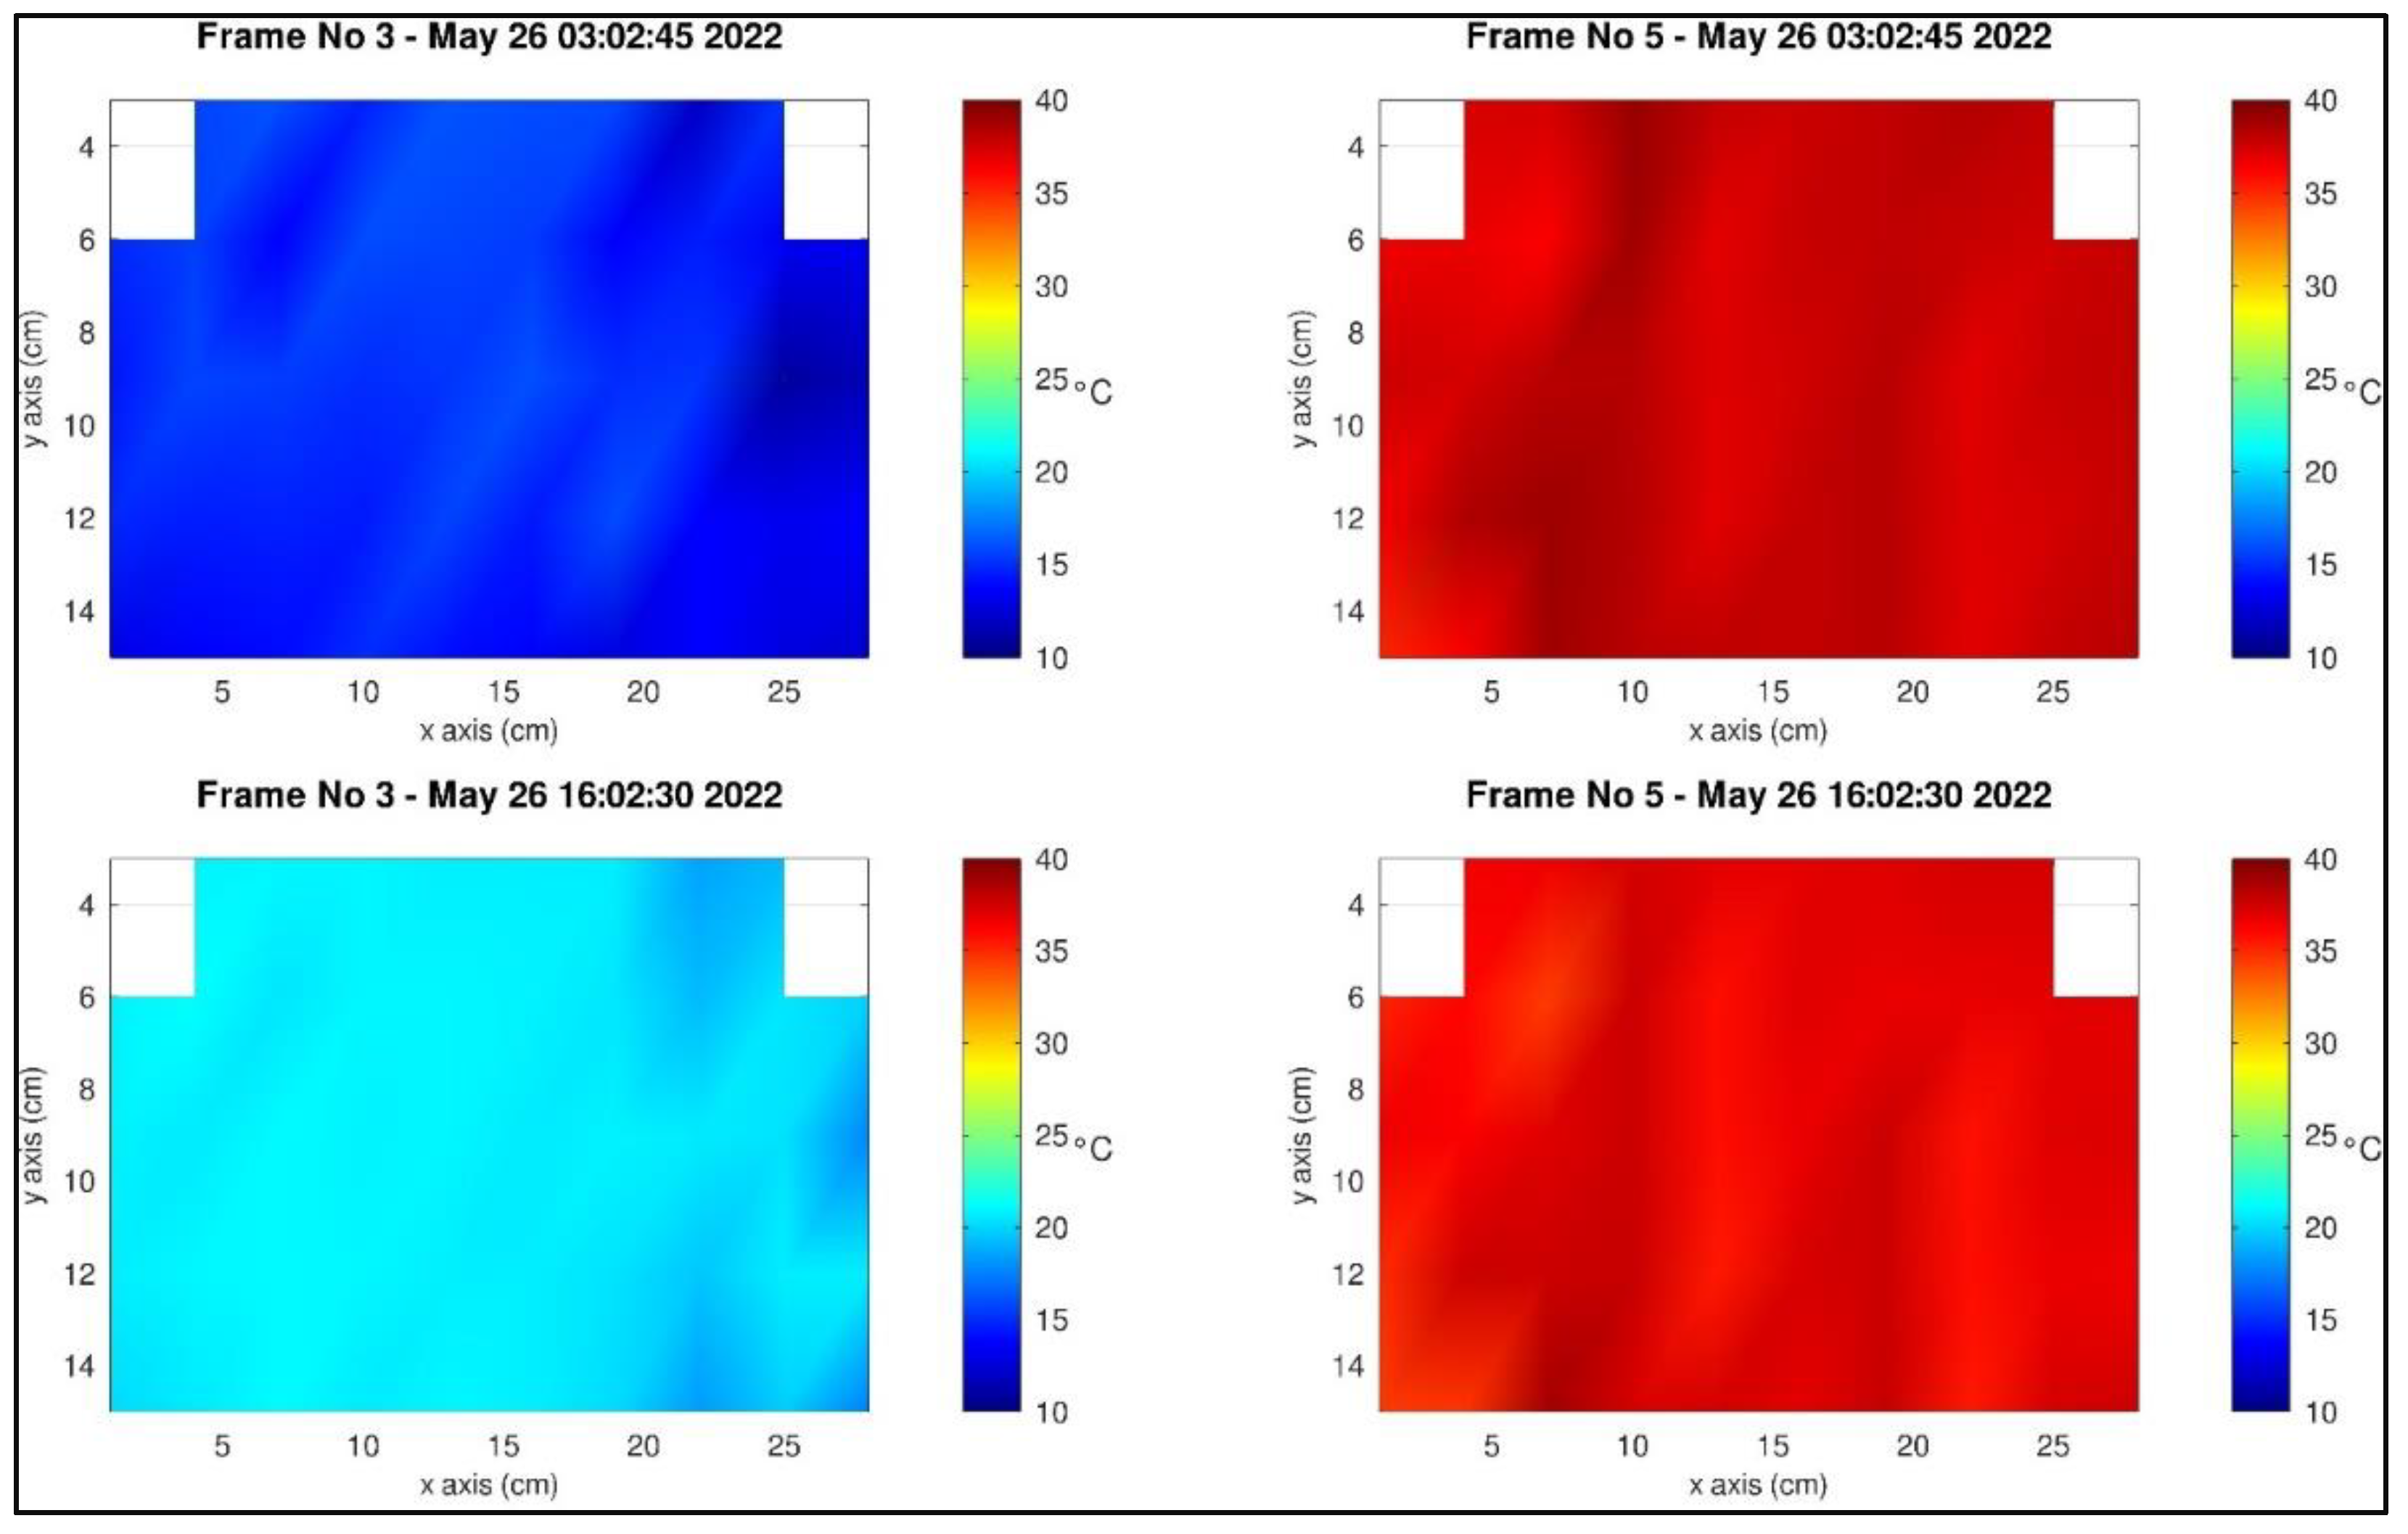
Highly valuable temperature data were collected across all frames from the second colony with examples provided in
Figure 4. Honeycomb has been built on Frame 5 and our system records temperatures around 35 °C on that day, reflecting the use of this frame for brood. Frame 3 has not been used (yet) by the honeybees, and the data reflect this.
Additionally,
Figure 4 displays the temperature variation detected from across a single frame. Frame 5 has patches of warmer temperatures with other areas exhibiting lower temperatures, and this is seen at both timepoints. The temperature of Frame 3 was much lower, closer to 10–15 °C at 3 am and around 20 °C at 4 pm. Again, the temperature varies across the frame with some sections being colder than others.
4. Discussion
The system provided spatially resolved temperature data with 480 reliable individual measurements across a brood box which captured variations in frame temperature. Distinctive features recorded include the detection of brood rearing temperatures and the spatial variation in temperatures. Detecting these features with high spatial resolution is an important step to furthering our understanding of colony development [
1,
2,
4,
5,
7].
Placing any foreign object into a hive is challenging [
6] and, from our experiences, we now know that introducing an array of hundreds of thermistors is possible. Furthermore, we have discovered that the way the sensors are provided is extremely important in determining if a colony will accept or reject the frames. Multiple layers of wax embedding the sensors may result in cells not perfectly aligning, or the wax being too thick for honeycomb construction. The second system used a single sheet of foundation wax, onto which the sensors were laid, and this was used normally for brood rearing and honeycomb construction, highlighting that minimal disruption to the foundation wax is optimum when designing such a sensor array.
Consequently, we can now collect highly valuable spatially resolved temperature data of a colony inside a brood box in a fully automated way, with affordable hardware.
Author Contributions
Conceptualization, A.M., M.I.N. and M.B.; investigation, M.I.N., C.T., A.M. and M.B. All authors have read and agreed to the published version of the manuscript.
Funding
This project receives funding from the European Union’s Horizon 2020 research and innovation programme as part of the Giving Beekeeping Guidance by cOmputatiOnal-assited Decision making (B-GOOD) consortium under grant agreement No 817622.
Institutional Review Board Statement
Not applicable.
Informed Consent Statement
Not applicable.
Data Availability Statement
Acknowledgments
The authors acknowledge the owners of Holme Pierrepont Hall Nottingham UK for hosting the UK B-GOOD apiary.
Conflicts of Interest
The authors declare no conflict of interest.
References
- Braga, A.R.; Freitas, B.M.; Gomes, D.G.; Bezerra, A.D.; Cazier, J.A. Forecasting sudden drops in temperature in pre-overwintering honeybee colonies. Biosyst. Eng. 2021, 209, 315–321. [Google Scholar] [CrossRef]
- Moritz, R.; Southwick, E.E. Bees as Superorganisms: An Evolutionary Reality; Springer Science & Business Media: Berlin, Germany, 2012. [Google Scholar] [CrossRef]
- Kridi, D.S.; de Carvalho, C.G.N.; Gomes, D.G. Application of wireless sensor networks for beehive monitoring and in-hive thermal patterns detection. Comput. Electron. Agric. 2016, 127, 221–235. [Google Scholar] [CrossRef]
- Seeley, T.D.; Visscher, P.K. Survival of honeybees in cold climates: The critical timing of colony growth and reproduction. Ecol. Entomol. 1985, 10, 81–88. [Google Scholar] [CrossRef]
- Stalidzans, E.; Berzonis, A. Temperature changes above the upper hive body reveal the annual development periods of honey bee colonies. Comput. Electron. Agric. 2013, 90, 1–6. [Google Scholar] [CrossRef]
- Meikle, W.G.; Holst, N. Application of continuous monitoring of honeybee colonies. Apidologie 2015, 46, 10–22. [Google Scholar] [CrossRef]
- Eskov, E.K.; Toboev, V.A. Seasonal dynamics of thermal processes in aggregations of wintering honey bees (Apis mellifera, Hymenoptera, Apidae). Entomol. Rev. 2011, 91, 354–359. [Google Scholar] [CrossRef]
- Owens, C.D. The Thermology of Wintering Honey Bee Colonies; No. 1429; US Agricultural Research Services: Washington, DC, USA, 1971. [CrossRef]
- Stevenson, S. Observations of a beehive using 3D thermal monitoring. Am. Bee J. 2022, 162, 567–572. [Google Scholar]
- Littelfuse 104JG1F. Available online: https://www.littelfuse.com/products/temperature-sensors/leaded-thermistors/glass-encapsulated-thermistors/do-35-standard/104jg1f.aspx (accessed on 3 August 2022).
- SparkFun Analog MUX CD74HC4067. Available online: https://www.sparkfun.com/products/9056 (accessed on 3 August 2022).
- Teensy 3.5 Development Board. Available online: https://www.pjrc.com/store/teensy35.html (accessed on 3 August 2022).
- Raspberry Pi 3 B. Available online: https://www.raspberrypi.com/products/raspberry-pi-3-model-b/ (accessed on 3 August 2022).
| Disclaimer/Publisher’s Note: The statements, opinions and data contained in all publications are solely those of the individual author(s) and contributor(s) and not of MDPI and/or the editor(s). MDPI and/or the editor(s) disclaim responsibility for any injury to people or property resulting from any ideas, methods, instructions or products referred to in the content. |
© 2022 by the authors. Licensee MDPI, Basel, Switzerland. This article is an open access article distributed under the terms and conditions of the Creative Commons Attribution (CC BY) license (https://creativecommons.org/licenses/by/4.0/).


