Proceeding Paper

Influence of Agricultural Activity on the Surface Climate of New Delta of Egypt Using the RegCM4 †

Egyptian Meteorological Authority, Qobry EL-Kobba, Cairo 11784, Egypt
*
Author to whom correspondence should be addressed.
Presented at the 3rd International Electronic Conference on Applied Sciences, 1–15 December 2022; Available online: https://asec2022.sciforum.net/.
Eng. Proc. 2023, 31(1), 43; https://doi.org/10.3390/ASEC2022-13763
Published: 1 December 2022
(This article belongs to the Proceedings of The 3rd International Electronic Conference on Applied Sciences)

Abstract

:
Land-use changes (e.g., transition from desert to crop) can induce considerable influence on the surface climate and terrestrial water cycle (represented by potential evapotranspiration; PET). Additionally, regional climate models (e.g., RegCM4) can be useful tools for exploring regional changes associated with land-use. In the present, the influence of a cropped area (of the New Delta of Egypt) on the temperature extremes (Tmax and Tmin), and potential evapotranspiration (PET) was examined using a regional climate model (RegCM4). The MPI-ESM-MR was used as atmospheric forcing to drive the RegCM4 over the Middle East and North Africa (MENA) with 50 km grid spacing and then nested over Egypt with 20 km grid spacing. To consider the effect of the cropped area, two experiments were conducted: the first one is occupied with desert (CTRL) and the other one considers the cropped area (EXP). The two experiments were integrated from 1980 to 2100 considering the moderate future scenario representative concentration pathway 4.5 (RCP45). The results showed that the cropped area induces a reduction in both Tmax and Tmin (by 0.5–2 °C) as well as a reduction in PET (by 5 mm month−1). In summary, RegCM4 can be considered a useful tool to examine the possible effects associated with cropped areas. Additionally, considering other atmospheric forcing is important in order to account for the uncertainty associated with the lateral boundary condition.

1. Introduction

Many global modeling studies concerning land cover changes have been conducted with results dependent on geographic location and conversion type [1,2,3,4], but there are no important studies on land-use change on North Africa especially in the northeast, although North Africa is extremely exposed to this climate change. The annual temperatures will gradually increase gradually above the average due to climate change [5], so heat waves will be more intensive and longer. Therefore, it will be particularly affected by droughts, which will be more frequent in the coming years.
The authors of [6] reported that irrigating crop played an important physical rule in mitigating future risk associated with climate change. Various indicators were examined as a result of irrigated crops, such as: the surface wind speed, boundary layer height and surface albedo.
It is important to mention that the New Delta project in Egypt aims to increase the agricultural area, trying to find a smart solution for the reduction in land areas suitable for agriculture (due to rising temperatures associated with climate change, and water systems and food security). However, the potential influence of the cropped area on the surface climate and PET has not been examined for Egypt until now. Therefore, the present study aims to examine the regional effects associated with the cropped area of the New Delta using the RegCM4 model for the following variables: maximum (Tmax) and, minimum air temperature (Tmin), relative humidity (RH) and potential evapotranspiration (PET).

2. Materials and Methods

2.1. Study Area

This study focuses on the effect of the new agriculture region called New-Delta on the surface climate. The New Delta lies in the north west of Egypt.

2.2. Model Description and Experiment Design

The experiment design of the control simulation (CTRL) is based on the work conducted by [7]. To examine the role of the land use (cropped area; EXPT), another simulation was done. The two simulations were integrated over the period of 1980 to 2100. The period 1980–2005 was considered as the reference period (RF), while the period 2006–2100 was considered as the future scenario. It is important to highlight that the proposed land-use change in the present study (see Figure 1) is considered as hypothetical, because it was assumed that soil moisture is available during the EXPT simulation. Additionally, the crop land-use is represented based on some physical prosperities (such as reflectivity) and it is not based on complex physiological processes. In this work, PET was calculated using the Hargreaves–Samani method following [7] to allow us to track PET changes as a result of changes in the mean air temperature.

3. Results

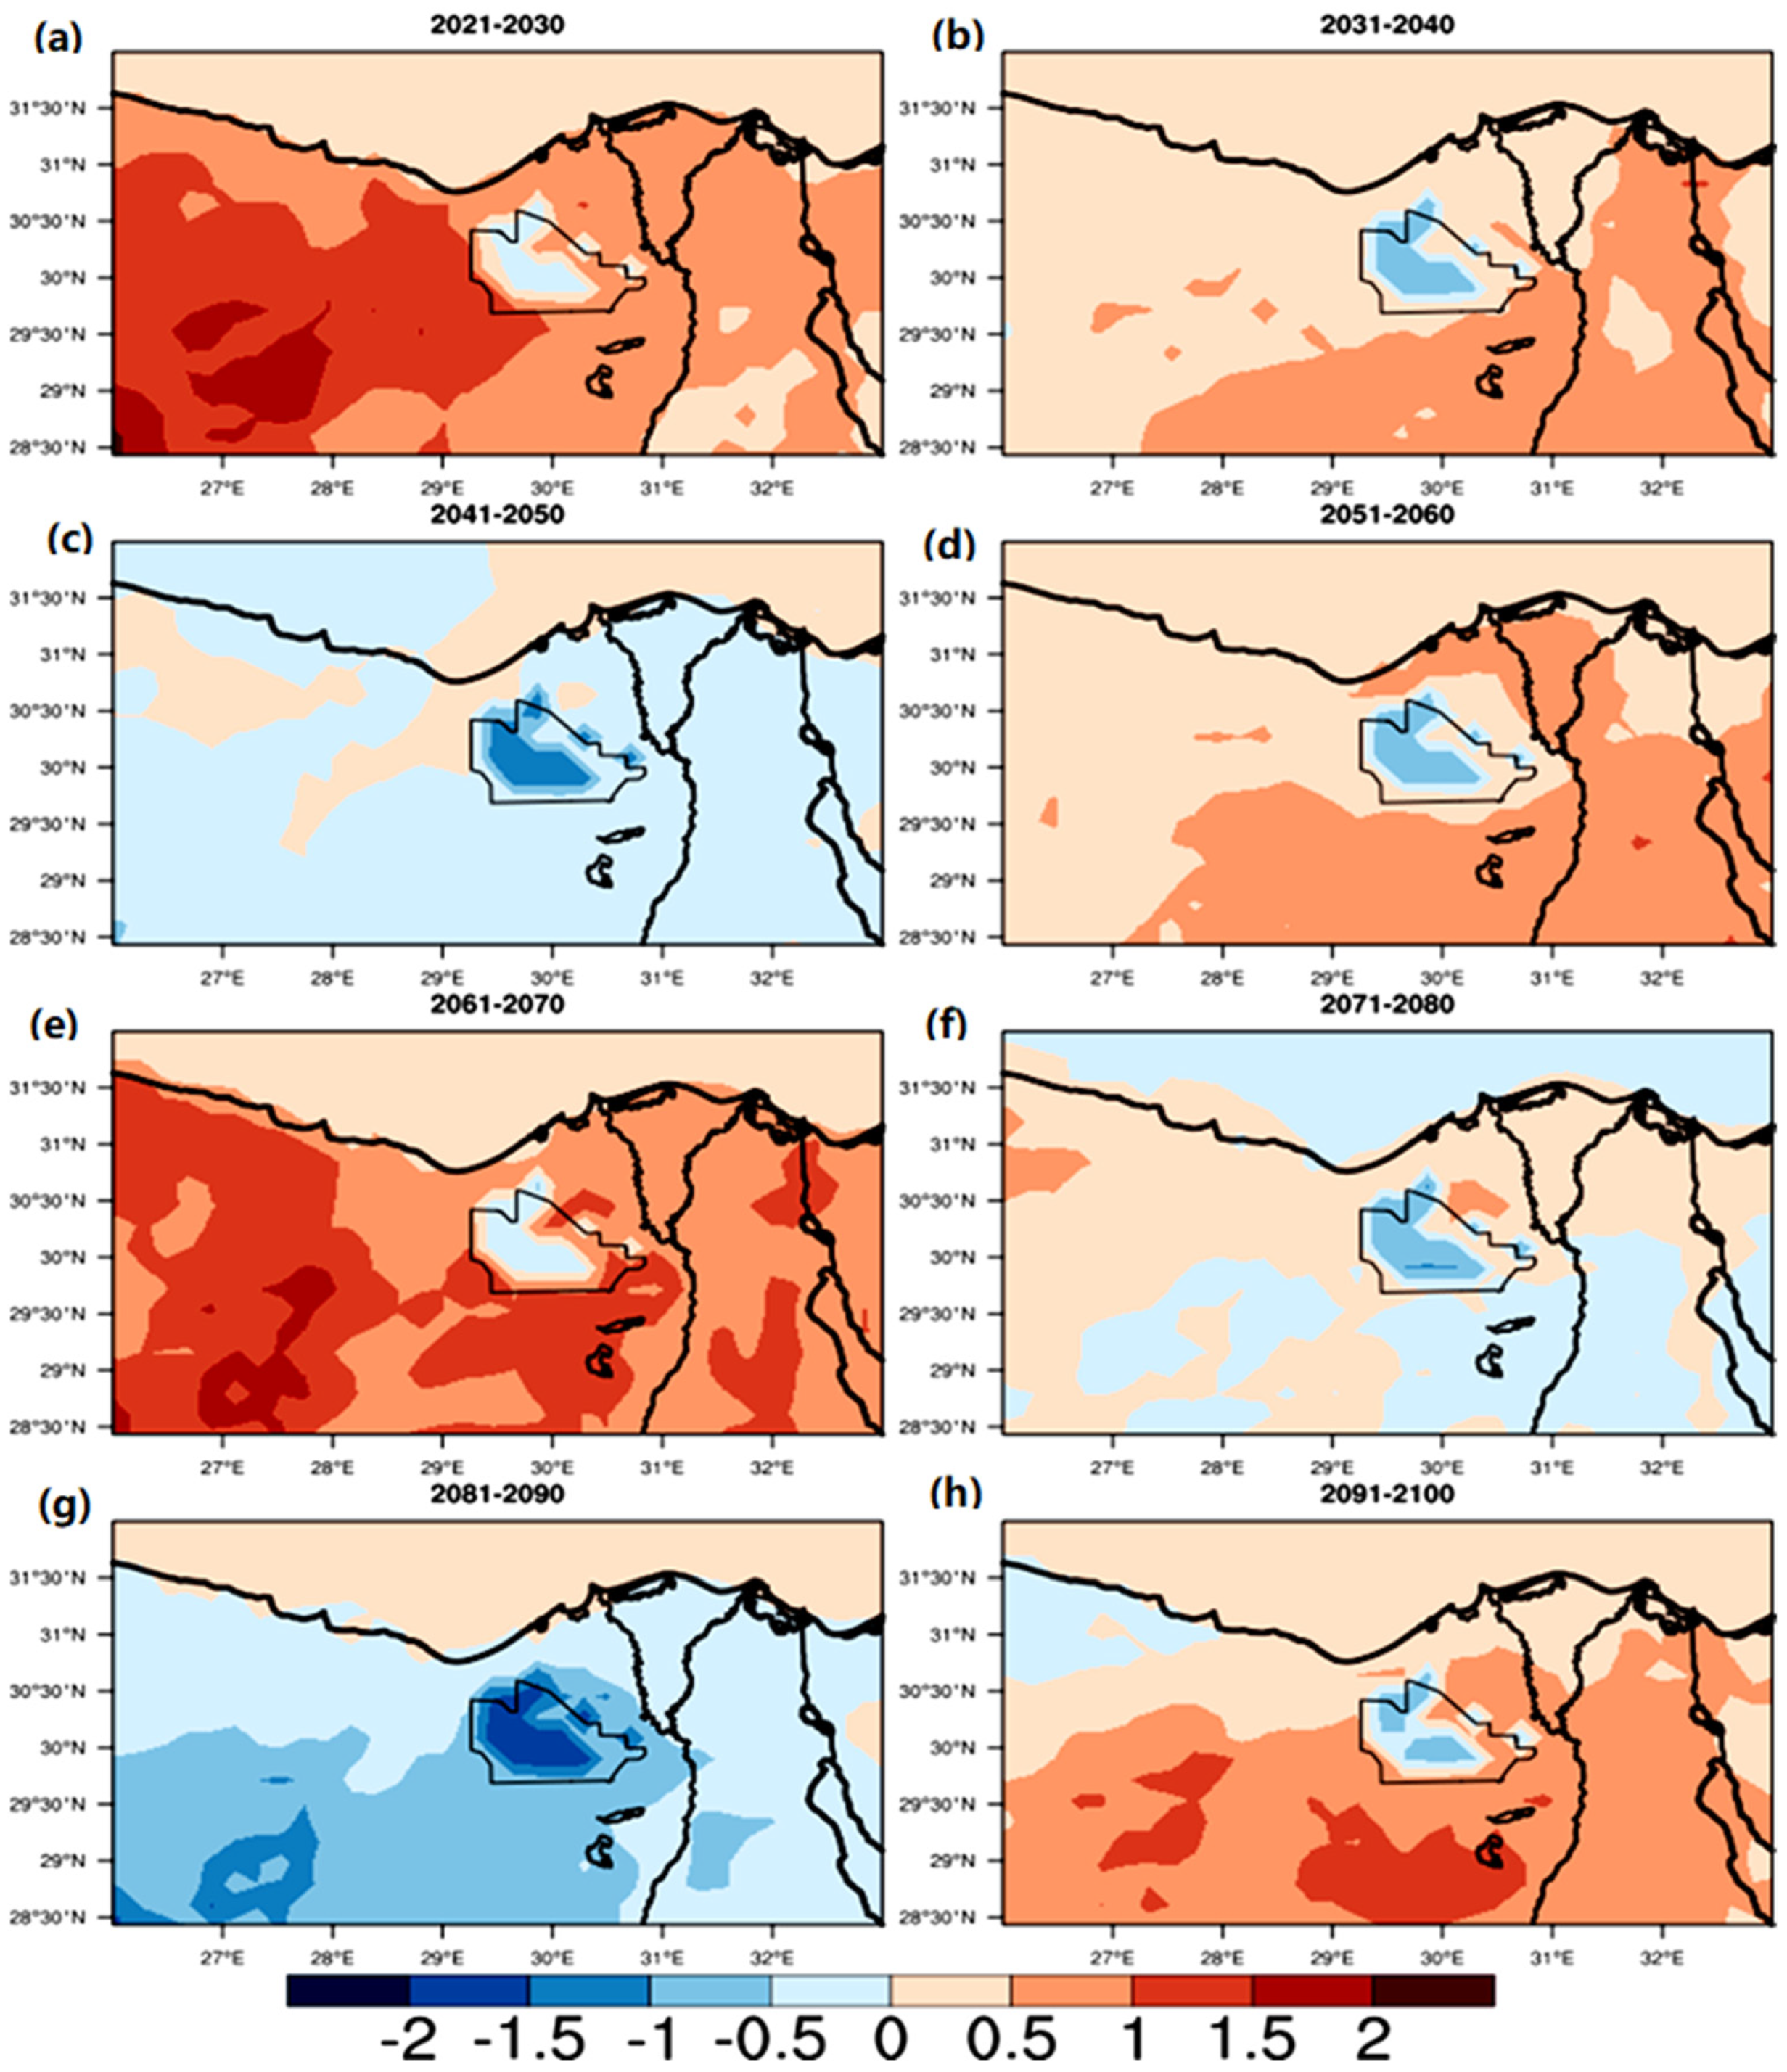
For brevity in analysis, only spring season (March–April–May; MAM) was examined for the potential future projected changes between the EXPT and CTRL simulations. Changes were examined for every averaged 10-year period in the period 2021–2100 as follows: 2021 to 2030, 2031 to 2040, 2041 to 2050, 2051 to 2060, 2061 to 2070, 2071 to 2080, 2081 to 2090 and 2091 to 2100. Figure 2 shows the averaged changes of Tmax due to cropping activity in the New Delta region. In general, it can be noted that the EXPT induces a cooling effect relative to the CTRL for all time segments. However, the degree of cooling differs with respect to the time segment being examined. For instance, from Figure 2c,g it can be noted that EXPT induces a decrease in Tmax by 1.5–2 °C in the time segments 2041–2050 and, 2081–2090, while in Figure 2a,b,d,e,f,h, Tmax decreases by 0.5–1 °C. This cooling effect can be explained by the increase in RH (see Figure 3) as a result of an increasing total evapotranspiration and decreasing sensible heat flux.
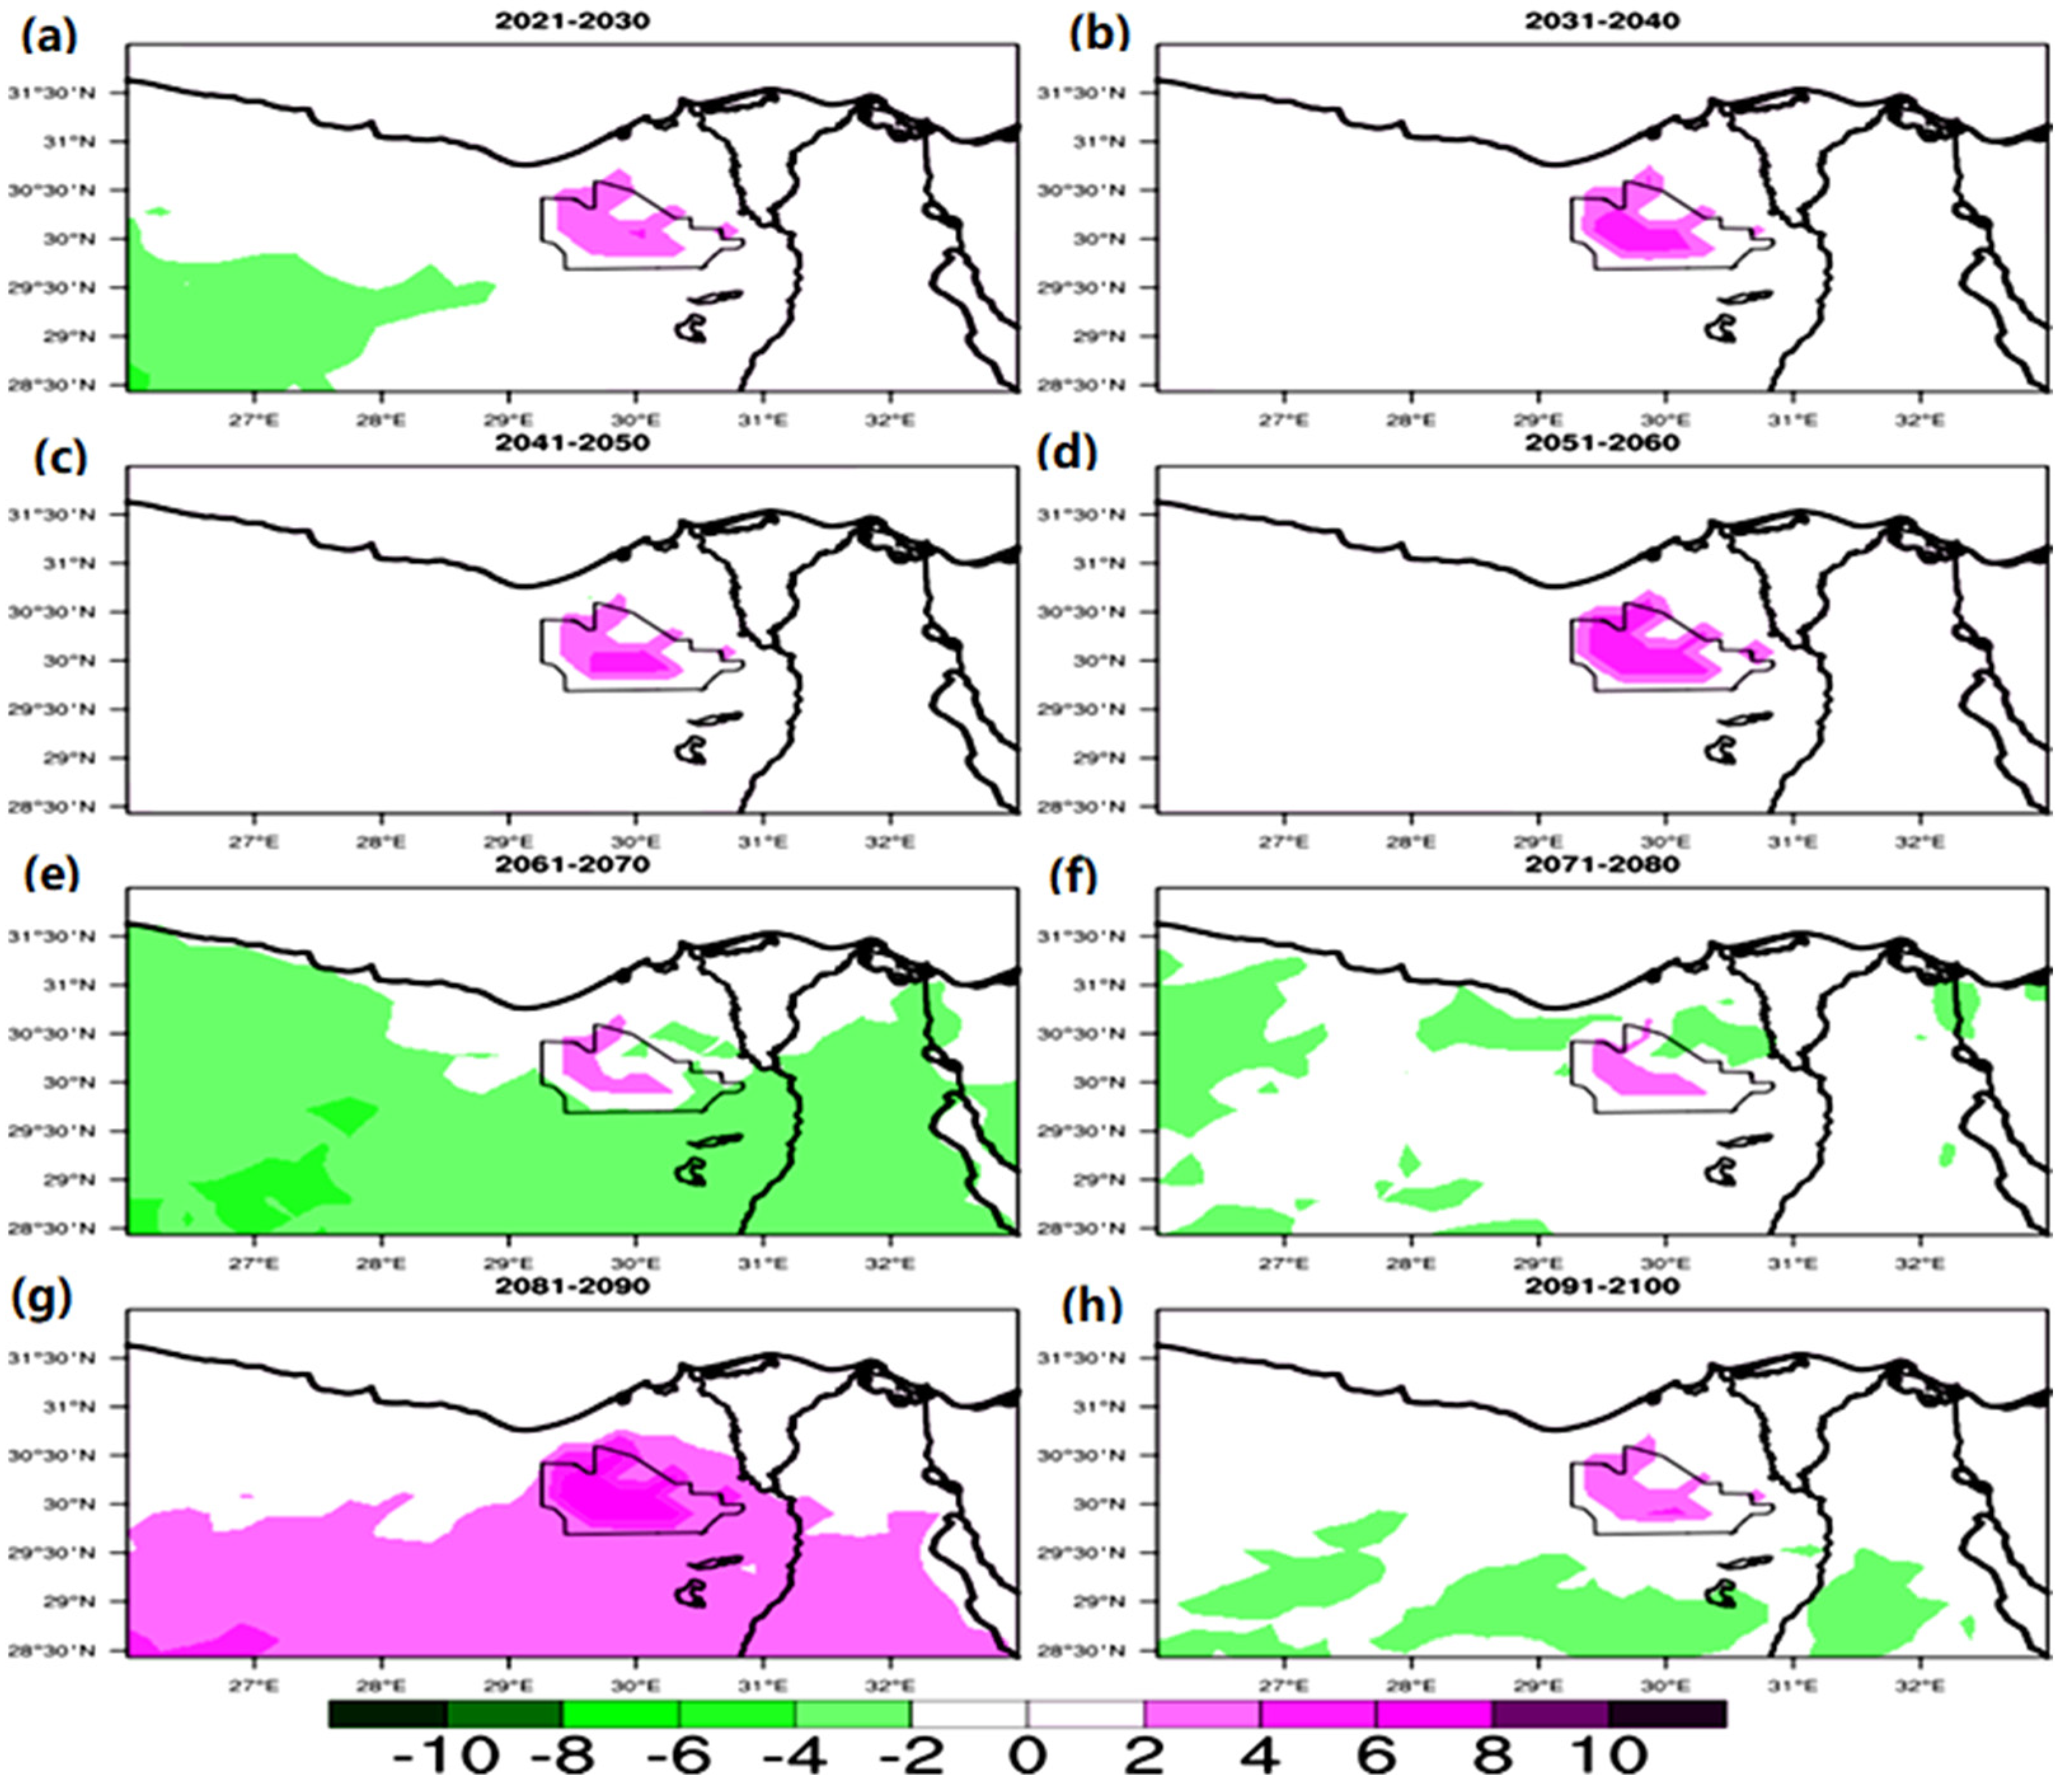
In Figure 4, it can be observed that EXPT induces a considerable decrease in Tmin relative to CTRL in all time segments particularly 2041–2050, 2071–2080 and 2091–2100 (Figure 4c,f,h). This decrease can be attributed to the fact that the cropped area emits less longwave radiation than the desert, leading to a decrease of Tmin. In Figure 2 and Figure 4, it can be observed that there is no remote effect associated with the cropped area. In other words, it is localized to the cropped area only. Furthermore, the regional temperature changes (Tmax/Tmin) outside the cropped area can be attributed to the RegCM4 physical parameterization as well as the MPI-ESM-MR as an atmopheric forcing. Concerning RH, it can be observed that EXPT is higher than CTRL by 4–8% in all time segments (see Figure 3). This increase can be explained by: (1) the decrease in both Tmax and Tmin and (2) the increase in water vapor released to the atmosphere as a result of the evapotranspiration process during the day/night.
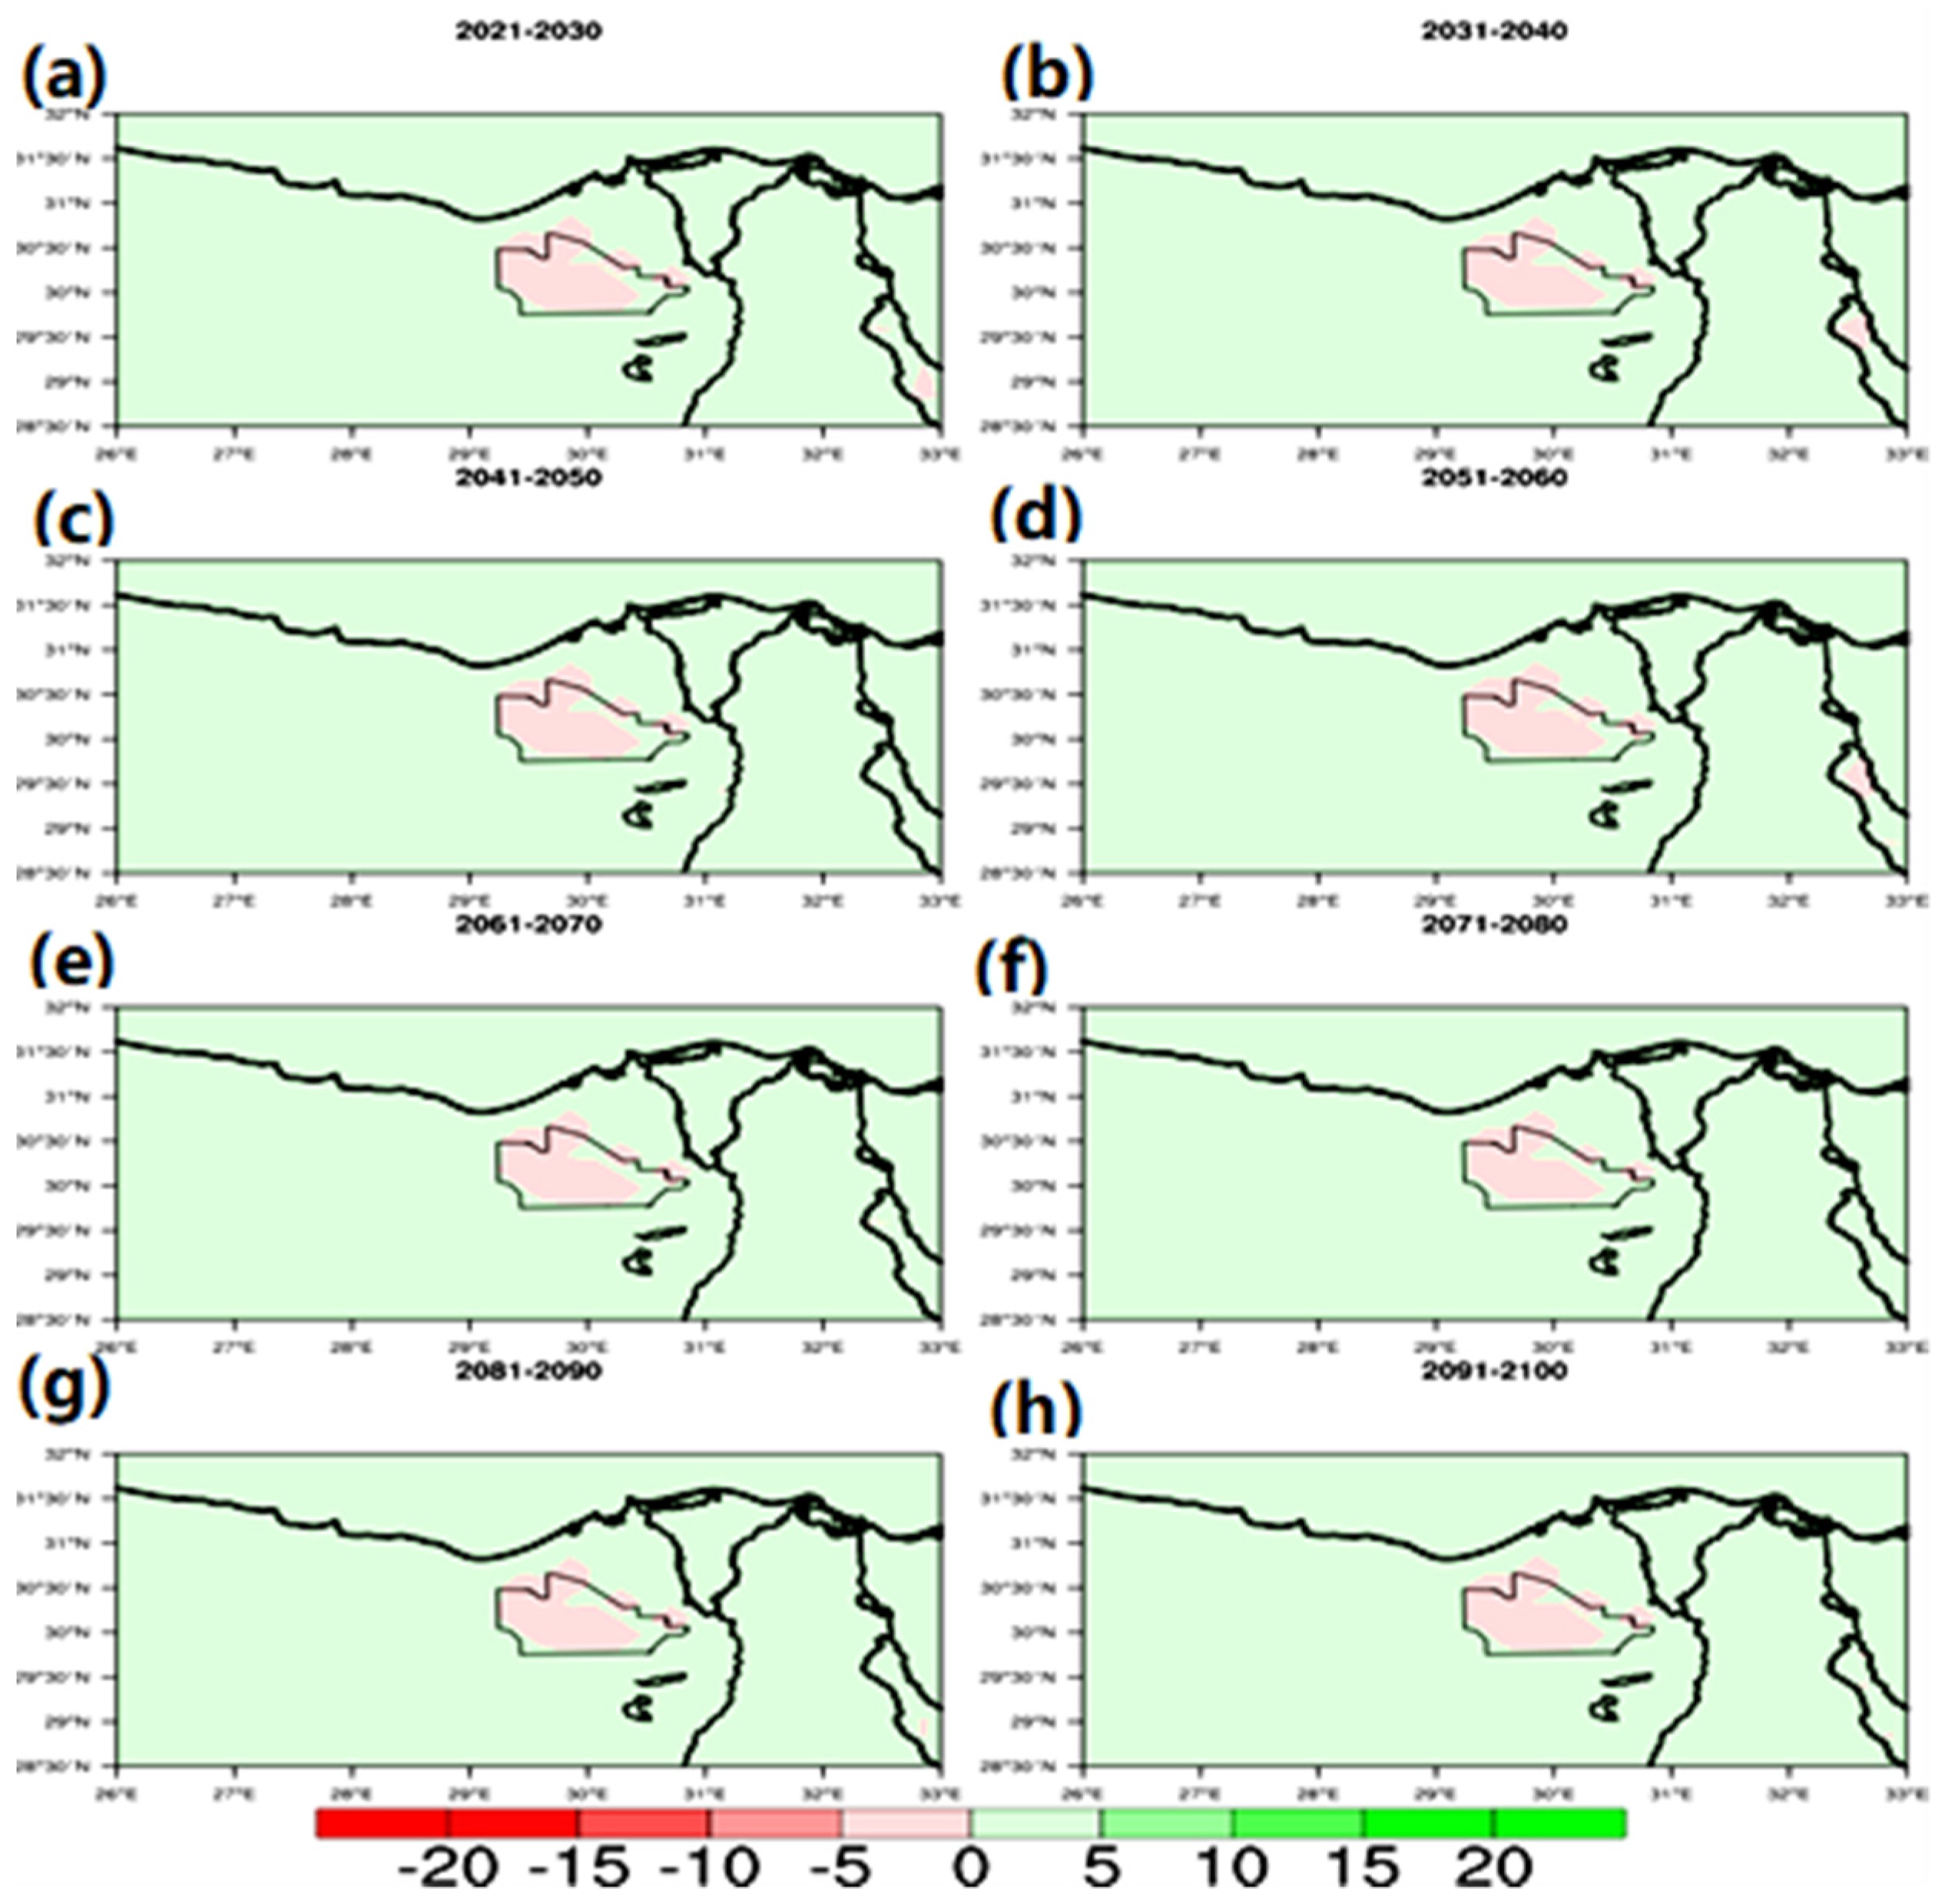
In Figure 5, it can be observed that EXPT induces a decrease in PET (relative to CTRL), but there is a stable decrease in PET during all periods of about ~5 mm month−1 in all time segments. Such decrease can attributed the fact that PET is a function of the mean air temperature [7]. Another reason is the decrease in the surface net radiation to drive the evapotranspiration process. It is important to highlight that there were no notable changes in the simulated total cloud cover and precipitation (not shown) suggesting that the convection process is insensitive to the land-use changes. These results are consistent with those of previous studies, which showed the direct effects of cropland are to enhance evapotranspiration and cool the surface temperature [8,9,10,11,12].

4. Discussion and Conclusions

Climate change has potential impacts on the agricultural activity (either positive or negative depending on the region of study). Additionally, crops/irrigated crops have shown considerable effects on temperature extremes with possible effects of warming reduction effects being employable as a mitigation strategy [5]. However, such effects have not been examined in Egypt (particularly the New Delta region). Therefore, the regional climate model (RegCM4) was used in the present study to examine the possible effects of the cropped area (in the New-Delta region) on the maximum and minimum air temperature, relative humidity and potential evapotranspiration. The RCP45 future scenario was considered in this study.
The results showed that the cropped area induces a net cooling effect. This cooling effect depends on the time segment of interest. As a result, a notable increase/decrease in relative humidity/potential evapotranspiration is noted. Further, there was no change in the simulated total cloud cover/total precipitation, suggesting that land-use changes cannot drive the convection process. Additionally, land-use changes control the surface energy balance (decrease in sensible heat flux and increase in evapotranspiration) leading to a decrease in Tmax/Tmin and an increase in RH. Further, it can be noted that land-use change only promotes localized changes with no possible remote effects.
Therefore, it can be observed that RegCM4 was a useful tool to explore possible changes associated with the cropped area on the surface climate and PET of the New Delta under the RCP4.5 future scenario. However, the irrigation effect [5] wasn’t considered in the present study. Additionally, the present study relied on using one lateral boundary condition (LBC), one regional climate model (RCM) and one future scenario. Therefore, a future study will consider the following points: (1) the inclusion of irrigation effects, (2) considering multiple LBCs to account for the uncertainty associated with the atmospheric forcing [7], (3) using multiple RCMs (e.g., WRF, COSMO, RCA4) to account for uncertainty of the physical parameterization and (4) considering other future scenarios (e.g., RCP8.5).

Author Contributions

Conceptualization, A.H.A.; methodology, Z.S.; software, A.H.A.; validation, S.A.A. and Z.S.; formal analysis, A.H.A., Z.S. and S.A.A.; investigation, A.H.A., Z.S. and S.A.A.; resources, A.S.Z.; data curation, A.H.A., Z.S. and S.A.A.; writing—original draft preparation, A.H.A. and S.A.A.; writing—review and editing, A.H.A. and S.A.A.; visualization, A.H.A. and Z.S.; supervision, A.S.Z.; project administration, A.S.Z. All authors have read and agreed to the published version of the manuscript.

Funding

No fund was received for this study.

Institutional Review Board Statement

Not applicable.

Informed Consent Statement

Not applicable.

Data Availability Statement

Not applicable.

Acknowledgments

This work was conducted as a part of the Interactive Map project of the Egyptian Meteorological Authority (EMA). EMA is acknowledged for providing the computational power for conducting the model simulations. The MPI-ESM-MR dataset was retrieved from http://www.clima-dods.ictp.it/RegCM4 (accessed on 15 November 2019).

Conflicts of Interest

The authors declare no conflict of interest.

References

  1. Bonan, G.B. Effects of land use on the climate of the United States. Clim. Chang. 1997, 37, 449–486. [Google Scholar] [CrossRef]
  2. Feddema, J.; Oleson, K.; Bonan, G.; Mearns, L.; Washington, W.; Meehl, G.; Nychka, D. A comparison of a GCM response to historical anthropo-genic land cover change and model sensitivity to uncertainty in present-day land cover representations. Clim. Dyn. 2005, 25, 581–609. [Google Scholar] [CrossRef]
  3. Snyder, P.K.; Foley, J.A.; Hitchman, M.H.; Delire, C. Analyzing the effects of complete tropical forest removal on the regional climate using a detailed three-dimensional energy budget: An application to Africa. J. Geophys. Res. 2004, 109. [Google Scholar] [CrossRef] [Green Version]
  4. Stocker, T.F.; Qin, D.; Plattner, G.-K.; Tignor, M.M.B.; Allen, S.K.; Boschung, J.; Nauels, A.; Xia, Y.; Bex, V.; Midgley, P.M. (Eds.) IPCC 2013: Climate Change 2013: The Physical Science Basis. Contribution of Working Group I to the Fifth Assessment Report of the Intergovernmental Panel on Climate Change; Cambridge University Press: Cambridge, UK; New York, NY, USA, 2013; p. 1535. [Google Scholar]
  5. Kala, J.; Hirsch, A.L. Could crop albedo modification reduce regional warming over Australia? Weather Clim. Extrem. 2020, 30, 100282. [Google Scholar] [CrossRef]
  6. Lu, Y.; Kueppers, L.M. Surface energy partitioning over four dominant vegetation types across the United States in a coupled regional climate model (WRF3 CLM3.5). J. Geophys. Res. Atmos. 2012, 117, D06111. [Google Scholar] [CrossRef] [Green Version]
  7. Anwar, S.A.; Salah, Z.; Khald, W.; Zakey, A.S. Projecting the Potential Evapotranspiration of Egypt Using a High-Resolution Regional Climate Model (RegCM4). Environ. Sci. Proc. 2022, 19, 43. [Google Scholar] [CrossRef]
  8. Alter, R.E.; Im, E.-S.; Eltahir, E.A.B. Rainfall consistently enhanced around the Gezira Scheme in East Africa due to irrigation. Nat. Geosci. 2015, 8, 763–767. [Google Scholar] [CrossRef]
  9. Im, E.-S.; Eltahir, E.A.B. Enhancement of rainfall and runoff upstream from irrigation location in a climate model of West Africa. Water Resour. Res. 2014, 50, 8651–8674. [Google Scholar] [CrossRef] [Green Version]
  10. Im, E.-S.; Marcella, M.P.; Eltahir, E.A.B. Impact of Potential Large-Scale Irrigation on the West African Monsoon and Its Dependence on Location of Irrigated Area. J. Clim. 2014, 27, 994–1009. [Google Scholar] [CrossRef]
  11. Kang, S.; Eltahir, E.A.B. North China Plain threatened by deadly heatwaves due to climate change and irrigation. Nat. Commun. 2018, 9, 2894. [Google Scholar] [CrossRef] [Green Version]
  12. Kang, S.; Eltahir, E.A. Impact of Irrigation on Regional Climate Over Eastern China. Geophys. Res. Lett. 2019, 46, 5499–5505. [Google Scholar] [CrossRef] [Green Version]
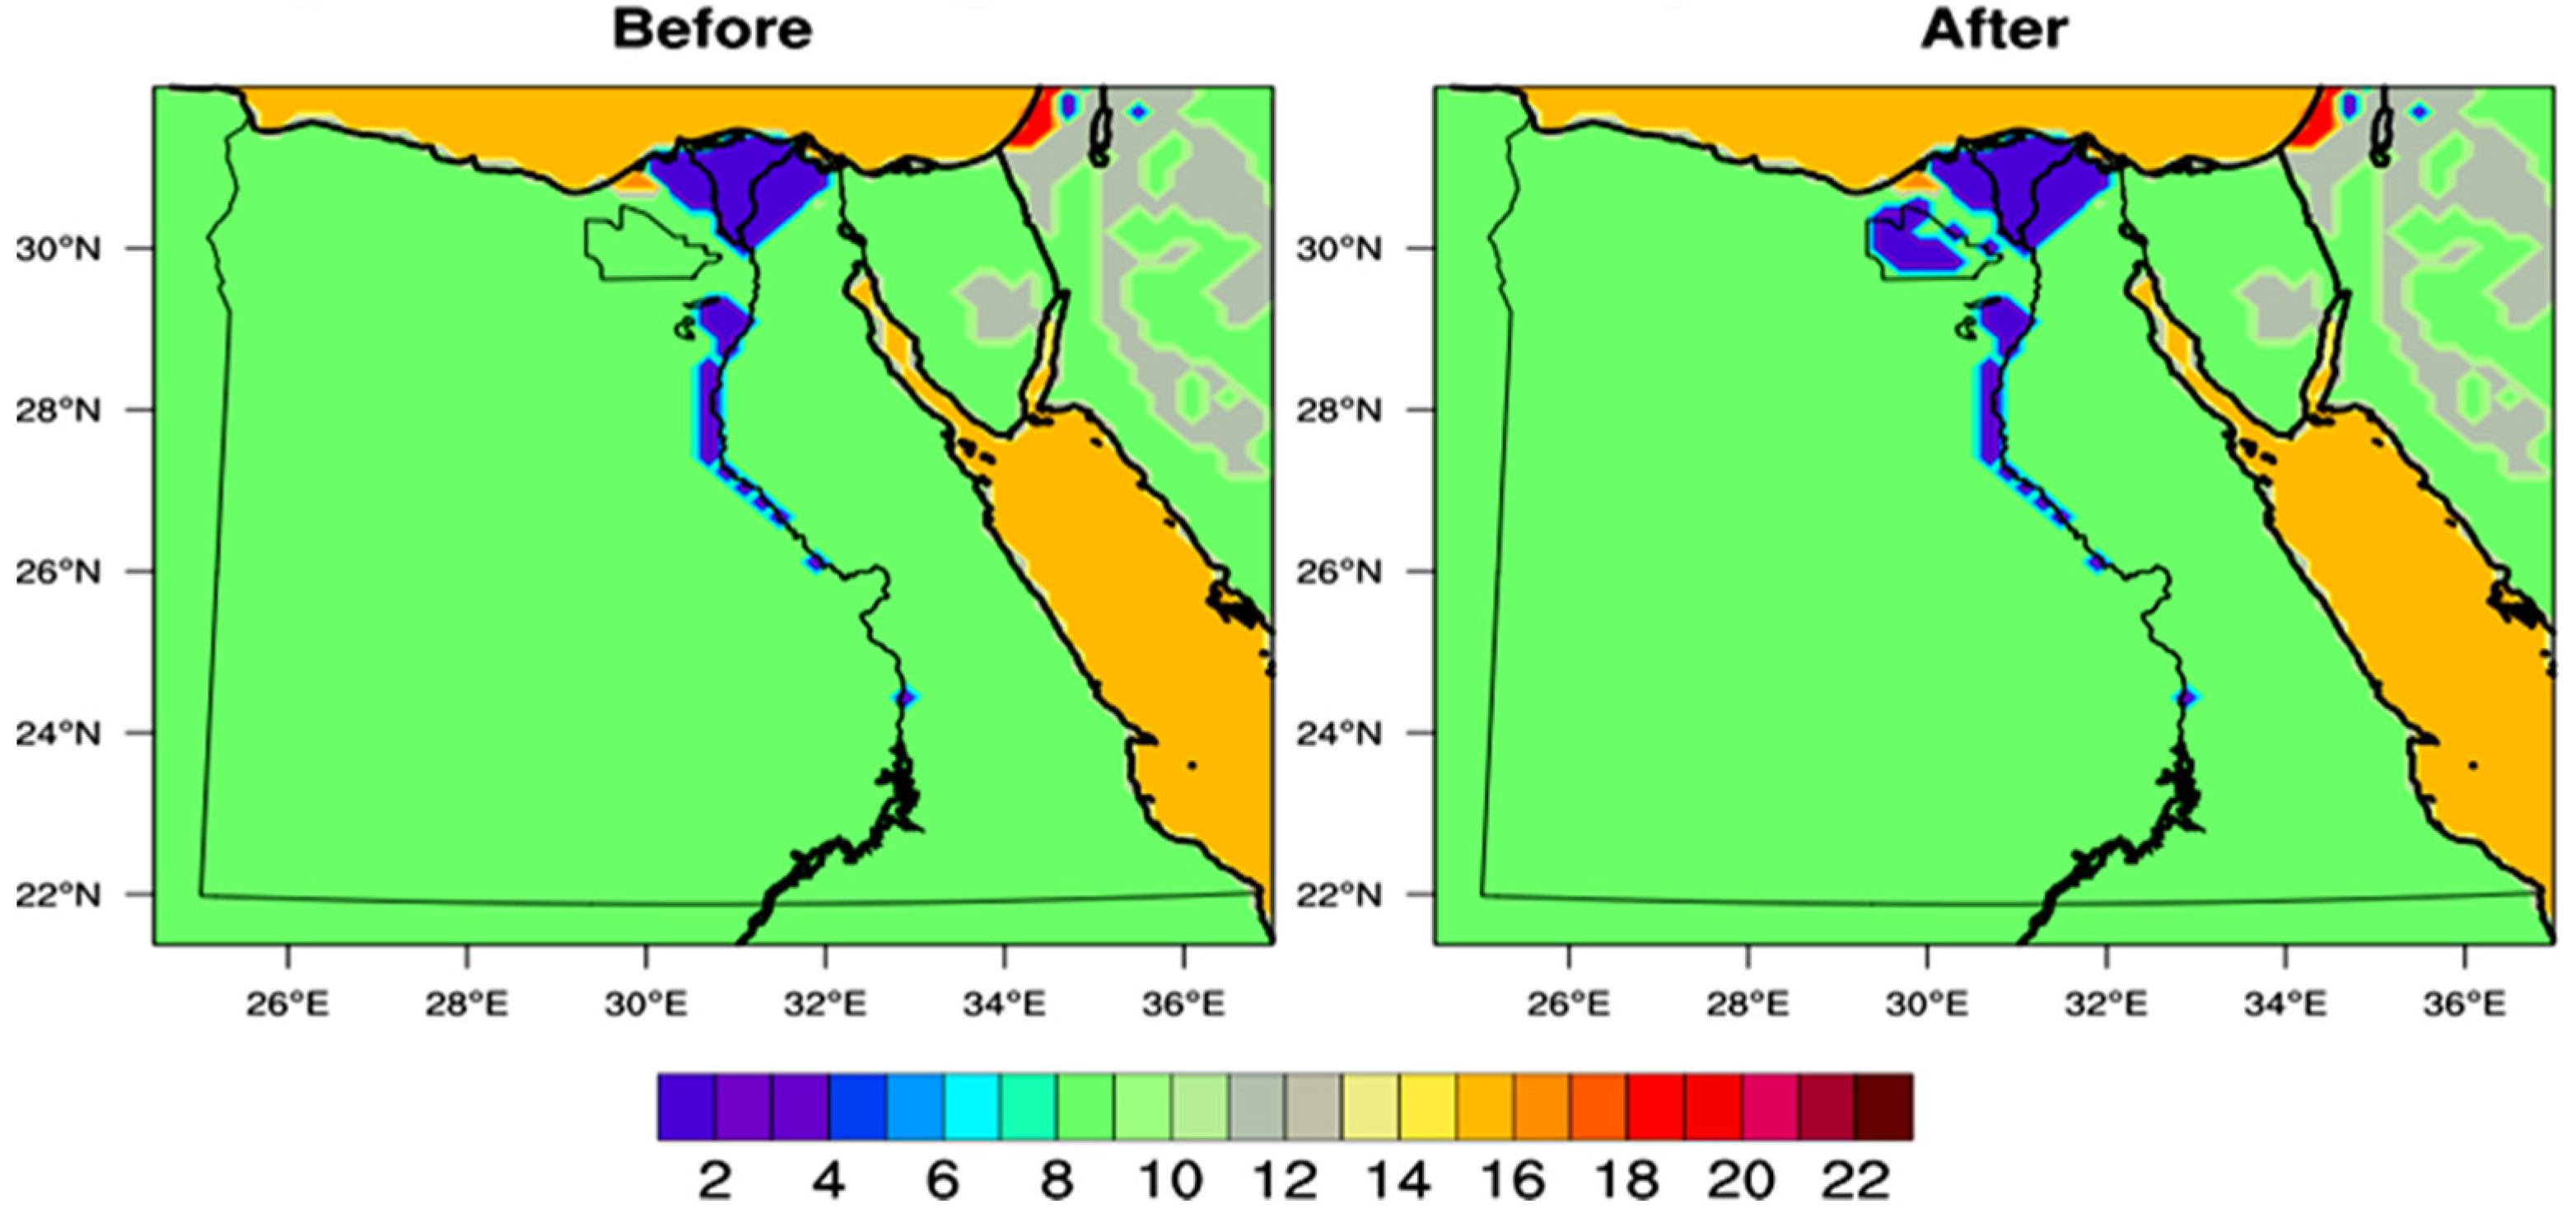
Figure 1. The figure shows the land-use changes of the New Delta region before (left panel) and after cropping (right panel).
Engproc 31 00043 g001
Figure 2. The figure shows the difference between RF and EXPT simulations for the maximum temperature (°C) in (MAM) season in different periods, (a) the period of 2021 to 2030, (b) the period of 2031 to 2040, (c) the period of 2041 to 2050, (d) the period of 2051 to 2060, (e) the period of 2061 to 2070, (f) the period of 2071 to 2080, (g) the period of 2081 to 2090 and (h) the period of 2091 to 2100.
Engproc 31 00043 g002
Figure 3. The figure shows the difference between RF and EXPT simulations for change in relative humidity (%) in the MAM season for the time segments: (a) 2021 to 2030, (b) 2031 to 2040, (c) 2041 to 2050, (d) 2051 to 2060, (e) 2061 to 2070, (f) 2071 to 2080, (g) 2081 to 2090 and (h) 2091 to 2100.
Engproc 31 00043 g003
Figure 4. The figure shows the difference between RF and EXPT simulations for the minimum temperature (°C) in the MAM season for the time segments: (a) 2021 to 2030, (b) 2031 to 2040, (c) 2041 to 2050, (d) 2051 to 2060, (e) 2061 to 2070, (f) 2071 to 2080, (g) 2081 to 2090 and (h) 2091 to 2100.
Engproc 31 00043 g004
Figure 5. The figure shows the difference between RF and EXPT simulations for change in PET (mm month−1) in the MAM season for the time segments: (a) 2021 to 2030, (b) 2031 to 2040, (c) 2041 to 2050, (d) 2051 to 2060, (e) 2061 to 2070, (f) 2071 to 2080, (g) 2081 to 2090 and (h) 2091 to 2100.
Engproc 31 00043 g005
Disclaimer/Publisher’s Note: The statements, opinions and data contained in all publications are solely those of the individual author(s) and contributor(s) and not of MDPI and/or the editor(s). MDPI and/or the editor(s) disclaim responsibility for any injury to people or property resulting from any ideas, methods, instructions or products referred to in the content.