Proceeding Paper

Large Landing Trajectory Dataset for Go-Around Analysis †

1
Centre for Aviation, Zurich University of Applied Sciences (ZHAW), 8401 Winterthur, Switzerland
2
SkAI Data Services, 8050 Zürich, Switzerland
3
Institute of Data Analysis and Process Design, Zurich University of Applied Sciences (ZHAW), 8401 Winterthur, Switzerland
*
Author to whom correspondence should be addressed.
Presented at the 10th OpenSky Symposium, Delft, Netherlands, 10–11 November 2022.
Eng. Proc. 2022, 28(1), 2; https://doi.org/10.3390/engproc2022028002
Published: 13 December 2022
(This article belongs to the Proceedings of The 10th OpenSky Symposium)

Abstract

:
The analysis and prediction of go-arounds, also referred to as missed approaches, is an active field of research due to the go-around’s impact on safety and the disruption of the traffic flow at airports. The advent of open-source aircraft trajectories available to researchers has increased the level of interest in the field. This paper introduces a publicly available dataset containing metadata of almost 9 million landings and 33,000 go-arounds. The dataset is based on observations from the OpenSky Network and includes data from 176 airports in 44 countries observed in the year 2019. After downloading the data, a go-around classification was performed and the quality was assessed. The usefulness of the dataset is illustrated with two novel example applications. The first example shows how the go-around rate for a runway can be modeled by using a quasi-binomial generalized linear model, while the second example compares the go-around rates for a number of airport–airline pairs. The introduced dataset is significantly larger than the data used so far in the analysis of go-arounds and provides the opportunity to develop novel use cases. This dataset frees researchers from having to collect and process large amounts of data and instead lets them focus on the analysis. The authors are convinced that this large dataset will stoke the creativity of the research community and facilitate interesting and novel applications.

1. Introduction

Go-arounds (GAs), also referred to as missed approaches, are standard flight procedures in which an aircraft interrupts its approach, climbs away, repositions, and then makes another approach to land. GAs are either initiated by pilots or air traffic controllers if a safe landing cannot be continued. Causes for GAs are numerous; they are either due to intrinsic reasons (e.g., unstable approaches [1,2], approaches flown “too fast, too low, and too close” [3,4]), extrinsic reasons (e.g., runway occupied by preceding arrival or departure, airport surface operations, etc. [5]), or meteorological reasons (e.g., limited visibility, strong crosswinds and tailwinds, etc. [6,7]). The scientific literature on GAs can be divided into four parts, which deal with (i) the detection of GA events based on aircraft trajectory data, (ii) the prediction of GAs, (iii) the study and optimization of air traffic management issues in case of GAs, and (iv) the investigation of safety-related aspects in case of GAs.
Historically, studies dealing with the detection of GAs were heavily reliant on the availability of trajectory data gathered by radar systems operated by air navigation service providers. For this reason, access to such data was limited. The advent of open-source automatic dependent surveillance-broadcast (ADS-B) and mode-S data, for instance, sourced through the OpenSky Network [8], has increased the interest of the scientific community in the subject. Based on the trajectory data of landing aircraft, GAs are usually detected and labeled with the help of rule-based algorithms [5,6,7,9,10,11]. For this purpose, trajectories are analyzed with a predefined set of rules, which, for instance, check whether an increase in altitude or a change in heading above a threshold value occurred during the approach, or whether an aircraft left a pre-determined approach corridor.
Prediction methods usually estimate the probability of a GA occurring. In this context, both microscopic and macroscopic prediction approaches are mentioned in the literature. Microscopic methods allow the estimation of the probability of a GA at the level of individual flights. To this end, the microscopic models presented in the literature use a variety of inputs, such as the estimated energy level and localization performance of the approaching aircraft, the in-trail relationship of the approaching aircraft to other traffic currently being in the approach, information regarding the current state of the runway, data describing the prevailing weather conditions, etc. For an analysis of causal factors for GAs, conducted for the example of New York JFK airport, the reader is referred to Dai et al. [12]. Regarding microscopic GA prediction models, Figuet et al. [9] applied a number of machine learning methods to predict the probability of a GA at Zurich Airport with open-source data from OpenSky Network. In Dhief et al. [13], the authors introduced a microscopic GA-prediction model based on the CatBoost and XGBoost algorithms for the airports of Philadelphia and Van Nuys with impressive accuracy. Besides that, Dai et al. [14] presented a microscopic model based on an input–output hidden Markov model that enables the prediction of GAs for flights approaching New York’s JFK airport, while Puranik et al. [15] (p. 16) proposed a supervised machine learning model based on a random forest model, which can be used to make a “well-informed, safe go-around or landing decision”. Macroscopic models, on the other hand, enable the determination of the probability of GAs aggregated to the aerodrome level. In this regard, Gariel et al. [5] compared the statistical properties of nominal landings and GAs in order to determine the factors that contribute to the GA rate of an airport the most. In Figuet et al. [9], the authors suggested a generalized additive model to predict the GA rate at Zurich Airport within the next hour by considering weather-related factors, traffic density information, aircraft and airline mix, etc. Moreover, Chou et al. [16] investigated which supervised machine learning model can best estimate the GA rate for Denver Airport if the models are provided with information regarding the prevailing weather conditions, observed traffic density, and attributes of aircraft using the airport. By comparing 18 different machine learning models, the authors concluded that the best results can be achieved with the CatBoost algorithm.
Regarding the study and optimization of air traffic management issues in the case of GA events, the literature considers and evaluates, for instance, the additional fuel consumption and emissions in case of missed approaches [17], or the optimization of runway capacity by optimally re-injecting aircraft performing a GA into the approach flow [18,19].
In terms of the investigation of safety-related aspects, Campbell et al. [4,20] determined a set of operationally relevant criteria for the initiation of GAs that enables flight crews to perform missed approaches as safely as possible. Moreover, Ross and Tomko [21] examined incident reports from the Aviation Safety Reporting System in terms of human factor-related contributions to unstabilized approaches. In this context, the results somewhat counter-intuitively suggest that unstable approaches often end in landings and not in GAs. In de Voogt et al. [22], the authors compared accident reports in order to determine how the training of flight crews and advances in technology affect the accident rate in general and the rate of accidents caused by GAs in particular. While technical and procedural improvements have positively influenced the accident rate in general, this causality could not be established for accidents caused by GAs. Finally, Krauth et al. [23] presented a method based on multivariate density models, which can be used to artificially generate trajectories of aircraft flying GAs at Zurich airport. Among other applications, such artificially generated trajectories can be used for risk assessments with collision risk models, which are often based on Monte Carlo simulations.
The literature studies on GAs are diverse and growing in volume. However, based on the literature presented above, we observe that research on the analysis and modeling of GAs has, so far, focused on individual airports, and/or the studies are often based on relatively limited amounts of data (in terms of the number of GAs considered). It is further noticeable that researchers had to devote time and effort to identify GA events in the first step, even if the main focus of the study was on a different topic. This paper attempts to mitigate these limitations of previous studies by publishing a dataset of events containing both landings and GAs at much larger scales. Subsequently, the dataset not only provides researchers with accessible sources of data, it also relieves them from having to classify landings themselves and lets them focus on the topic of their work.
The remainder of this paper is structured as follows: Section 2 describes the dataset and how it was developed, while Section 3 provides two novel example applications for this dataset. Finally, Section 4 contains conclusions and an outlook on possible future work.

2. Dataset

2.1. Description

This paper introduces a dataset containing the metadata of landing aircraft for 176 (mostly) large airports located in 44 countries. Since some airports have multiple runways, this resulted in 758 airport–runway pairs. In total, almost 9 million landings (including more than 33,000 GAs) that have occurred in the year 2019 are included in this dataset. Figure 1 shows the proportion of collected landings for different continents, countries, and airports.
As can be seen from the figure, the dataset is heavily biased toward airports located in North America and Europe, with significantly fewer landings in the other regions. This imbalance is mainly due to the better coverage of the OpenSky Network in these regions.
Each landing is represented by one row in the dataset and contains the respective metadata, including if a GA was performed. The columns of the dataset are shown in Table 1.
A sample from the dataset consisting of three landings is shown in Table 2.
This sample illustrates three different patterns typically found in the data. The first row with the call sign KLM88J is a simple landing with no GA, while the other two rows are landings with GAs. The second row, with the call sign BAW957L, is a flight where the aircraft performed one GA and landed on the same runway as the one originally approached. Finally, the third row, a flight with the call sign GODB, appears to be more exotic. Apparently, this flight performed a total of six approaches and approached two different runways. The data about the number of approaches and the number of approached runways are helpful to exclude calibration and training flights.

2.2. Dataset Processing

By using the historical database of OpenSky Network [8], all landings for the year 2019 were downloaded for each airport in the dataset. Specifically, the state_vectors_data4 was downloaded for trajectories where the destination airport in flights_data4 is to be included in the dataset. For each airport, the runway approached by each landing attempt was identified using the python Traffic library [24]. To identify which runway was used, the traffic library relies on an airport database, containing the location and bearing of each runway, and retrieves the portions of the flight that are aligned with a runway. Additionally, each trajectory was analyzed individually and classified as a GA or not a GA. To detect if a landing involved a GA, the algorithm implemented in [24] was slightly modified to increase robustness. The algorithm does the following:
  • Assigns each portion of the trajectory to a flight phase by using the machine learning based algorithms introduced by Sun et al. [25].
  • Identifies the portion of the trajectory that is aligned with a runway of the airport.
  • Classifies the trajectory as having a GA if two distinct portions that are aligned with a runway are separated by one climb phase.

2.3. Dataset Quality

In order to assess the quality of the dataset, a manual inspection of each airport–runway pair was conducted. For each airport–runway pair, 8 batches of 500 randomly selected trajectories (or as many as available, if fewer than 4000 trajectories were observed) classified as not having a GA were plotted. From this sample, the number of false positive GA was estimated for the given airport–runway pair. Similarly, up to 8 batches of 10 random landings classified as GA were plotted to estimate the number of false positive GAs. Additionally, the rate of misclassified runways, i.e., assigning the wrong runway to a landing, was estimated from the sample. As a consequence, 54 airport–runway pairs were manually dropped from the dataset because the data quality was deemed to be insufficient. Note that flights for which no ICAO-type code could be assigned were dropped from the quality assessment to avoid cluttering.
Overall, the quality of the classification of the runways and the GA is satisfying. The manual screening of the data showed that the quality of the classification into GA/not GA and the assignment of the runway, unsurprisingly, are strongly dependent both on the quality of the trajectories and the coverage. Airports with no parallel runways rarely have issues with wrongly assigned runways. However, for airports with parallel runways, the quality can vary. Note that the GA detection seems to be biased and yields more false negatives than false positives. In other words, the quality check suggests that the GA rate is generally underestimated. The GA detection algorithm sometimes fails to detect GAs either (i) if GAs are initialized early on the approach and have no or only a short climb phase, (ii) if GAs have a very tight turn radius and only a short leg on the final approach (as usually performed by small general aviation aircraft), or (iii) if GAs directly divert to other airports.
The estimated false positive and false negative rates for each airport–runway pair are available with the dataset. This allows the users of the dataset to check the estimated quality of a given airport–runway pair. The repository also contains all the plots that were used for the quality assessment.

2.4. Dataset Availability

The dataset described in this paper is available at Monstein et al. [26]. In addition to the minimal dataset described in Table 1 and Table 2, an augmented dataset providing additional information is published. This dataset contains, amongst others, the aircraft registration and type code, region and country of the airport and the operator, instrument landing system (ILS) glide slope angle, if the approached runway is intersected by another runway, and meteorological information (METAR). The interested reader is referred to the full description of the augmented dataset published in [26].
Users with access to OpenSky Network’s historical database can use the metadata provided in the dataset to download the complete trajectories. An example of how this could be done can be found in the repository of the dataset.

3. Example Applications

In this section, two example applications, which illustrate how the GA dataset introduced in this paper could be used, are presented. The aim of these example applications is to demonstrate the benefits of the dataset. To this end, Section 3.1, gives a brief overview of how the GA rate (or probability of GA) for an airport–runway pair can be predicted, while Section 3.2 focuses on the comparison of GA rates between different airports and operators. Since the presented examples are only brief, the interested reader is referred to the relevant literature for more details.

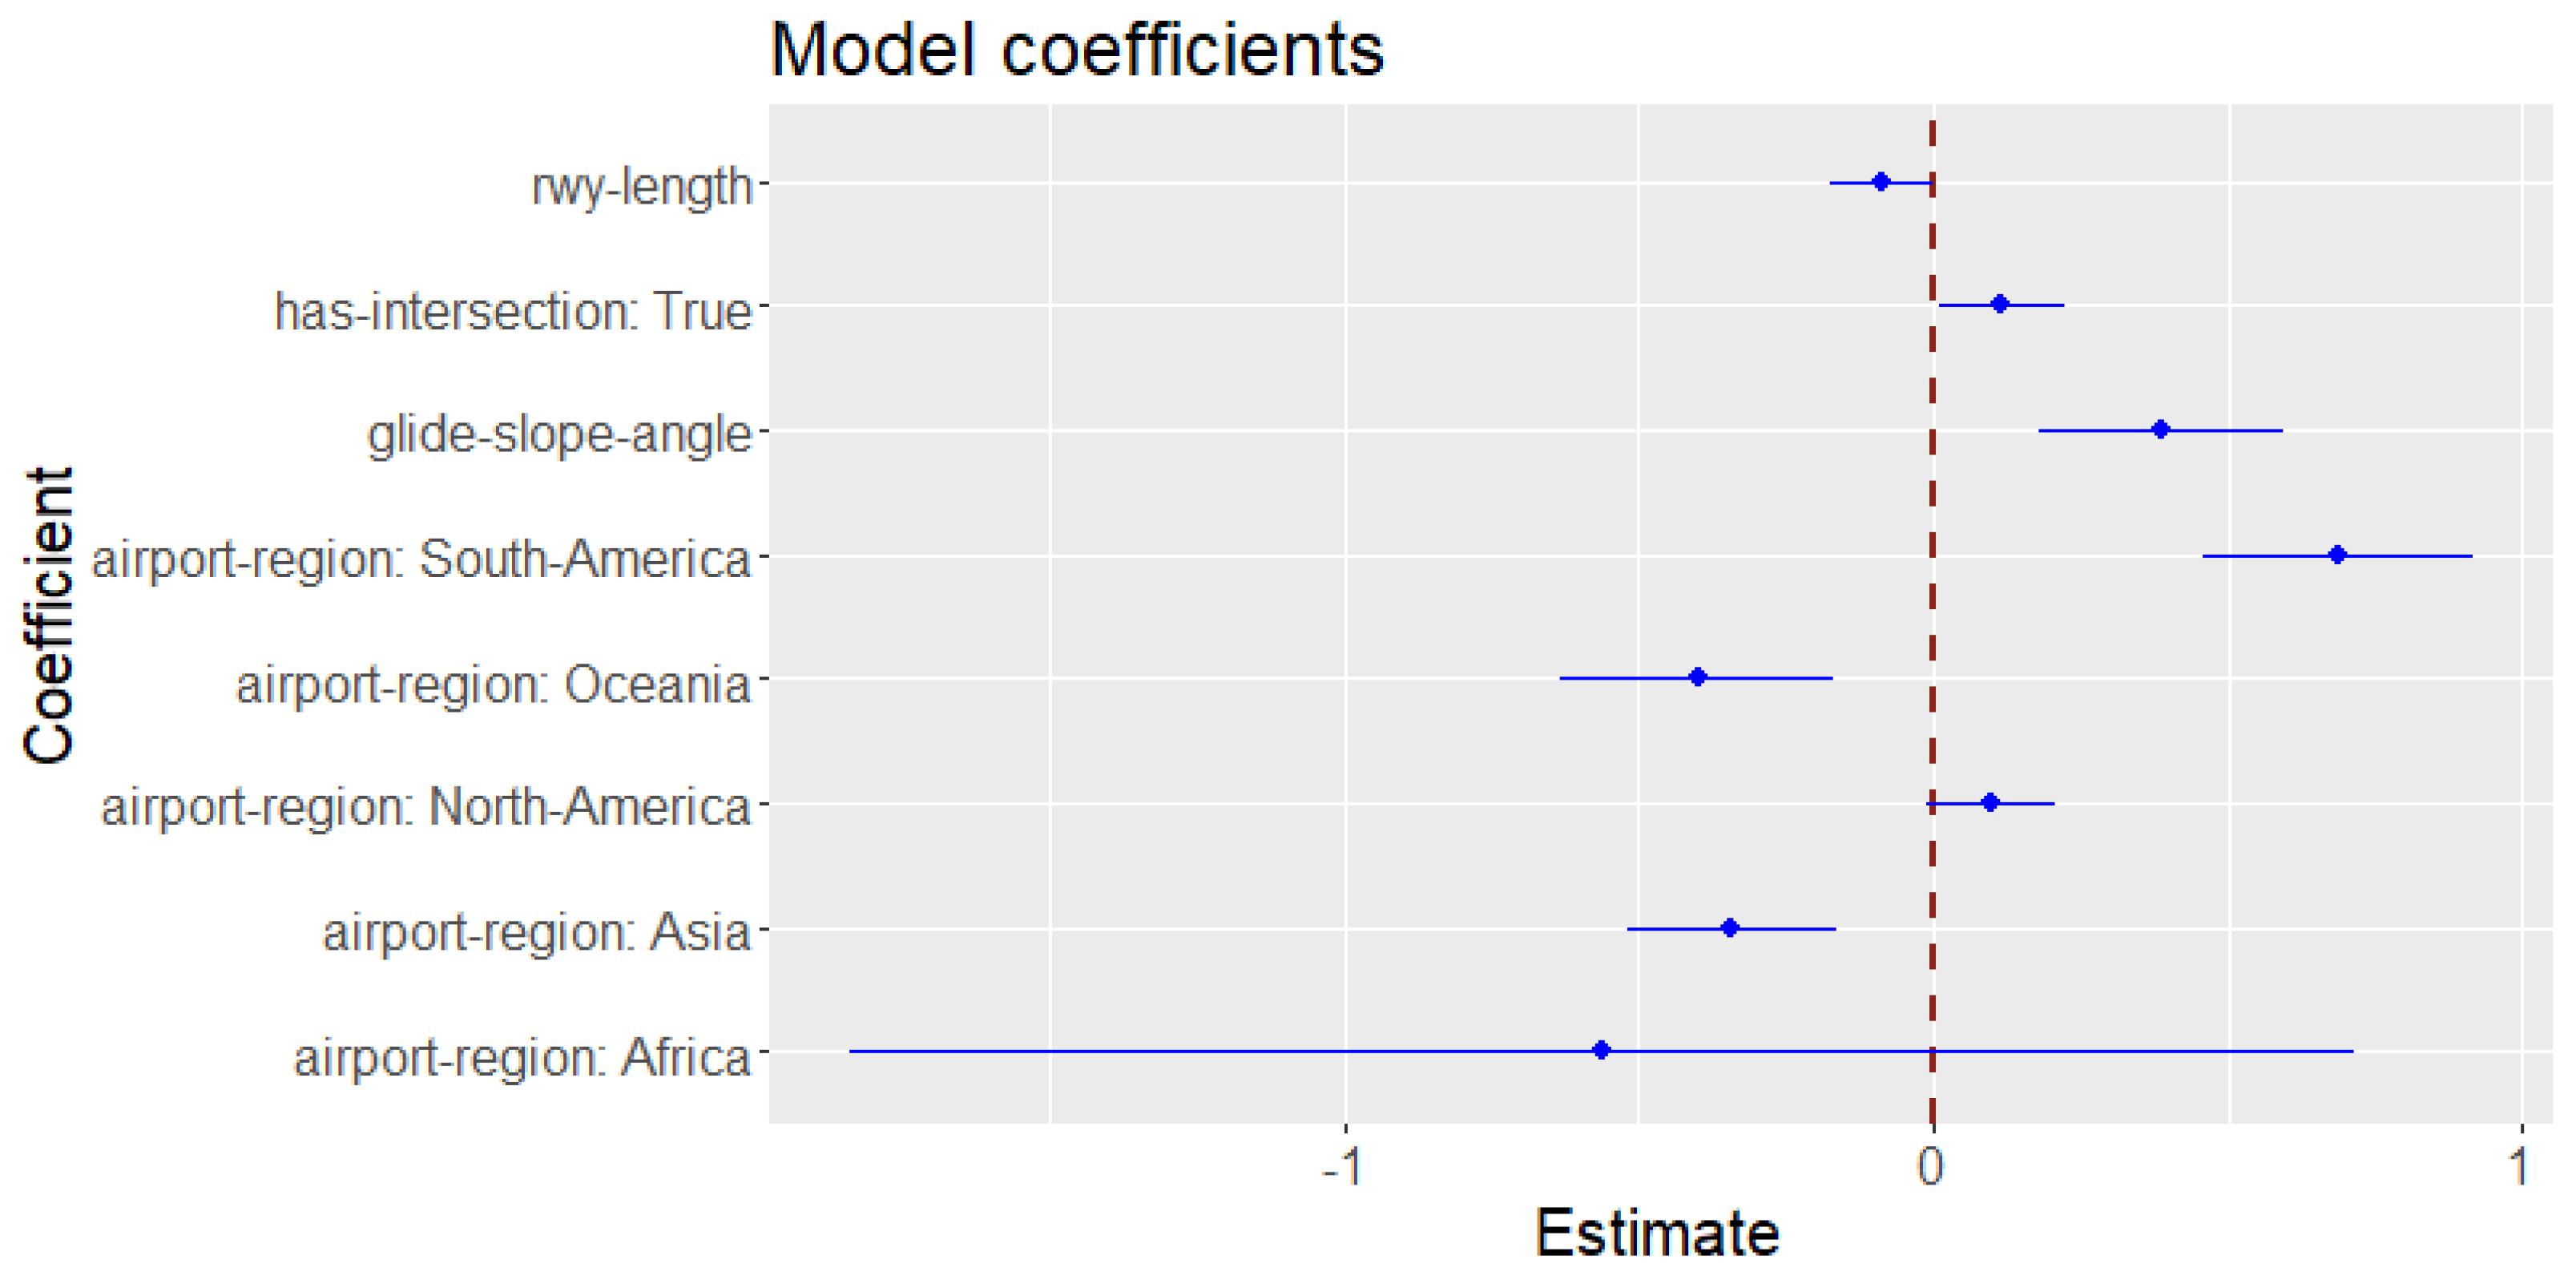
3.1. GA Probability Prediction for Airport–Runway Pairs

The dataset presented in this paper was born out of a project the authors were working on. The problem at the time was to estimate the GA rate at an airport with a non-standard ILS glide slope angle for which insufficient observations were available. The solution to that problem was to develop a regression model to predict the GA rate based on observations in other places.
Before the regression model could be developed, the GA rate needed to be computed from the data described in Section 2. To that end, the observations were aggregated by airport–runway pairs and the total number of landings and GAs were computed. The airport–runway pairs with less than 500 observed landings or no observed GAs were excluded from the model. At some airports, small general aviation aircraft perform numerous GAs for training purposes. To exclude these flights from the analysis, all trajectories (other than from the turbojet and turboprop fixed-wing aircraft) were removed. Additional features for the regression model, such as the runway length and the ILS glide slope angle, were added to the aggregated data. The resulting dataset, which consists of 426 observations, contains the features shown in Table 3.
The authors were interested in predicting the GA rate for an airport–runway pair. The GA rate is usually expressed as the number of GAs per 1000 landings. This GA rate is equal to the probability of a GA p multiplied by 1000, i.e., GA rate = p · 1000 . The regression model used for this application is the quasi-binomial generalized linear model (GLM), which relates the features in Table 3 with probability p. The quasi-binomial GLM does not model the probability directly. Instead, the prediction of the model is the log odd of p, which is also known as the logit transform of p (e.g., see [27]). Such a GLM can be expressed as
log p 1 p = β 0 + β 1 x 1 + β 2 x 2 + + β k x k
with β 0 , β 1 , , β k being the model coefficients to be estimated, and x 1 , x 2 , , x k being the features, i.e., covariates, of the model.
The GLM with the features described in Table 3 was fitted to the aggregated data. The results of the fitted model are summarised in Table 4 and illustrated in Figure 2. Note that the baseline refers to an airport with no intersecting runway which is located in Europe.
This simple GLM provides some interesting insights into the drivers of the GA rates at different airport–runway pairs. For example, the model identified significant differences between most of the geographical regions and the baseline in Europe. It also offers an answer to the original question of how the ILS glide slope angle affects the GA rate. The coefficient for the glide_slope_angle in Table 4 appears to be significant (small p-value) and positive, implying that an increase in the glide slope angle increases the probability of a GA. This effect is best illustrated by an example. Assume an airport–runway pair has a GA rate of 3 per 1000 landings ( p 1 = 0.003 ). Following Equation (1), the log odds of a GA is
η 1 = log p 1 1 p 1 = log 0.003 1 0.003 = 5.81 .
If the glide slope angle was increased by one degree, all else being equal, the new log odds would be η 2 = η 1 + 0.39 = 5.42 . Subsequently, the resulting probability p 2 can be calculated by computing the inverse log odds of η 2
p 2 = e η 2 1 + e η 2 = 0.0044 .
The model predicts that the probability, and GA rate, will increase by p 2 / p 1 = 47 % if the glide slope angle was increased by one degree.
This simple model illustrates the power of the proposed dataset since it allows modeling across multiple airports and runways. It is reasonable to assume that important effects are missing from this simple model. Nevertheless, it shows the benefits of the dataset for researchers interested in exploring the differences between airports.

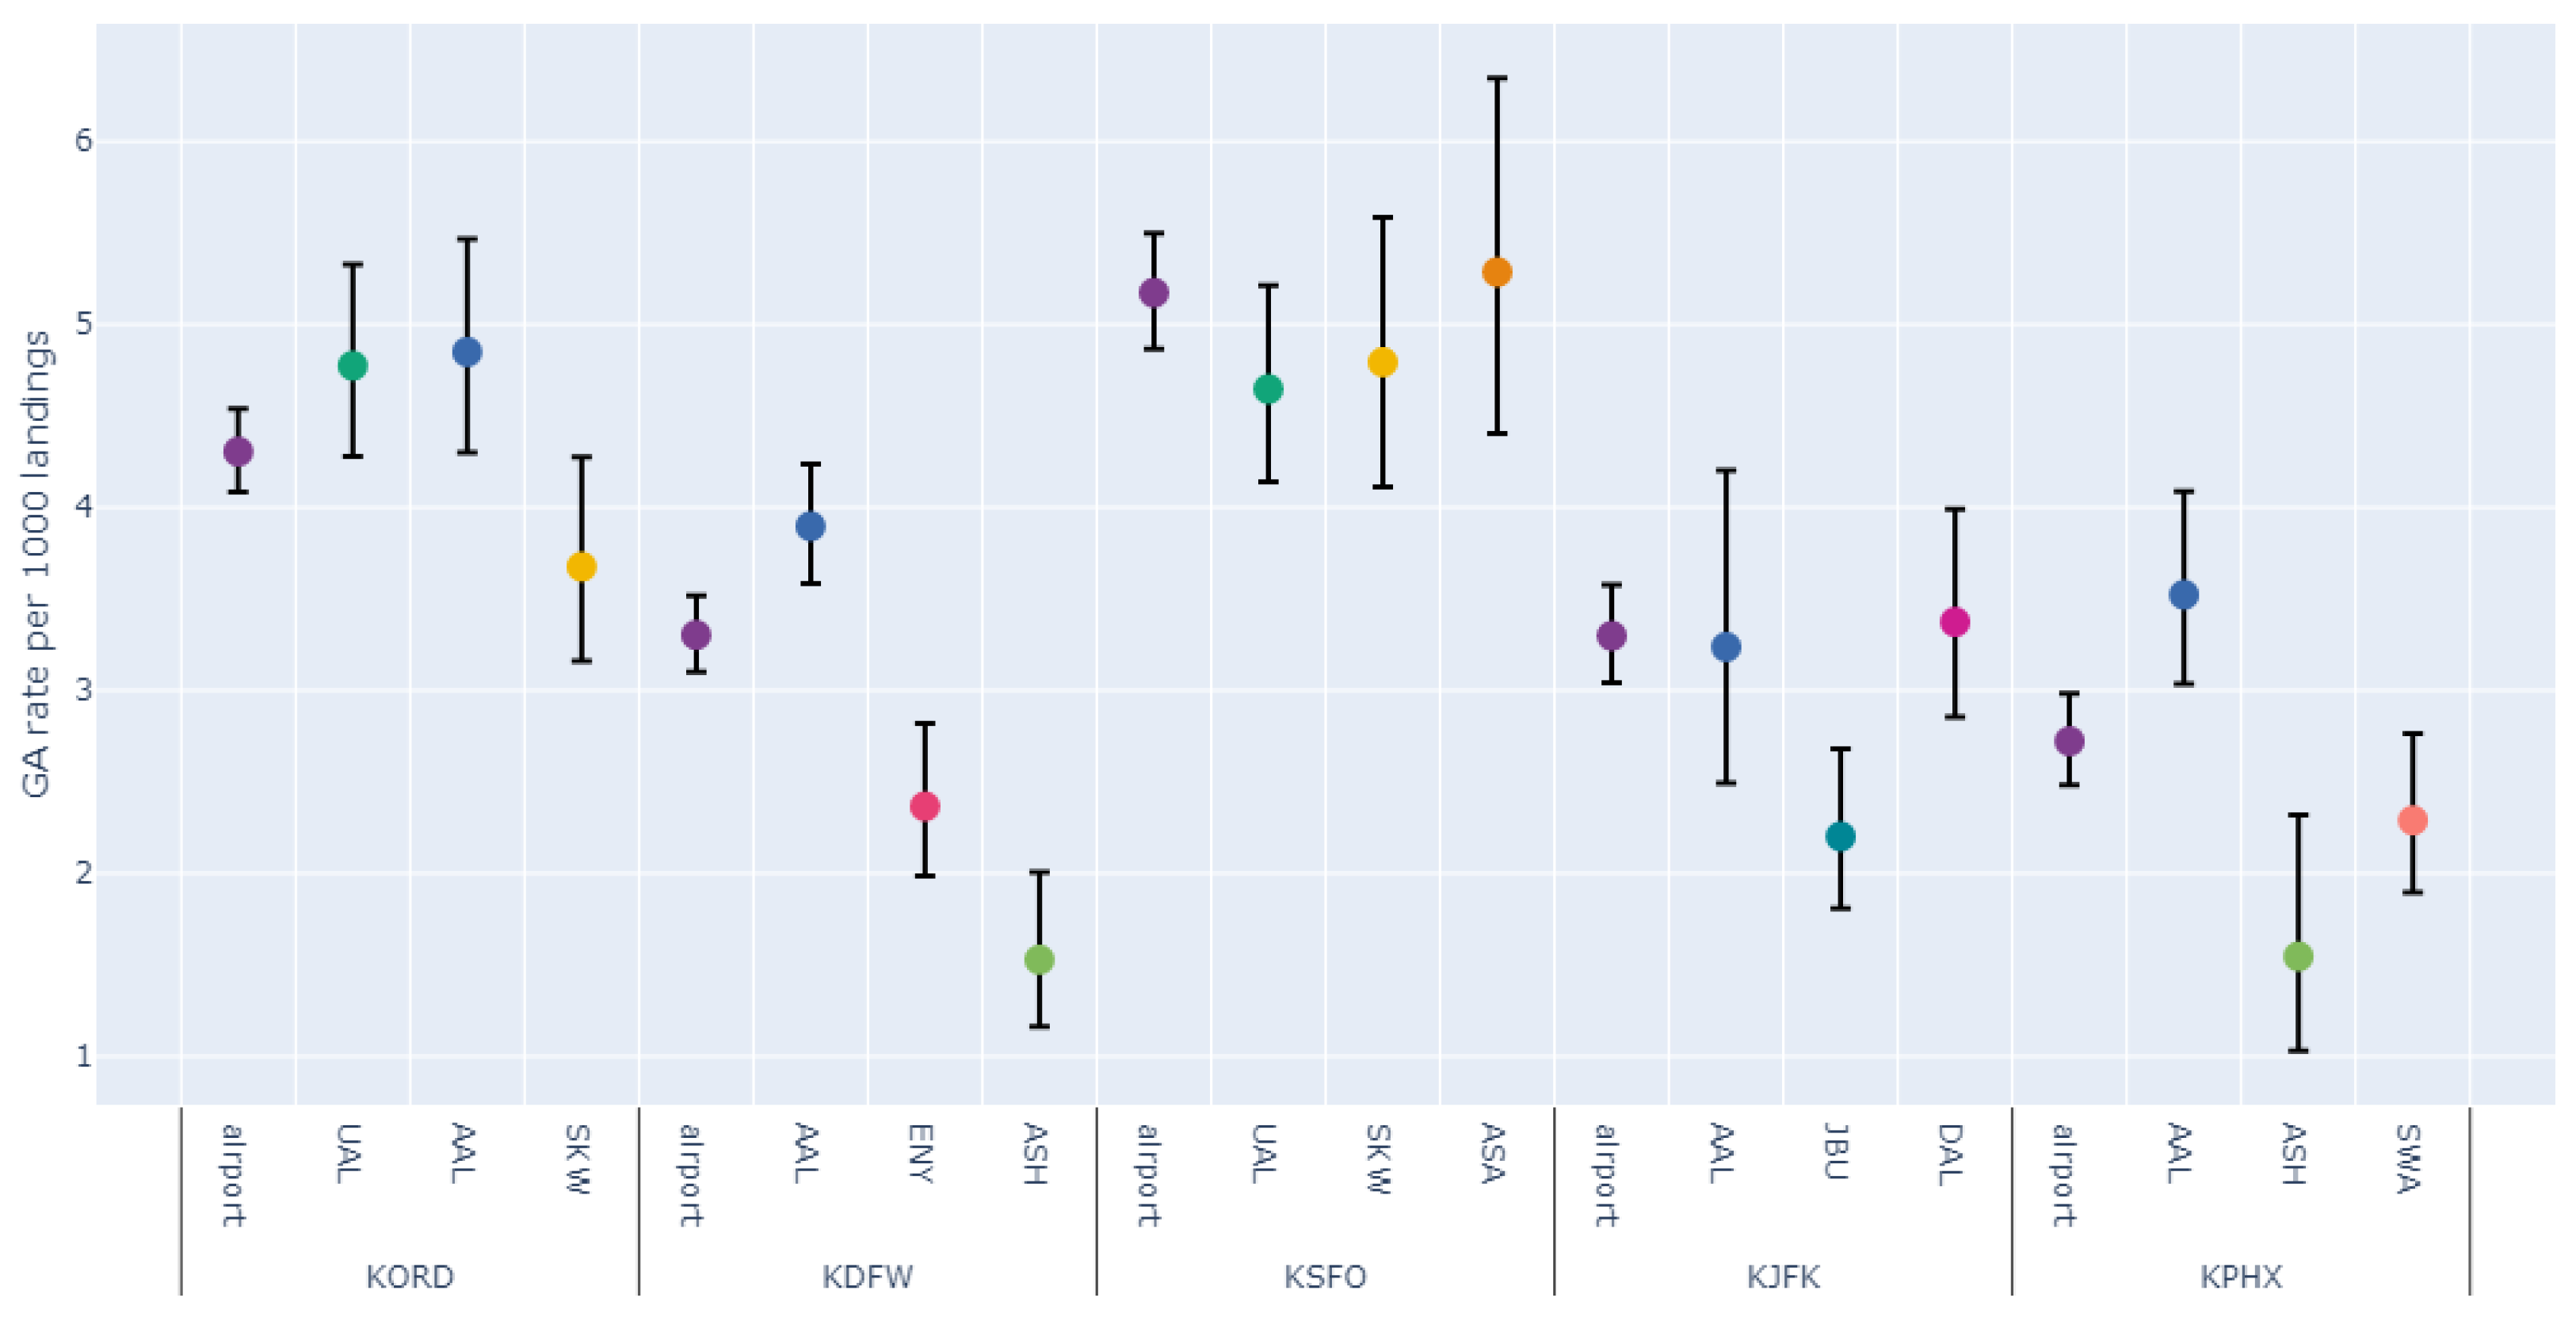
3.2. Comparing GA Rates between Operators

For the second example application, the GA rates between operators, i.e., airlines, are compared. In the first step, the GA rates at the top five US American airports, measured by the number of landings in the dataset, were computed. Subsequently, for each of these airports, the corresponding top three operators at these airports were determined. The GA rates of the resulting airport–airline pairs are shown in Figure 3. The black bars indicate the Wilson score confidence intervals of the estimate of the GA rate with a confidence level of 95% ([28]).
The results in Figure 3 show interesting differences between operators. For example, at John F. Kennedy International Airport (KJFK) in New York, the three operators with the most observations are American Airlines (AAL), JetBlue Airways (JBU), and Delta Air Lines (DAL). Each of these operators is a local hub carrier and, in effect, each has its own terminal. While AAL and DAL have a similar GA rate, JBU has a significantly lower rate. It might be interesting for the relevant stakeholders, such as operators, the airport, and the air navigation service provider, to notice and analyze the differences in GA rates. From a safety perspective, it might indicate that some operators are taking more risks and are performing fewer GAs than might be appropriate. From an economic perspective, it might indicate that some operators are performing more GAs for operational reasons. If there are ways to mitigate these reasons, the GA rate could possibly be reduced, which would have positive effects on the costs, delays, and interruptions of the traffic flow.
Comparing operators over different airports can also be interesting. For example, it seems that AAL has a higher GA rate than the baseline in most of the airports shown in Figure 3. Such insight could help operators optimize operations. Moreover, the presented dataset is attractive for airports. For example, the GA rate at the Dallas Fort Worth International Airport (KDFW) shows, compared to other airports, a larger variation between the different operators. Understanding the reasons for this variation might help to develop mitigation measures to both reduce the GA rate and increase the level of safety.

4. Conclusions

The proposed dataset, with its metadata of more than 33,000 GAs and almost 9 million landings, is freely available and significantly larger than any dataset mentioned in the literature so far. Since the detection of GAs has already been performed, researchers can directly focus on the analysis of the data, instead of spending time on large-scale data processing.
While the quality of the GA detection is sufficient, it could still be improved. This is the case, in particular, for GAs initiated early on in the approach, GAs with a small radius, and GAs diverting to other airports. A more robust detection algorithm might remove the bias in the data, i.e, the underestimation of the GA rate. Nevertheless, the GA detection is adequate for numerous applications and the user of the dataset is free to remove observations based on the estimated false positive and false negative rates provided with the data.
The two example applications illustrated the benefits of the dataset. The first example, modeling the GA rate of a runway, can be useful to predict the GA rate for runways where insufficient observations are available. The second example, the comparison of operators at different airports, showed the variation of the GA rates, both between operators and airports. These kinds of analyses are novel and could not have been performed with the previously available datasets.
We believe that our dataset can be of great use to other researchers working on the topic of GAs. This might be in the form of allowing more robust, airport-independent models, or by studying GAs across different airports. Moreover, we are convinced that, given the creativity of the research community, new and interesting applications for this dataset will be found.

Author Contributions

Conceptualization, B.F. and R.M.; methodology, B.F. and R.M.; validation, T.K. and M.D.; formal analysis, R.M., T.K. and M.D.; investigation, B.F.; data curation, B.F. and R.M.; writing—original draft preparation, R.M.; writing—review and editing, R.M., B.F., T.K., M.W. and M.D.; visualization, B.F. and R.M.; project administration, M.W.; funding acquisition, M.W. All authors have read and agreed to the published version of the manuscript.

Funding

This research was funded by the Swiss Federal Office of Civil Aviation grant number SFLV 2018-037.

Institutional Review Board Statement

Not applicable.

Informed Consent Statement

Not applicable.

Data Availability Statement

The data presented in this study are openly available in Zenodo at https://doi.org/10.5281/zenodo.7148117, [26] (accessed on 1 November 2022).

Conflicts of Interest

The authors declare no conflict of interest.

References

  1. Coker, M. Why and When to Perform a Go-around Maneuver. Available online: https://www.smartcockpit.com/docs/why-and-when-to-perform-a-go-around-maneuver.pdf (accessed on 2 November 2022).
  2. Civil Air Navigation Services Organisation. Unstable Approaches: Air Traffic Control Considerations. Available online: https://www.icao.int/APAC/RASG/eDocs/Guidance%20material%20on%20Unstablished%20Approach.pdf (accessed on 2 November 2022).
  3. Gluck, J.; Tyagi, A.; Grushin, A.; Miller, D.; Voronin, S.; Nanda, J.; Oza, N. Too fast, too low, and too close: Improved real time safety assurance of the national airspace using long short term memory. In AIAA Scitech 2019 Forum, San Diego, CA, USA, 7–11 January 2019; American Institute of Aeronautics and Astronautics: Reston, VA, USA, 2019. [Google Scholar] [CrossRef]
  4. Campbell, A.M.; Zaal, P.M.T.; Shah, S.R.; Schroeder, J.A. Go-around criteria refinement for transport category aircraft. J. Air Transp. 2022, 30, 3–22. [Google Scholar] [CrossRef]
  5. Gariel, M.; Spieser, K.; Frazzoli, E. On the statistics and predictability of go-arounds. arXiv Prepr. 2011, arXiv:1102.1502. [Google Scholar]
  6. Proud, S.R. Go-around detection using crowd-sourced ADS-B position data. Aerospace 2020, 7, 16. [Google Scholar] [CrossRef] [Green Version]
  7. Donavalli, B.; Mattingly, S.P.; Massidda, A. Impact of weather factors on go-around frequency. In Proceedings of the Transportation Research Board 96th Annual Meeting, Washington, DC, USA, 8–12 January 2017. [Google Scholar]
  8. Schäfer, M.; Strohmeier, M.; Lenders, V.; Martinovic, I.; Wilhelm, M. Bringing up OpenSky: A large-scale ADS-B sensor network for research. In Proceedings of the IPSN-14 Proceedings of the 13th International Symposium on Information Processing in Sensor Networks, Berlin, Germany, 15–17 April 2014; pp. 83–94. [Google Scholar]
  9. Figuet, B.; Monstein, R.; Waltert, M.; Barry, S. Predicting airplane go-arounds using machine learning and open-source data. Proceedings 2020, 59, 6. [Google Scholar] [CrossRef]
  10. Xu, Z.; Lu, X.; Zhang, Z. Aircraft go-around detection employing open source ADS-B data. In Proceedings of the 2021 IEEE 3rd International Conference on Civil Aviation Safety and Information Technology (ICCASIT), Changsha, China, 20–22 October 2021; pp. 259–262. [Google Scholar] [CrossRef]
  11. Kumar, S.G.; Corrado, S.J.; Puranik, T.G.; Mavris, D.N. Classification and analysis of go-arounds in commercial aviation using ADS-B data. Aerospace 2021, 8, 291. [Google Scholar] [CrossRef]
  12. Dai, L.; Liu, Y.; Hansen, M. Modeling go-around occurrence. In Proceedings of the Thirteenth USA/Europe Air Traffic Management Research and Development Seminar (ATM2019), Vienna, Austria, 18 June 2019; pp. 17–21. [Google Scholar]
  13. Dhief, I.; Alam, S.; Lilith, N.; Mean, C.C. A machine learned go-around prediction model using pilot-in-the-loop simulations. Transp. Res. Part Emerg. Technol. 2022, 140, 103704. [Google Scholar] [CrossRef]
  14. Dai, L.; Liu, Y.; Hansen, M. Predicting go-around occurrence with input-output hidden Markov model. In Proceedings of the International Conference on Research in Air Transportation, online, 15 September 2020. [Google Scholar]
  15. Puranik, T.G.; Rodriguez, N.; Mavris, D.N. Towards online prediction of safety-critical landing metrics in aviation using supervised machine learning. Transp. Res. Part C Emerg. Technol. 2020, 120, 102819. [Google Scholar] [CrossRef]
  16. Chou, C.S.; Tien, A.; Bateman, H. A machine learning application for predicting and alerting missed approaches for airport management. In Proceedings of the 2021 IEEE/AIAA 40th Digital Avionics Systems Conference (DASC), San Antonio, TX, USA, 3–7 October 2021; pp. 1–9. [Google Scholar] [CrossRef]
  17. Dancila, R.; Botez, R.M.; Ford, S. Fuel burn and emissions evaluation for a missed approach procedure performed by a B737-400. Aeronaut. J. 2014, 118, 1329–1348. [Google Scholar] [CrossRef]
  18. Casado, R.; López-Lago, M.; Serna, J.; Bermúdez, A. Enhanced missed approach procedure based on aircraft reinjection. IEEE Trans. Aerosp. Electron. Syst. 2021, 57, 4149–4170. [Google Scholar] [CrossRef]
  19. Carmona, M.; Casado, R.; Bermúdez, A.; Francisco, M.P.; Boronat, P.; Calafate, C.T. Fuel savings through missed approach maneuvers based on aircraft reinjection. arXiv Prepr. 2022, arXiv:2207.03262. [Google Scholar] [CrossRef]
  20. Campbell, A.; Zaal, P.; Schroeder, J.A.; Shah, S. Development of possible go-around criteria for transport aircraft. In Proceedings of the 2018 Aviation Technology, Integration, and Operations Conference, Atlanta, GA, USA, 25–29 June 2018. [Google Scholar] [CrossRef] [Green Version]
  21. Ross, G.; Tomko, L. Go-around noncompliance during unstabilized approaches and landings in commercial aviation: A human factors analysis. In Proceedings of the 82nd International Symposium on Aviation Psychology, Corvallis, OR, USA, 5 January 2021; pp. 299–302. [Google Scholar]
  22. de Voogt, A.; Kalagher, H.; Santiago, B.; Lang, J.W. Go-around accidents and general aviation safety. J. Saf. Res. 2022, 82, 323–328. [Google Scholar] [CrossRef] [PubMed]
  23. Krauth, T.; Morio, J.; Olive, X.; Figuet, B.; Monstein, R. Synthetic Aircraft Trajectories Generated with Multivariate Density Models. Eng. Proc. 2021, 13, 7. [Google Scholar] [CrossRef]
  24. Olive, X. Traffic, a toolbox for processing and analysing air traffic data. J. Open Source Softw. 2019, 4, 1518. [Google Scholar] [CrossRef] [Green Version]
  25. Sun, J.; Ellerbroek, J.; Hoekstra, J. Large-scale flight phase identification from ads-b data using machine learning methods. In Proceedings of the 7th International Conference on Research in Air Transportation, Philadelphia, OA, USA, 20–24 June 2016; pp. 1–8. [Google Scholar]
  26. Monstein, R.; Figuet, B.; Krauth, T.; Waltert, M.; Dettling, M. Large Landing Trajectory Data Set for Go-Around Analysis. open dataset. 1 November 2022. [Google Scholar] [CrossRef]
  27. Dunn, P.K.; Smyth, G.K. Generalized Linear Models with Examples in R; Springer Texts in Statistics; Springer New York: New York, NY, USA, 2018. [Google Scholar]
  28. Wilson, E.B. Probable inference, the law of succession, and statistical inference. J. Am. Stat. Assoc. 1927, 22, 209–212. [Google Scholar] [CrossRef]
Figure 1. Proportion of the observed landings per region, country, and airport.
Engproc 28 00002 g001
Figure 2. Illustration of the model coefficients and its confidence intervals obtained from the quasi-binomial GLM.
Engproc 28 00002 g002
Figure 3. GA rates, per 1000 landings, of the top three operators at selected US airports.
Engproc 28 00002 g003
Table 1. Columns in the dataset.
Column NameTypeDescription
timedate timeUTC time of landing or first GA (in the format YYYY-MM-DD). Specifically, it is the timestamp when the flight was last aligned on the runway on its first landing attempt.
icao24stringUnique 24-bit (hexadecimal number) ICAO identifier of the aircraft concerned.
callsignstringAircraft identifier in air-ground communications.
airportstringICAO airport code where the aircraft is landing.
runwaystringDesignation of the runway on which the aircraft performed its first landing attempt.
has_gastring“True” if at least one GA was performed, otherwise “False”.
n_approachesintegerNumber of approaches identified for this flight.
n_rwy_approachedintegerNumber of unique runways approached by this flight.
Table 2. Landing dataset content example.
Timeicao24CallsignAirportRunwayhas_gan_approachedn_rwy_approached
2019-10-12 05:21:2048455aKLM88JEHAM18CFalse11
2019-06-30 20:53:144000937BAW957LEGGL27LTrue21
2019-10-03 14:38:45070ed46VONEGOBD01True62
Table 3. Features used in the regression model to predict the probability of a GA of an airport–runway pair.
FeatureTypeDescription
has_intersectioncategoricalTrue if the runway has another runway intersecting it, otherwise false.
rwy_lengthcontinuousLength of the runway in kilometers.
glide_slope_anglecontinuousAngle of the ILS glide slope in degrees.
airport_regioncategoricalGeographical region of the airport (either Europe, North America, South America, Asia, Africa, or Oceania).
Table 4. Estimated model coefficients obtained from the quasi-binomial GLM.
CoefficientEstimateStd. Errorp-Value
intercept−6.60.400
has_intersection = True0.110.0540.033
rwy_length−0.0860.0440.055
glide_slope_angle0.390.110.0003
airport_region = North America0.0970.0550.078
airport_region = South America0.680.120
airport_region = Asia−0.340.0900.0001
airport_region = Oceania−0.40.120.0007
airport_region = Africa−0.560.650.39
Publisher’s Note: MDPI stays neutral with regard to jurisdictional claims in published maps and institutional affiliations.

