Proceeding Paper

A Deep-Learning-Based Approach for Saliency Determination on Point Clouds †

1
Department of Computer Science and Engineering, Université du Québec en Outaouais, Gatineau, QC J8X 3X7, Canada
2
School of Electrical Engineering and Computer Science, University of Ottawa, Ottawa, ON K1N 6N5, Canada
*
Author to whom correspondence should be addressed.
Presented at the 9th International Electronic Conference on Sensors and Applications, 1–15 November 2022; Available online: https://ecsa-9.sciforum.net/.
Eng. Proc. 2022, 27(1), 17; https://doi.org/10.3390/ecsa-9-13271
Published: 1 November 2022

Abstract

:
Laser scanners recording a huge number of data points from different surfaces are widely used to capture the exact geometry of 3D objects. These large amounts of data require intelligent solutions to be examined and processed efficiently. Deep-learning-based approaches have found their way into many data analytics applications for processing such large datasets, categorizing them, or even determining the most informative portion of the data. This research focused on 3D deep-learning techniques directly applied to point clouds to determine the most important features of a 3D shape. More specifically, this research adopted PointNet as a backbone architecture for feature extraction from 3D point clouds and computed a gradient-based class activation mapping (Grad-CAM) on each object to create a 3D importance/saliency map. Experiments confirmed the success of the proposed approach in the determination of important features of 3D objects as compared with the ground truth.

1. Introduction

High-resolution 3D scanners have become popular devices for collecting point-cloud data from 3D objects. The exploratory analysis and visualization of such large amounts of data are crucial for many applications such as scene reconstruction, object recognition and autonomous navigation. As such, computing 3D importance (saliency) maps is a topic of interest in computer vision. While most of the saliency detection approaches take into consideration the geometrical features of objects, some research work targets reproducing human perception capabilities and uses them as a data selection strategy. In this context, the idea of mimicking human visual attention capabilities has the potential to improve recognition in terms of performance and time. On the other hand, the use of point clouds has become inevitable for several applications and domains such as robotic perception, video games, autonomous driving, virtual and augmented reality, etc. Most researchers transform these data into grids of 3D voxels or collections of images. However, this makes the data unnecessarily large and poses problems for an efficient interpretation of their contents. Using 3D learning algorithms on point cloud data presents a very promising approach for many problems, such as 3D object detection and classification. Some deep neural network algorithms [
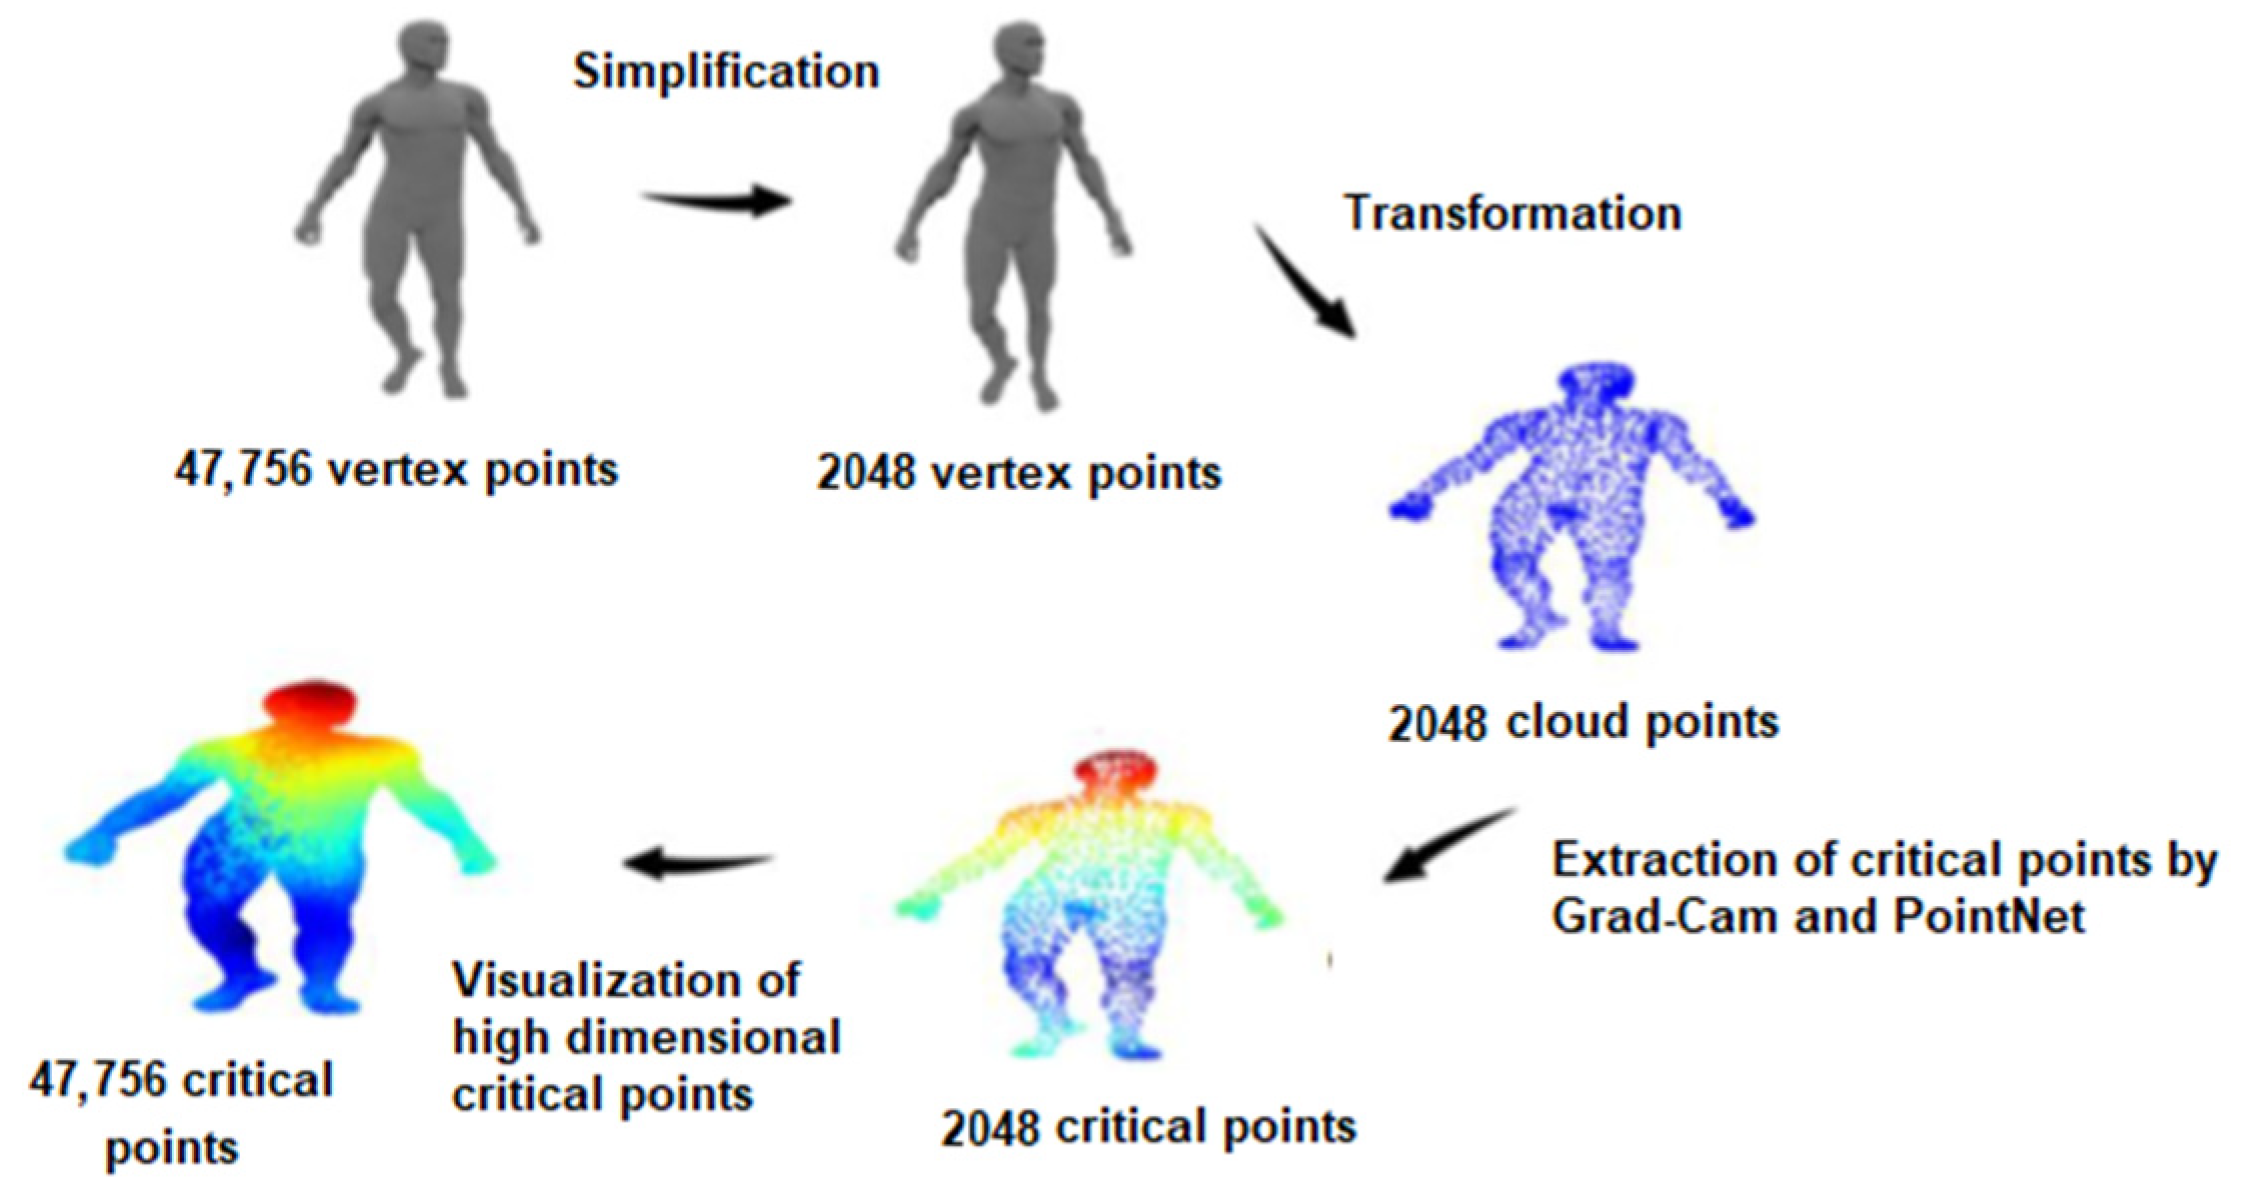
1] already propose methods for using point clouds for a 3D object representation and learning the global features to recognize the related object. The main contribution of this paper is proposing a novel approach to identifying a subset of salient (important and critical) points on the surfaces of 3D objects represented by point clouds (using a PointNet architecture), to specify and visualize the importance of each critical point with respect to its classification (using an adaptation of Grad-CAM from 2D to 3D), and then visualizing the detected salient regions and comparing the results with those of existing methods and against the ground truth.

2. State of the Art

As previously mentioned, the identification of salient regions of a 3D object has the potential to ease further analysis and processing of the object. Therefore, many research studies aim at the identification of saliencies on 3D objects. Leifman et al. [2] introduce a vertex descriptor to highlight vertices with unique geometrical features with respect to their surroundings. Their descriptor is invariant to rigid transformation. A center-surround mechanism initially introduced in the classical model of visual attention [3] was applied for curvature measures of 3D object meshes by Lee et al. [4], as a method of saliency detection. Song et al. [5] propose a 3D saliency detector for triangular meshes based on spectral mesh processing. Tasse et al. [6] took advantage of fuzzy clustering to highlight salient regions on 3D meshes. While all these algorithms show promising solutions for saliency detection, it has been proven that these implementations are still far from the capabilities of the mechanism of visual attention in humans [7].
In recent years, deep learning has strongly contributed to important advances in a variety of fields such as text understanding, speech recognition and computer vision. When trained on large number of training samples, deep-learning-based approaches are capable of extracting relevant information from the input data and using it for a variety of tasks such as classification and regression. While deep-learning architectures are generally considered black boxes, a huge research effort has been devoted to revealing the reasoning behind the decision of a deep neural network. In this direction, class activation mapping (CAM) [8] is a method for highlighting important regions in an image for a specific decision. The global average pooling (GAP) layers in the architecture of deep neural networks are able to identify discriminating regions and retain the localization capability until the last layer in order to visualize the most informative regions in an image. Another approach, proposed in [9], detects regions of interest in an image by passing it through a convolutional neural network (CNN) to classify it and computes the gradient of the classification score with respect to the activations of the last convolution layer. The regions of the image that have the highest weight are the regions that most influence the classification score. This approach is known as Gradient Weighted Class Activation Mapping (Grad-CAM). Considering the existing works, the main objective of this research work was to bring contributions to the identification of salient/critical points on the surfaces of 3D objects represented by point clouds. The work built on the deep convolutional network PointNet and addressed the problem of the lack of a means to evaluate the importance of critical points in relation to the classification performance as well as the lack of transparency and visualization of the results in an intuitive and understandable way. This was achieved by adapting the Grad-CAM algorithm for 3D objects in order to specify the importance of each critical point with respect to its classification.

3. Framework

3.1. Point Cloud Representation of 3D Objects

A point cloud (or point set) is a type of geometric data structure in the form of an unordered set of points in a three-dimensional coordinate system x, y, and z. The set of points represents a 3D shape or object. As part of this work, we used the Trimesh library [10], which allows loading a 3D mesh or a vectorized path into a Trimesh object. The latter contains a 3D triangular mesh. The purpose of transforming 3D objects into Trimesh objects is not only for the visualization of the object, but also to facilitate the transformation of the dataset into point clouds. In this way, we transformed the mesh of each object into a point cloud representation based on 2048 points by the uniform sampling of x, y and z coordinates.

PointNet Architecture

In order to process point cloud representations of 3D objects, we used PointNet [1] as a deep neural network backbone. PointNet takes a raw point cloud as the input and learns both global and local features of points, providing a simple and effective approach for a number of 3D recognition tasks. We used it for the classification of 40 classes of 3D objects [10], where each object was represented by a set of 2048 points and each point was treated individually and in a similar manner. The PointNet architecture is quite simple; two multilayer perceptron networks are used to integrate an input x into a higher-dimensional space, in our case, to map each point among the n points from 3 dimensions to 64 dimensions. This procedure was repeated later to map the points from 64 to 1024 dimensions. These networks were followed by a max pooling operation, which consisted of the application of a symmetric function to aggregate the information from all the points of the 3D object, resulting in a global feature vector, followed by another multilayer perceptron network to process the aggregated feature and, finally, a softmax activation function to normalize the score of the points. PointNet makes use of a regression network called T-Net to achieve an affine transformation for normalization purposes by predicting an input-dependent 3-by-3 transformation matrix for input transform as well as a 64-by-64 transformation matrix for feature transform; these matrices are the result of a combination of input-dependent features and globally trainable weights at the final fully connected layer of T-Net. Further details about the architecture of the PointNet architecture are available for the interested reader in [1].
One of the problems of the PointNet model is the lack of transparency and visualization of the results in an intuitive and understandable way. In order to understand the classification steps as well as the choice of the model in relation to the classification, we considered the different layers of the model and created a pipeline in order to extract the output of each layer, thus enabling the visualization of points and regions of an object.

3.2. Gradient Class Activation Mapping

To understand the reasoning behind network decisions and to highlight important regions of a point cloud, the Grad-CAM algorithm was used to exploit the spatial information that is preserved by the convolutional layers to understand which regions of the input object are important for making a certain classification decision. Grad-CAM uses the existing gradient information in the last convolutional layer of the PointNet convolutional neural network to assign importance values to each neuron. This technique can be used to explain the activations in any layer of a deep network. In particular, the algorithm looks for which parts of the image led a convolutional neural network to its final decision. From this information, it produces heat maps representing the activation classes on the images. To reproduce the same result on a 3D object, we adapted Grad-CAM to work in three dimensions (x, y, z), therefore building an extension of Grad-CAM from 2D to 3D. In order to obtain the discriminative class location map ( L G r a d C A M C ), we first calculated the gradient of the class score c,   w k c respecting the feature activation map A k (feature map activations) of the last convolution layer, w C A k . These gradients were then processed by a max pooling operation on the dimensions x, y and z to obtain the importance weights of the neurons and produce a score, w k c . This resulted in a vector where each element represented the maximum intensity of the gradient. After that, each channel in the feature map extracted from the last layer was multiplied by the importance of that channel relative to the class with the highest score. We then added all the channels to obtain the class activation heatmap.
In our case, the class activation heatmap is an importance vector of size (2048, 3) that represents the salience of each point of the object. To obtain a good resolution for the visualization of the class activation heat map, we transformed this vector of dimensions (2048, 3) into (n, 3), where n is the number of vertices of the initial object. To do this, we first used a scipy.ndimage library to enlarge the vector of critical points and thus to increase the resolution (size) of the point cloud. We then used the K-nearest neighbor algorithm, which allows, for all the initial object vertices, finding the index of the vertex closest to the simplified object in order to assign the level of saliency of the closest vertices. In this way, the resolution of the saliency vector was increased, and it was possible to assign the vector to the initial object, thus preserving the details of the initial 3D object and obtaining a higher-resolution representation of the saliency vector. Figure 1 shows the entire process employed for visualizing the critical points at higher resolution.

4. Results and Discussion

We tested the proposed framework on five 3D objects that can be categorized in one of the categories of ModelNet [11] and for which the ground-truth information is available [7]. 
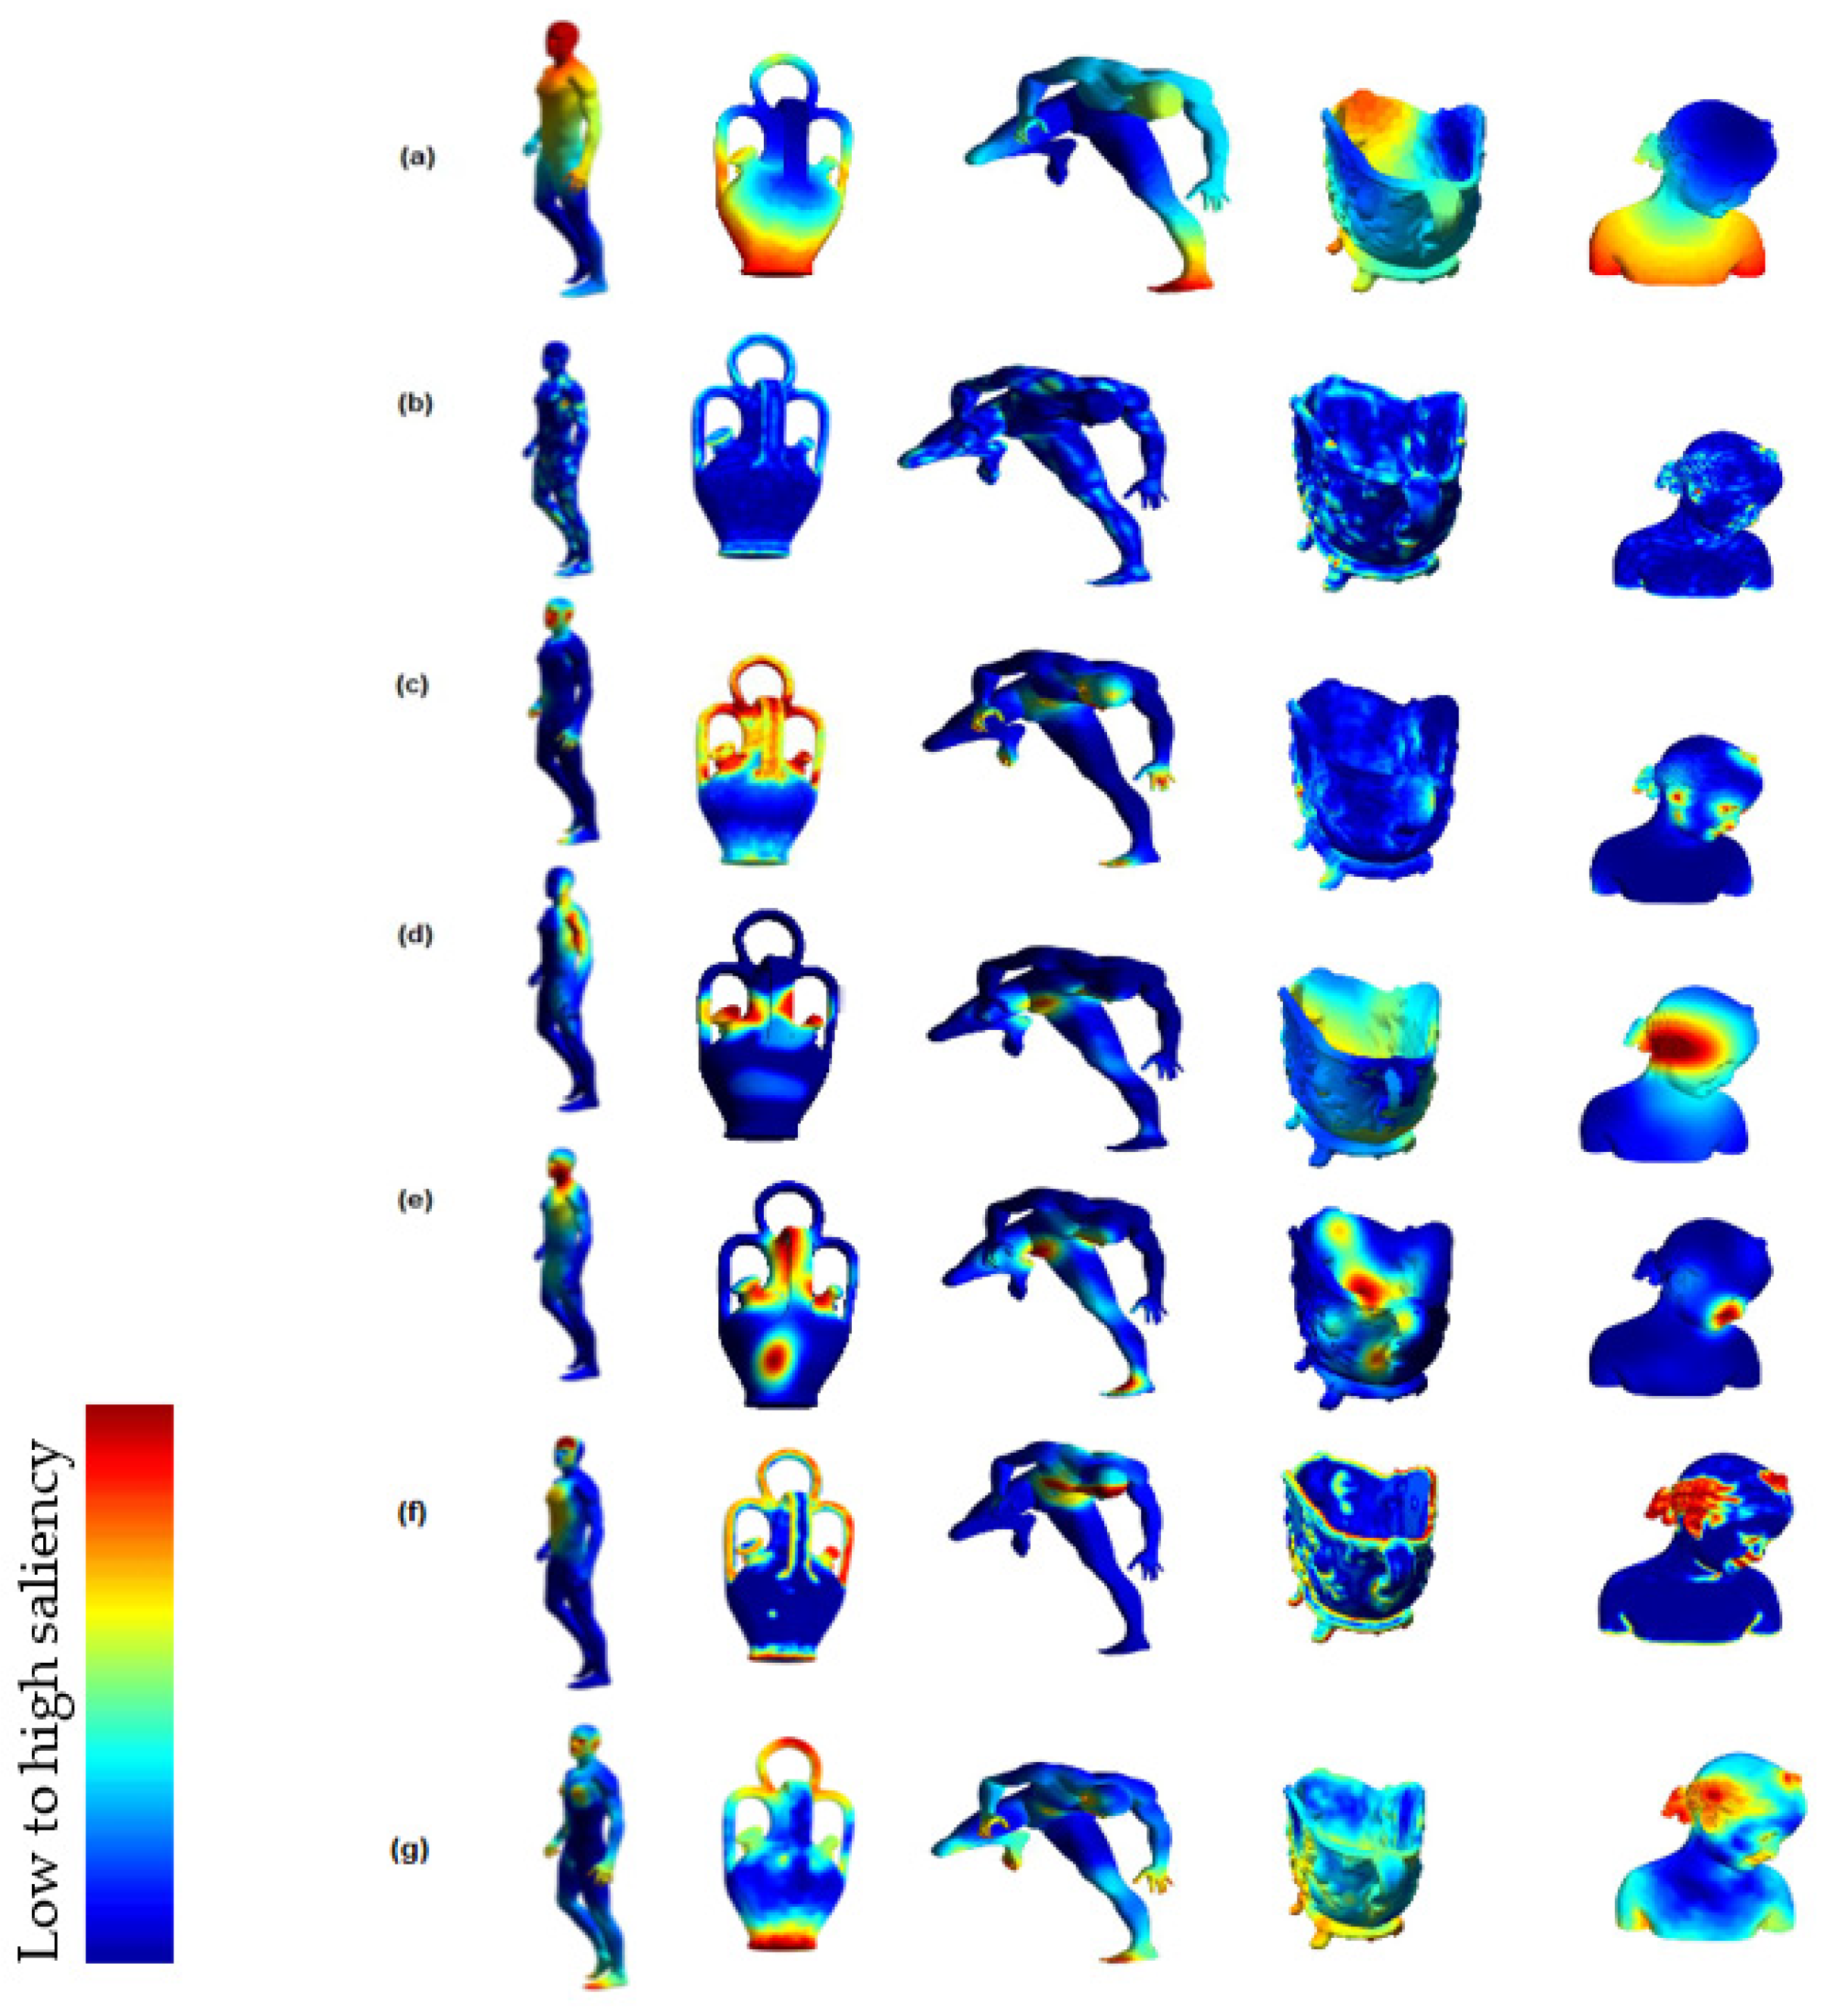
Figure 2 compares the saliencies rendered using a jet colormap for the five objects extracted from [7] and with different methods from the literature.
It can be noticed that the critical regions on the surfaces of the objects are different, due to the different methods employed to create each model. Lee [4] applied the center-surround paradigm used by Itti [3] to a vertex curvature metric of a 3D object to compute saliency. Leifman [2] proposed a surface saliency detector by highlighting vertices with unique geometry. For this purpose, they introduced a vertex descriptor that was invariant to the rigid transformation and searched for vertices that were highly dissimilar to their neighborhood. The algorithm for saliency detection of Song [5] is based on spectral mesh processing. Tasse [6] proposes a framework using fuzzy clustering to detect salient regions on 3D meshes. The 2D Grad-CAM algorithm VGG16 [12] computes and integrates Grad-CAM maps for 2D images captured from various viewpoints of each 3D object based on their different shapes and semantic features. Further details about other methods are provided in Section 2. The ground truth is generated by tracking the eye movement of human subjects when observing the object from three different viewpoints [7].
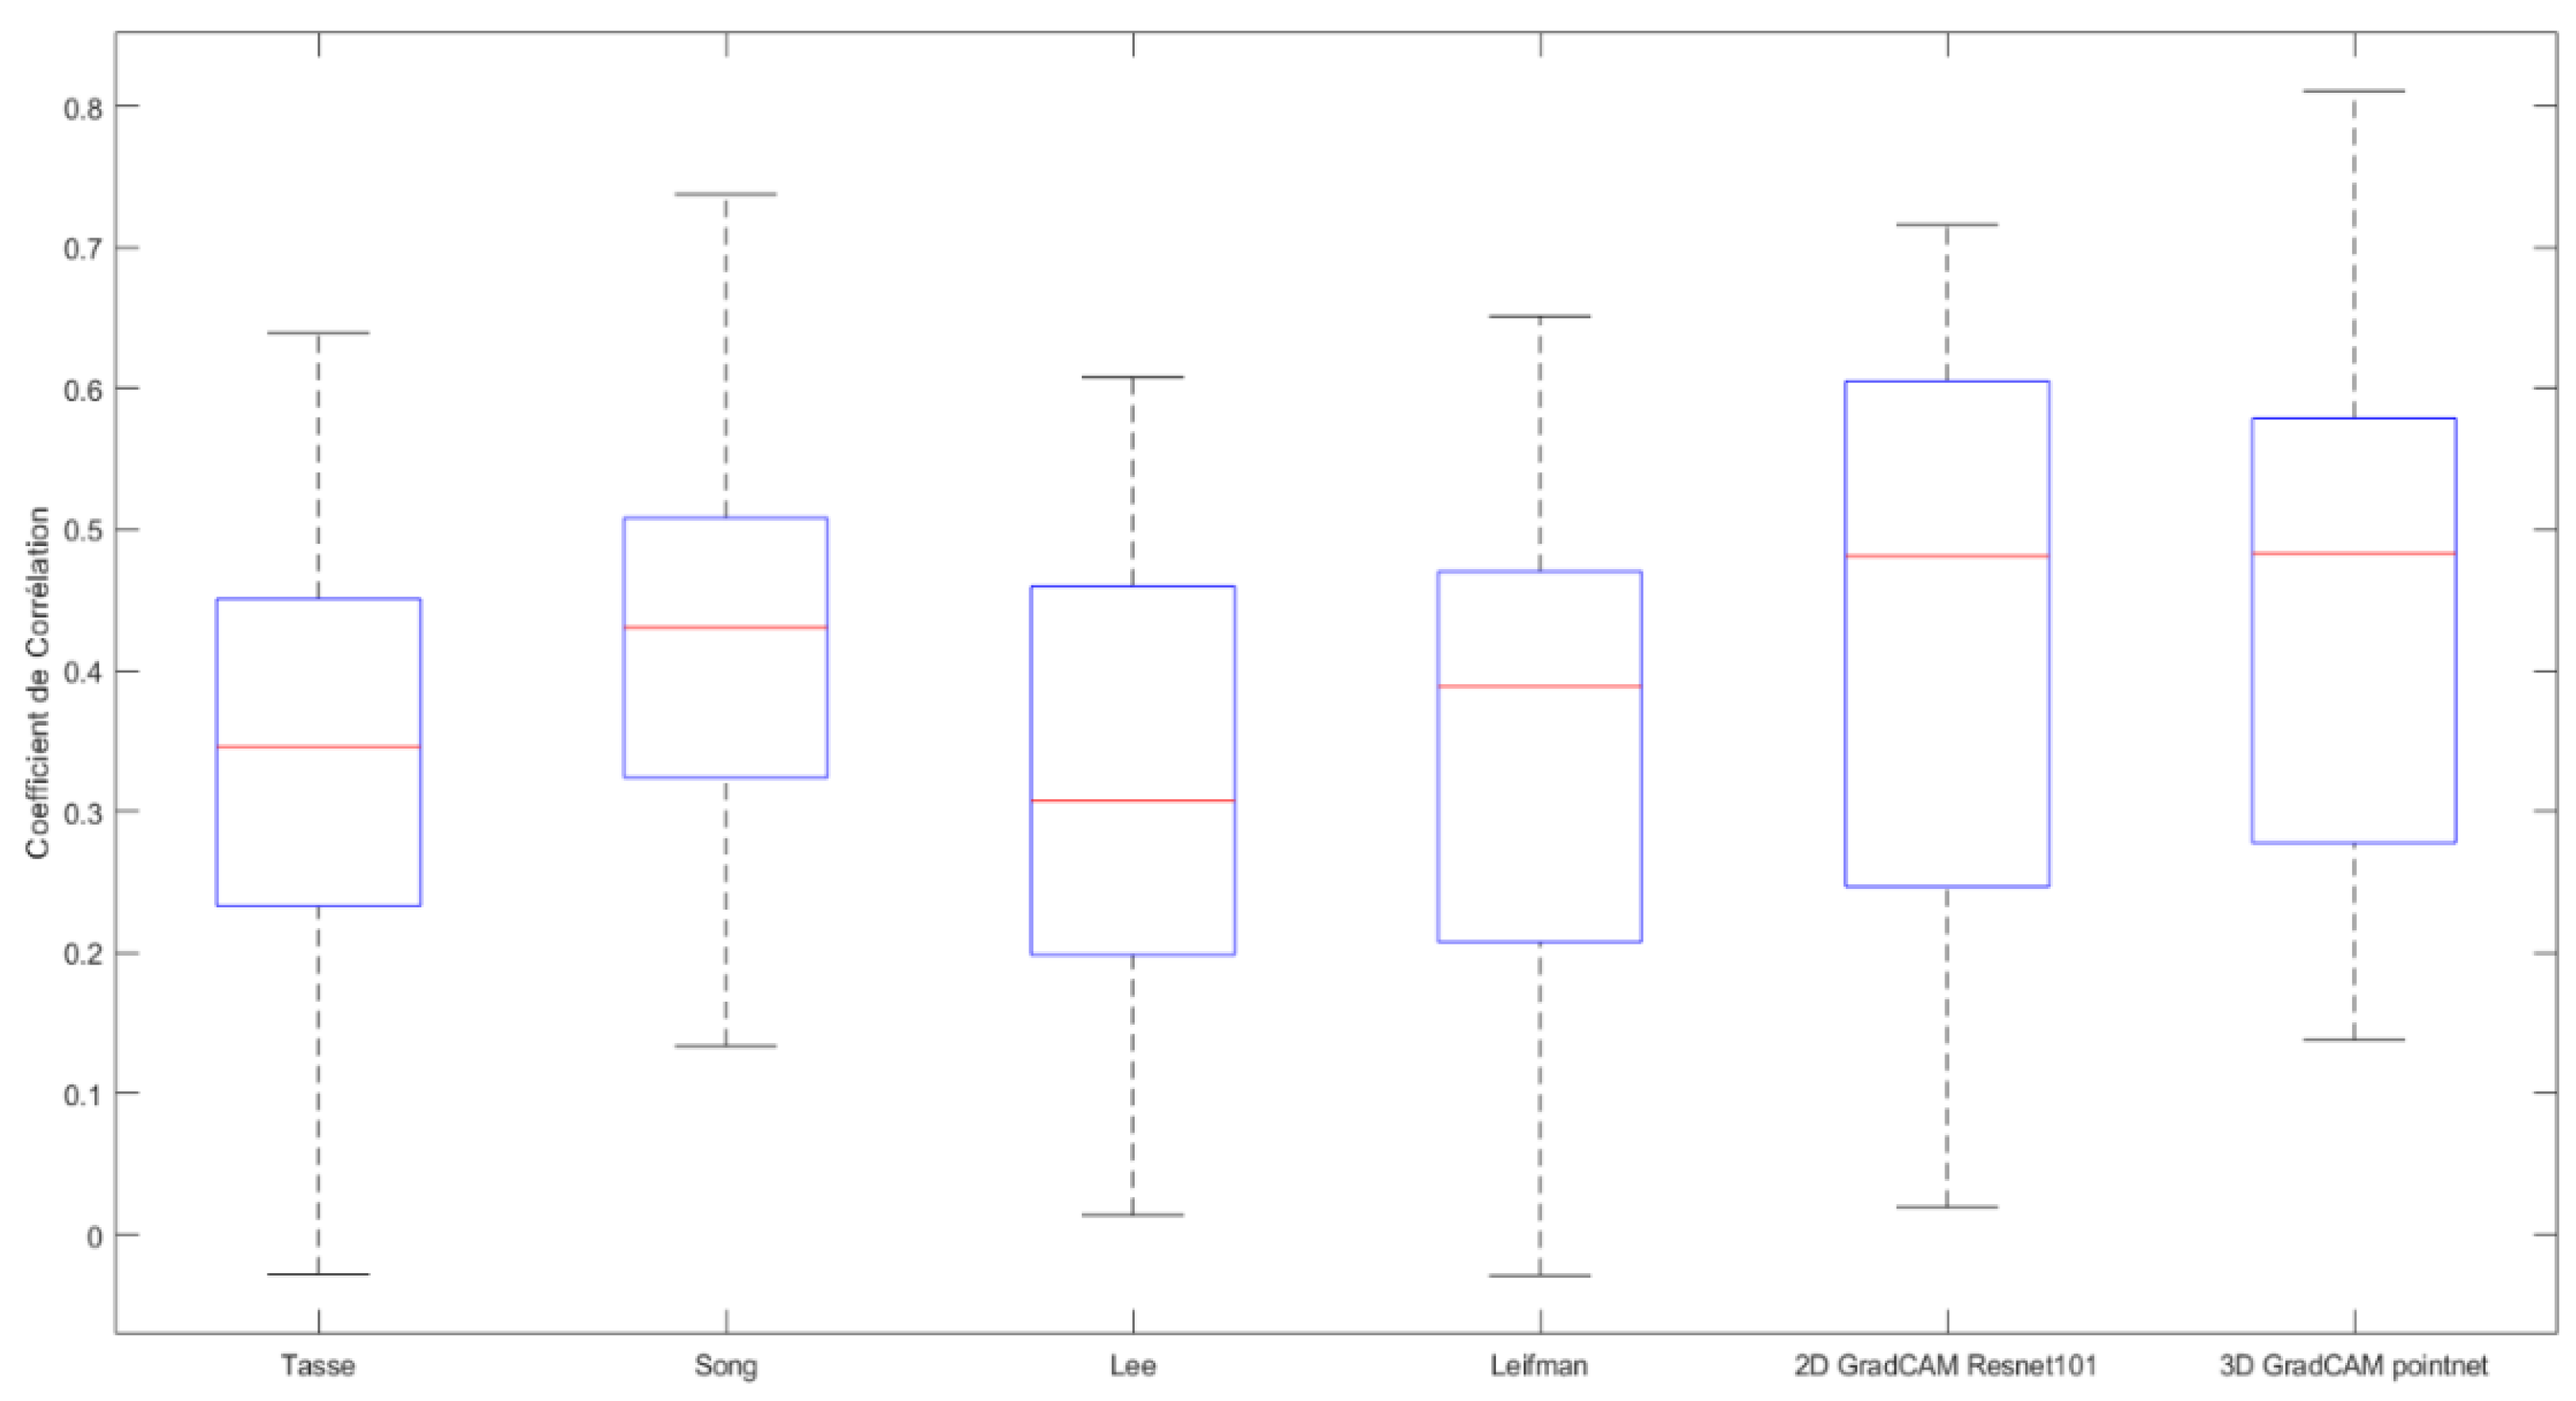
To quantitatively compare the similarity of the results of the different models, we chose a box plot diagram (Figure 3) to visualize the similarity between the saliency level vectors and the ground reality (GT [7]) for the comparison of results obtained for several objects. To obtain a fair comparison for each method, three saliency level vectors were obtained by multiplying the saliency level vectors by the visibility vectors (the list of vertices visible from each viewpoint); then, all the vectors were normalized between 0 and 1. The correlation coefficient used was Pearson’s linear correlation (ρ), which allows a balanced treatment of false positives and false negatives. For two maps x and y, it is defined as follows: ρ x , y = c o v ( x , y ) σ x σ y .
The same correlation measure was used by Lavoué et al. [7], who also concluded that none of the existing methods gave a strong correlation with the ground truth. It can be observed that, for all the methods, the interquartile ranges are very similar for the test objects used and range between 0.18 and 0.6. The interquartile mean varies between 0.34 and 0.47, demonstrating some similarity between the features extracted by different methods. Figure 3 (which shows this correlation coefficient) also confirms that, for some viewpoints, our method (3D Grad-CAM PointNet) obtained the highest similarity values among all the methods compared. The success of the Grad-CAM-based methods can be explained by the fact that these methods assign the highest saliency level to the regions (pixels in 2D or vertices in 3D) with the highest gradient update when classifying the object, while the other methods are instead based on geometric features. Thus, the Grad-CAM based methods focus on a single region, while the other methods obtain sparse regions on the models.

5. Conclusions

In this work, we proposed a hybrid method that combines two architectures, the PointNet deep neural network and an adapted version of Grad-CAM, 3D Grad-CAM. Our solution includes the pre-processing of 3D data, implementation and training of the PointNet model, adaptation of Grad-CAM for 3D data, integration of Grad-CAM with the PointNet model and visualization of critical/salient points extracted by PointNet and Grad-CAM. The study demonstrated a good performance of the proposed method compared to similar work in the literature.

Author Contributions

Conceptualization, Y.S. and G.R.; methodology, Y.S. and G.R.; software, Y.S.; validation, Y.S., G.R. and A.-M.C.; formal analysis, Y.S., G.R. and A.-M.C.; investigation, Y.S., G.R. and A.-M.C.; resources, G.R. and A.-M.C.; data curation, Y.S. and G.R.; writing—original draft preparation, Y.S.; writing—review and editing, G.R. and A.-M.C.; visualization, Y.S.; supervision, G.R. and A.-M.C.; project administration, A.-M.C.; funding acquisition, A.-M.C. All authors have read and agreed to the published version of the manuscript.

Funding

This research is funded by NSERC discovery grant number NSERC DDG-2020-00045.

Informed Consent Statement

Not applicable.

Conflicts of Interest

The authors declare no conflict of interest.

References

  1. Qi, C.R.; Su, H.; Mo, K.; Guibas, L.J. Pointnet: Deep learning on point sets for 3D classification and segmentation. In Proceedings of the IEEE Conference on Computer Vision and Pattern Recognition, Honolulu, HI, USA, 21–26 July 2017; pp. 652–660. [Google Scholar]
  2. Leifman, G.; Shtrom, E.; Tal, A. Surface regions of interest for viewpoint selection. IEEE Trans. Pattern Anal. Mach. Intell. 2016, 38, 2544–2556. [Google Scholar] [CrossRef] [PubMed] [Green Version]
  3. Itti, L.; Koch, C.; Niebur, E. A model of saliency-based visual attention for rapid scene analysis. IEEE Trans. Pattern Anal. Mach. Intell. 1998, 20, 1254–1259. [Google Scholar] [CrossRef] [Green Version]
  4. Lee, C.H.; Varshney, A.; Jacobs, D.W. Mesh saliency. ACM Trans. Graph. 2005, 24, 659. [Google Scholar] [CrossRef]
  5. Song, R.; Liu, Y.; Martin, R.R.; Rosin, P.L. Mesh saliency via spectral processing. ACM Trans. Graph. 2014, 33, 1–17. [Google Scholar] [CrossRef] [Green Version]
  6. Tasse, F.P.; Kosinka, J.; Dodgson, N. Cluster-based point set saliency. In Proceedings of the IEEE International Conference on Computer Vision (ICCV), Santiago, Chile, 7–13 December 2015; pp. 163–171. [Google Scholar] [CrossRef]
  7. Lavoué, G.; Cordier, F.; Seo, H.; Larabi, M.-C. Visual attention for rendered 3D shapes. Comput. Graph. Forum 2018, 37, 191–203. [Google Scholar] [CrossRef]
  8. Zhou, B.; Khosla, A.; Lapedriza, A. Learning deep features for discriminative localization. In Proceedings of the IEEE Conference on Computer Vision and Pattern Recognition, Las Vegas, NV, USA, 27–30 June 2016; pp. 2921–2929. [Google Scholar]
  9. Selvaraju, R.R.; Das, A.; Vedantam, R.; Cogswell, M.; Parikh, D.; Batra, D. Grad-CAM: Visual explanations from deep networks via gradient-based localization. arXiv 2019, arXiv:1610.02391. Available online: https://arxiv.org/abs/1610.02391 (accessed on 6 July 2021).
  10. Trimesh Library. Available online: https://trimsh.org/trimesh.html (accessed on 12 May 2021).
  11. ModelNet40 Dataset. Available online: https://modelnet.cs.princeton.edu/ (accessed on 5 May 2021).
  12. Rouhafzay, G. 3D Object Representation and Recognition Based on Biologically Inspired Combined Use of Visual and Tactile Data. Ph.D. Dissertation, University of Ottawa, ON, Canada, 2021. [Google Scholar]
Figure 1. The proposed framework for saliency determination in point clouds.
Engproc 27 00017 g001
Figure 2. Different visualizations of the object saliency computed using different methods: (a) 3D Grad-CAM PointNet (our method); (b) Lee [4]; (c) Leifman [2]; (d) 2D Grad-CAM VGG16; (e) ground truth; (f) Tasse [6]; and (g) Song [5].
Engproc 27 00017 g002
Figure 3. Similarity between the vectors of the levels of importance and the ground truth [7].
Engproc 27 00017 g003
Publisher’s Note: MDPI stays neutral with regard to jurisdictional claims in published maps and institutional affiliations.

