Abstract
Poly ethylene terephthalate glycol (PETG)-filament gives excellent layer adhesion, thus it is widely used in fused deposition modeling (FDM). To achieve process repeatability, process parameters and product geometrical accuracy should be correlated. However, the studies of geometrical accuracy are limited. In this study, PETG-holes are FDM-printed, according to ISO ASTM 52902-2021 standard. The holes have diameters of 4 mm, 3 mm, 2 mm, 1 mm and 0.5 mm and are built with different printing speeds (20 mm/s, 50 mm/s and 80 mm/s) and layer heights (0.1 mm, 0.2 mm, 0.3 mm). The hole-diameter measurements are obtained by a microscope and computer vision. The results are then analyzed statistically and commented.
1. Introduction
Polyethylene terephthalate glycol (PETG) is a thermoplastic resin that belongs to the polyester category. PETG is the result of the combination of the well-known polyethylene terephthalate (PET) with glycol [1]. This combination gives PETG high durability, strength, flexibility and chemical resistance, low moisture absorption, its light weight, its recyclability and its resistance to UV light [2]. Thus, the Food and Drug Administration (FDA) categorizes it as a “generally safe” material. For this reason, PETG is widely used in food and drink containers, cosmetics packaging and medical and pharmaceutical applications (implants, packaging of medical and pharmaceutical devices). Moreover, it should be taken into account that PETG-filament prints easily and has low odor emissions during printing, making it an ideal choice for 3D-printing [3].
A widely used 3D-printing method that prints thermoplastic materials, such as PETG, PLA and ABS, is fused deposition modeling (FDM). In FDM, the thermoplastic filament, stored in a reservoir, is heated up to its melting point and then it is extruded through a nozzle on the 3D-printing platform [4]. In FDM, there are many parameters that affect the mechanical properties and the geometrical accuracy of the final product. Some of the most crucial parameters are the printing speed, the layer height, the build orientation, the infill density and pattern, the raster angle, the extrusion temperature and the diameter of the nozzle [5,6]. Thus, in order to use FDM widely in the industry, it is necessary to correlate all these parameters with the mechanical and geometrical behavior of the final products, which gives the opportunity for accurate predictions of the results of any FDM process.
The literature, specifying the mechanical properties of PETG printed by an FDM machine, is extensive. Durgashyam et al. [7] studied the effect of feed rate, infill density and layer height on flexural and tensile strength of FDM-printed PETG. Srinivasan et al. [8] studied the effect of infill density of FDM-processed PETG specimens on their tensile strength and surface roughness. Khosravani et al. [2] printed FDM dumbbell-shaped PETG samples with different printing parameters (raster angle, raster width and layer height). Uniaxial tensile tests showed that the dominant failure mode was cohesive failure and that the best layer height for maximum fracture load was 0.2 mm.
On the other hand, literature on dimensional accuracy of FDM-printed parts is still limited. Mohanty et al. [9] studied the contribution of raster angle, part orientation, layer height, air gap and raster width on the dimensional accuracy of FDM-fabricated ABS specimens. Mwema et al. [10] FDM-printed PLA specimens with diamond, square, circular, hollow and S-shapes and tested their dimensional accuracy. The highest dimensional errors were observed for the thickness of the S-shaped specimens, whereas the lowest dimensional errors were observed for the diameters of the circular elements. Maurya et al. [11] used FDM to print PLA cubes with different infill patterns and infill densities and tested their dimensional accuracy. It was found that low infill densities and hexagon infill patterns give better dimensional accuracy. As it is observed from the papers above, there are some studies that try to correlate FDM parameters with the dimensional accuracy of the final ABS and PLA products. However, according to an extensive review paper [12], there are no studies of the dimensional accuracy of FDM-printed PETG specimens. For this reason and given that PETG is a widely used material in the industry, it is necessary to carry out experiments, also on PETG, in order to correlate the FDM-printing parameters with the dimensional accuracy of the final products.
The aim of this paper is to study the effect of printing speed (20 mm/s, 50 mm/s and 80 mm/s) and layer height (0.1 mm, 0.2 mm, 0.3 mm) on the dimensional accuracy of FDM-printed PETG holes of 4 mm, 3 mm, 2 mm, 1 mm and 0.5 mm diameter, created according to ISO ASTM 52902-2021 standard [13]. The experimental hole-diameters will be measured via image analysis of the photographs taken by microscope. Errors from the nominal values will be analyzed statistically, in order to test the dimensional accuracy and the repeatability of the process.
2. Experimental Methods
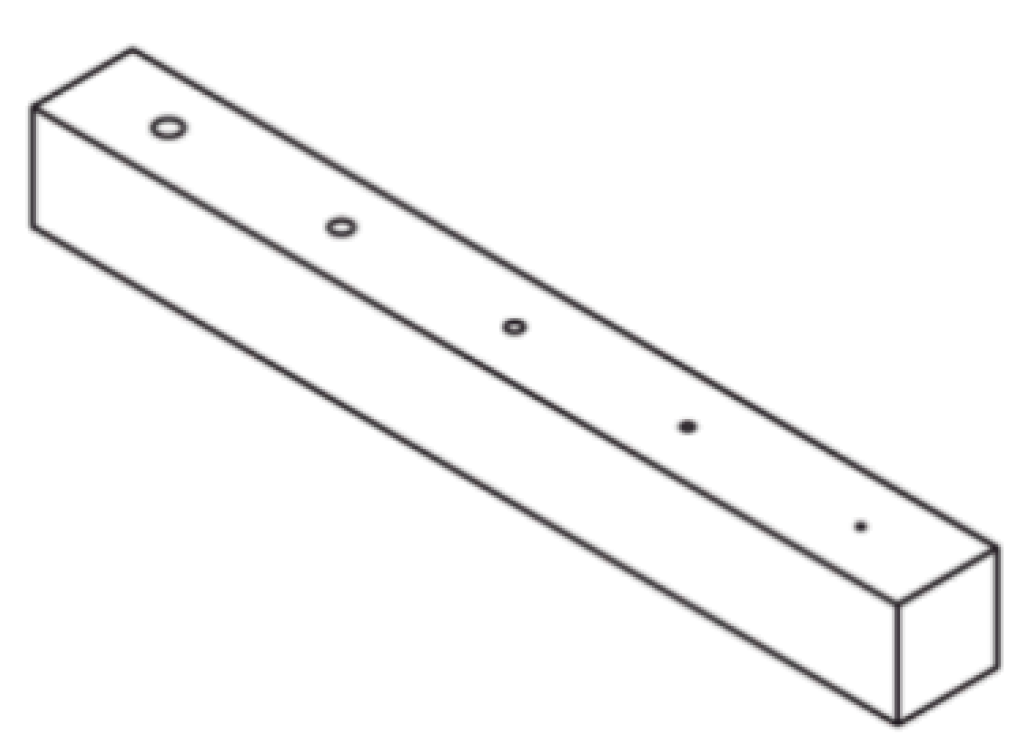
According to the ISO ASTM 52902-2021, the FDM-printed specimens (Figure 1) consist of five holes (4 mm, 3 mm, 2 mm, 1 mm and 0.5 mm) which were printed on a Creator 3 FDM 3D Printer.

Figure 1.
ISO ASTM 52902-2021 specimen-feature with coarse resolution holes.
Each specimen was printed five times, as the statistical analysis tools suggest. In total, 45 specimens were printed, 5 for each print speed and layer height. Furthermore, 180 holes are to be measured in total and not 225, as the 0.5 mm holes could not been printed by the Creator 3 3D Printer. For this reason, in this publication, a software-based approach of measurement was implemented.
The printer settings are presented below (Table 1):

Table 1.
Printer Settings.
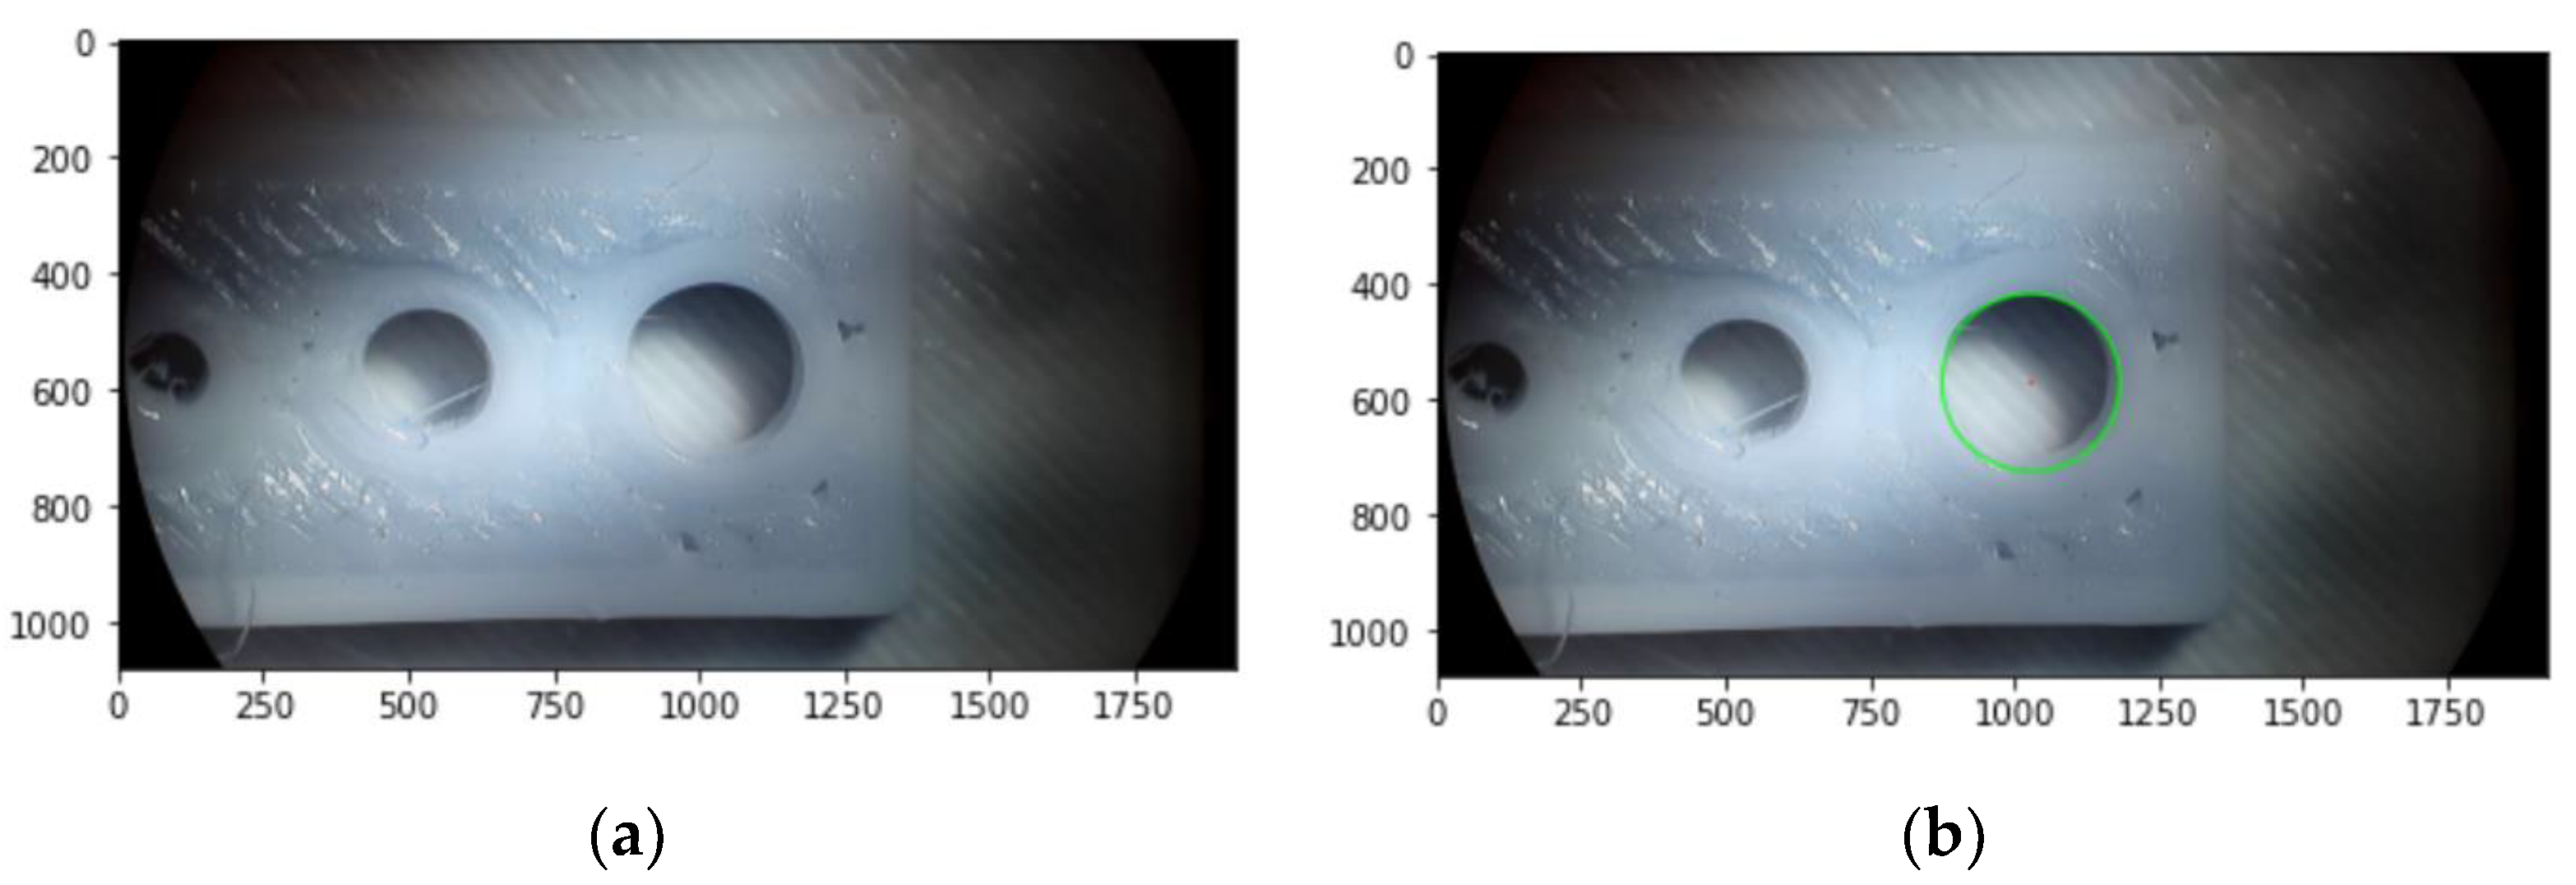
Firstly, images of each hole are captured using a camera-retrofitted microscope (stereoscope) and a scale is created for the diameters to be measured correctly by the software (Figure 2a). The diameter-measurement algorithm was implemented in Python, and the Computer Vision (CV) library was used. After the initial image (Figure 2a) has been captured, it is then cropped in order to retain only the hole that is to be measured. After that, an hsv (hue, saturation value) color-space filter is used in order to reduce imperfections in a better way than blurring. In this step, 30% of the h layer and 180% of the s layer are retained. Then, a negative transformation was implemented on the image. Finally, using the edge detection subroutine the diameter of the hole can be detected and measured in pixels. Then the pixels are converted to mm using the scale created in the beginning (Figure 2b).

Figure 2.
(a) Image captured by stereoscope and scale created by the software and (b) hole detected and diameter measured in pixels.
3. Results and Discussion
During the measurements, it was observed that the holes of some specimens were not created. This happened for all the holes with nominal diameter of 0.5 mm and for all the holes with nominal diameter of 1 mm and layer height of 0.3 mm. In these cases, the mean measured diameter error of all 5 measurements was 100%, which means that printing with these parameters is beyond the capabilities of the machine.
Mean measured diameter error is estimated if the nominal diameter is divided from the difference between the mean diameter of the 5 measurements and the nominal diameter. For all the other measurements, except those where no hole was created, mean measured diameter errors are estimated and they seem to extend from −4.88% up to −60.64%. In order to better understand the reasoning behind that, especially for the bigger errors, 1-sample t-tests are carried out for the lowest error (hole with nominal diameter of 4 mm, printing speed of 80 mm/s and layer height of 0.1 mm—error: 5%), for a medium error (nominal diameter: 1 mm, printing speed: 50 mm/s, layer height: 0.1 mm—error: 33%) and for the highest error (nominal diameter: 1 mm, printing speed: 80 mm/s, layer height: 0.1 mm—error: 61%). The results of these tests are given in Figure 3, where it is observed that the deviations between all the measured diameters are low, which means that the current 3D printer has a very good repeatability. The mean measured diameter error stems from the fact that all the experimental diameters are displaced away from the nominal diameters, which shows the need of better calibration of the 3D printer.
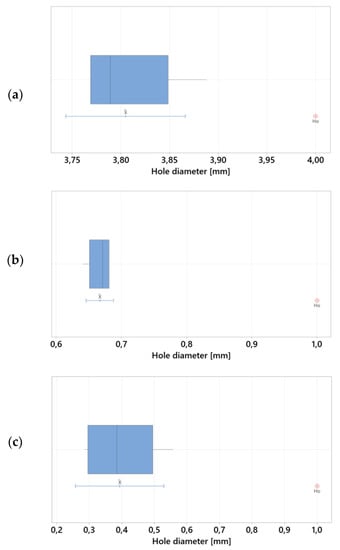
Figure 3.
Boxplots of the holes with the: (a) lowest, (b) medium and (c) highest mean measured diameter errors and 95% t-confidence interval for the mean.
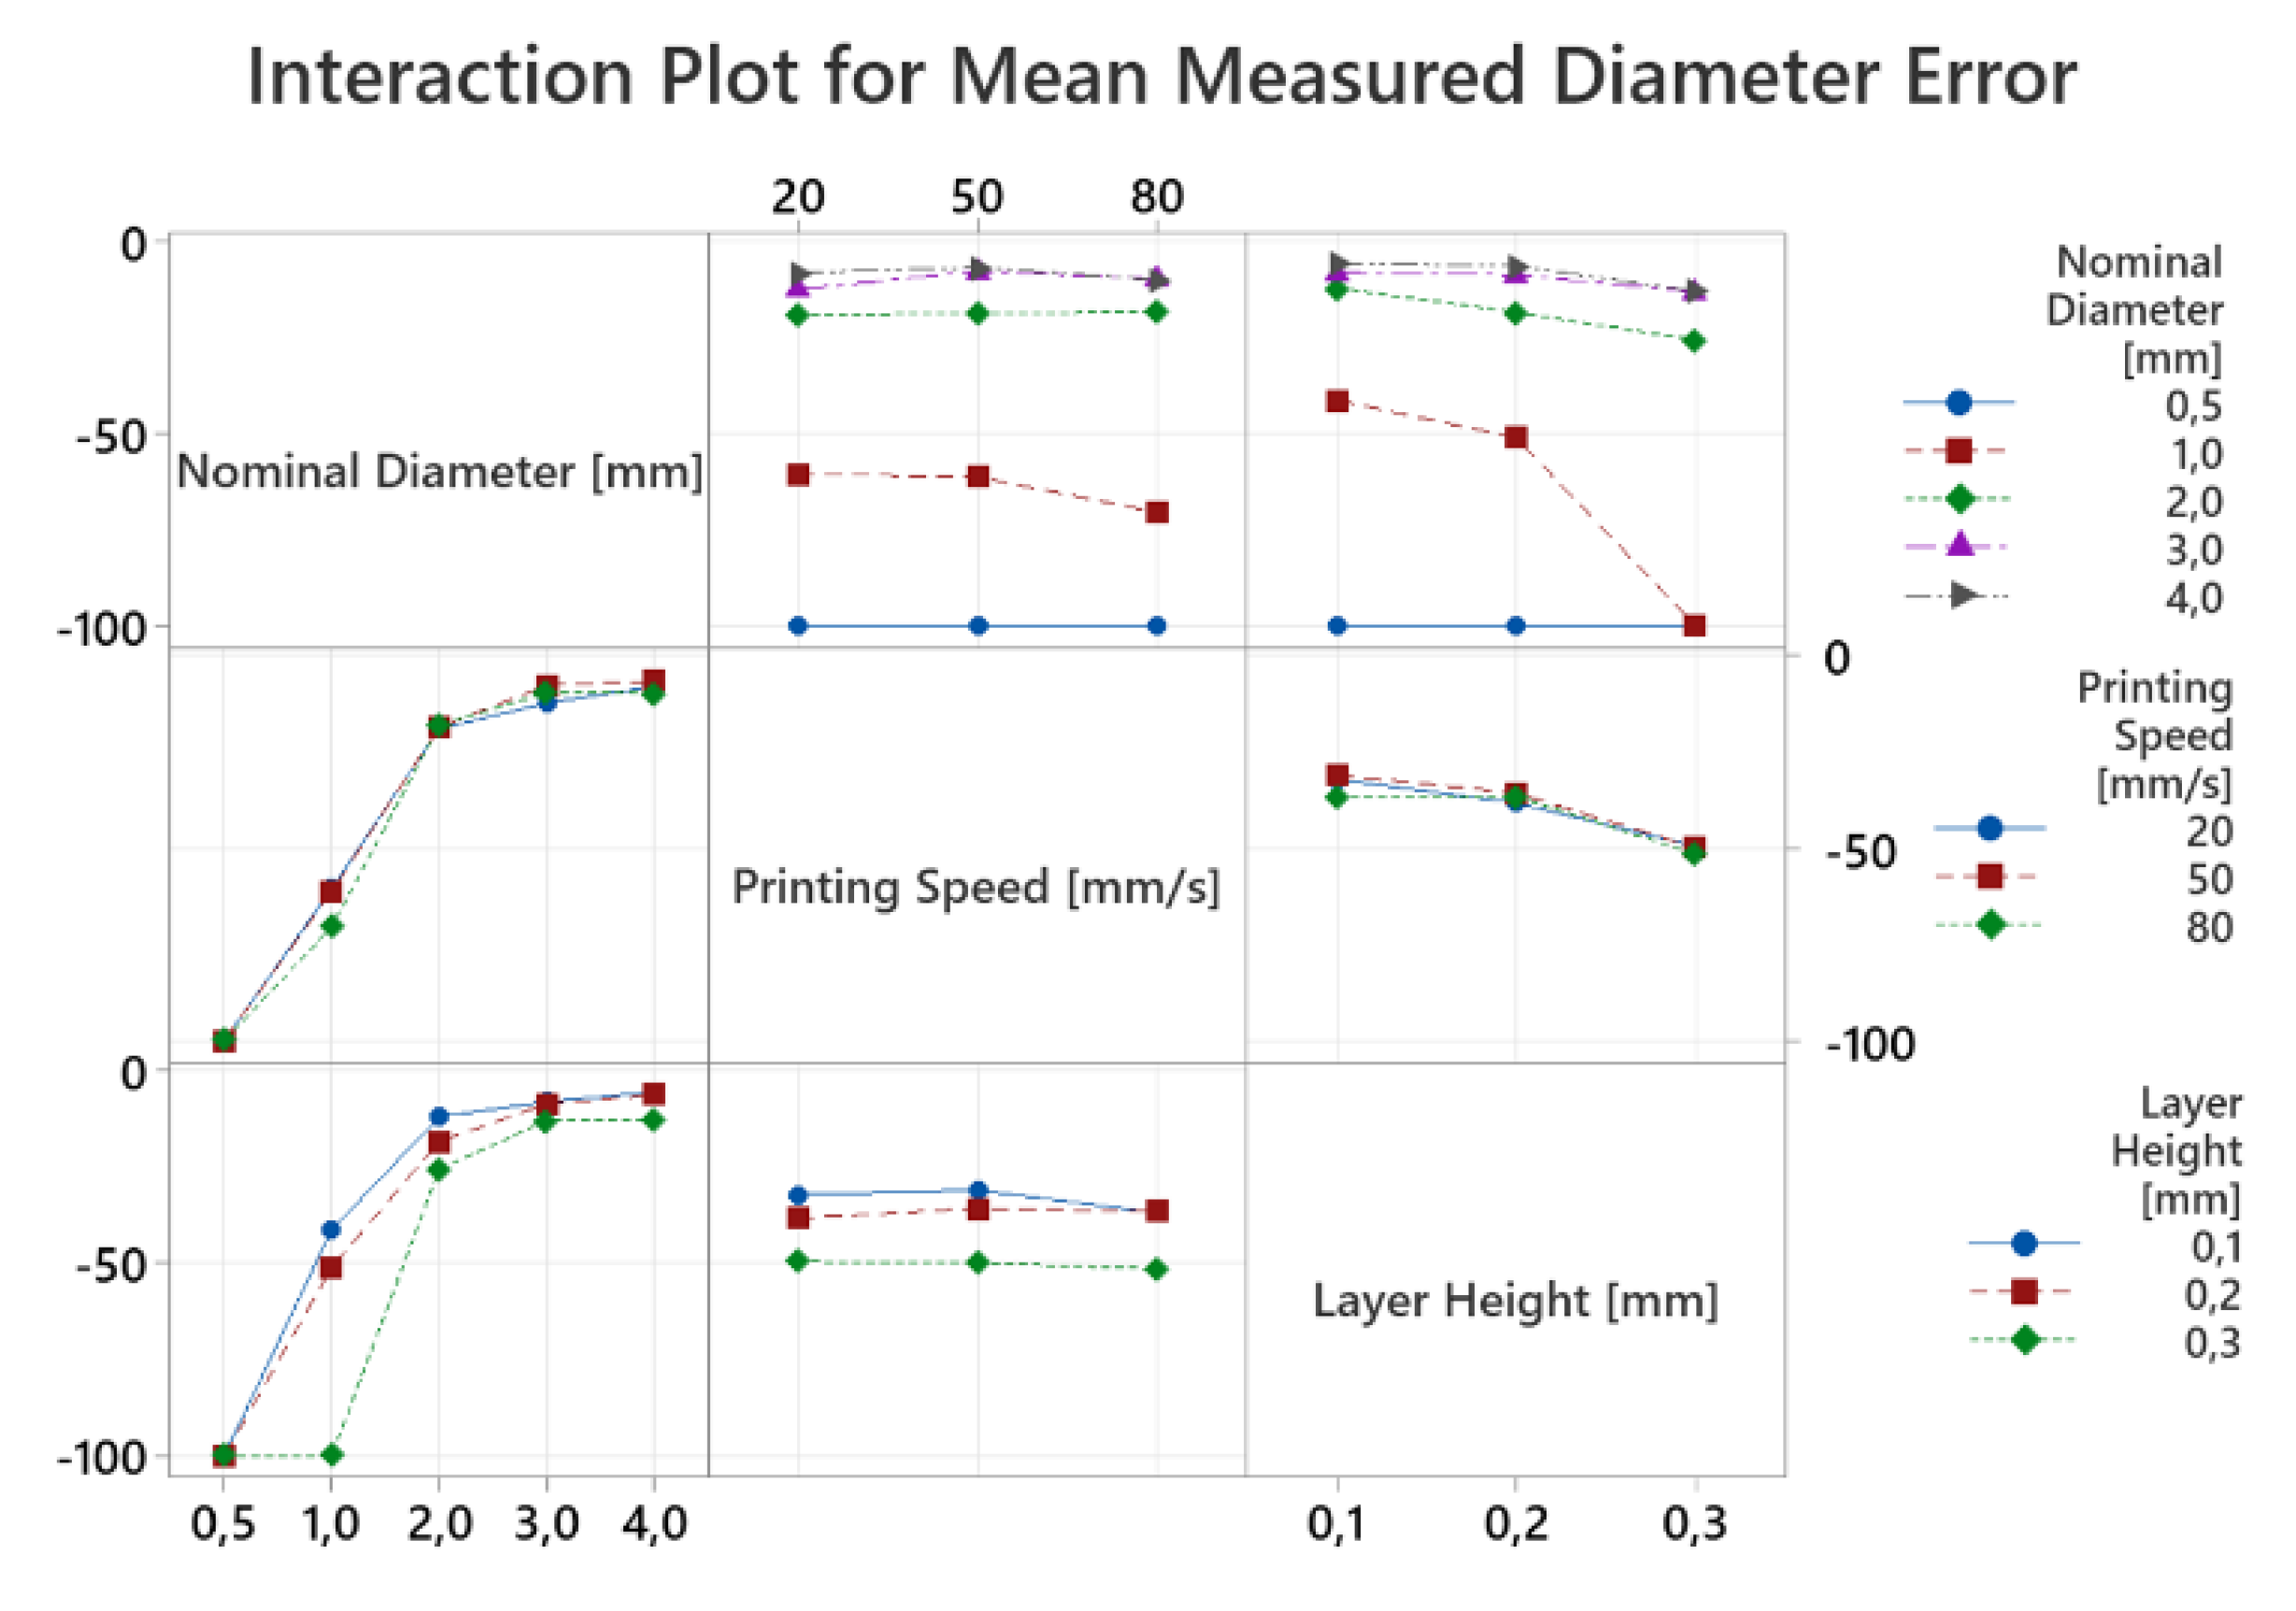
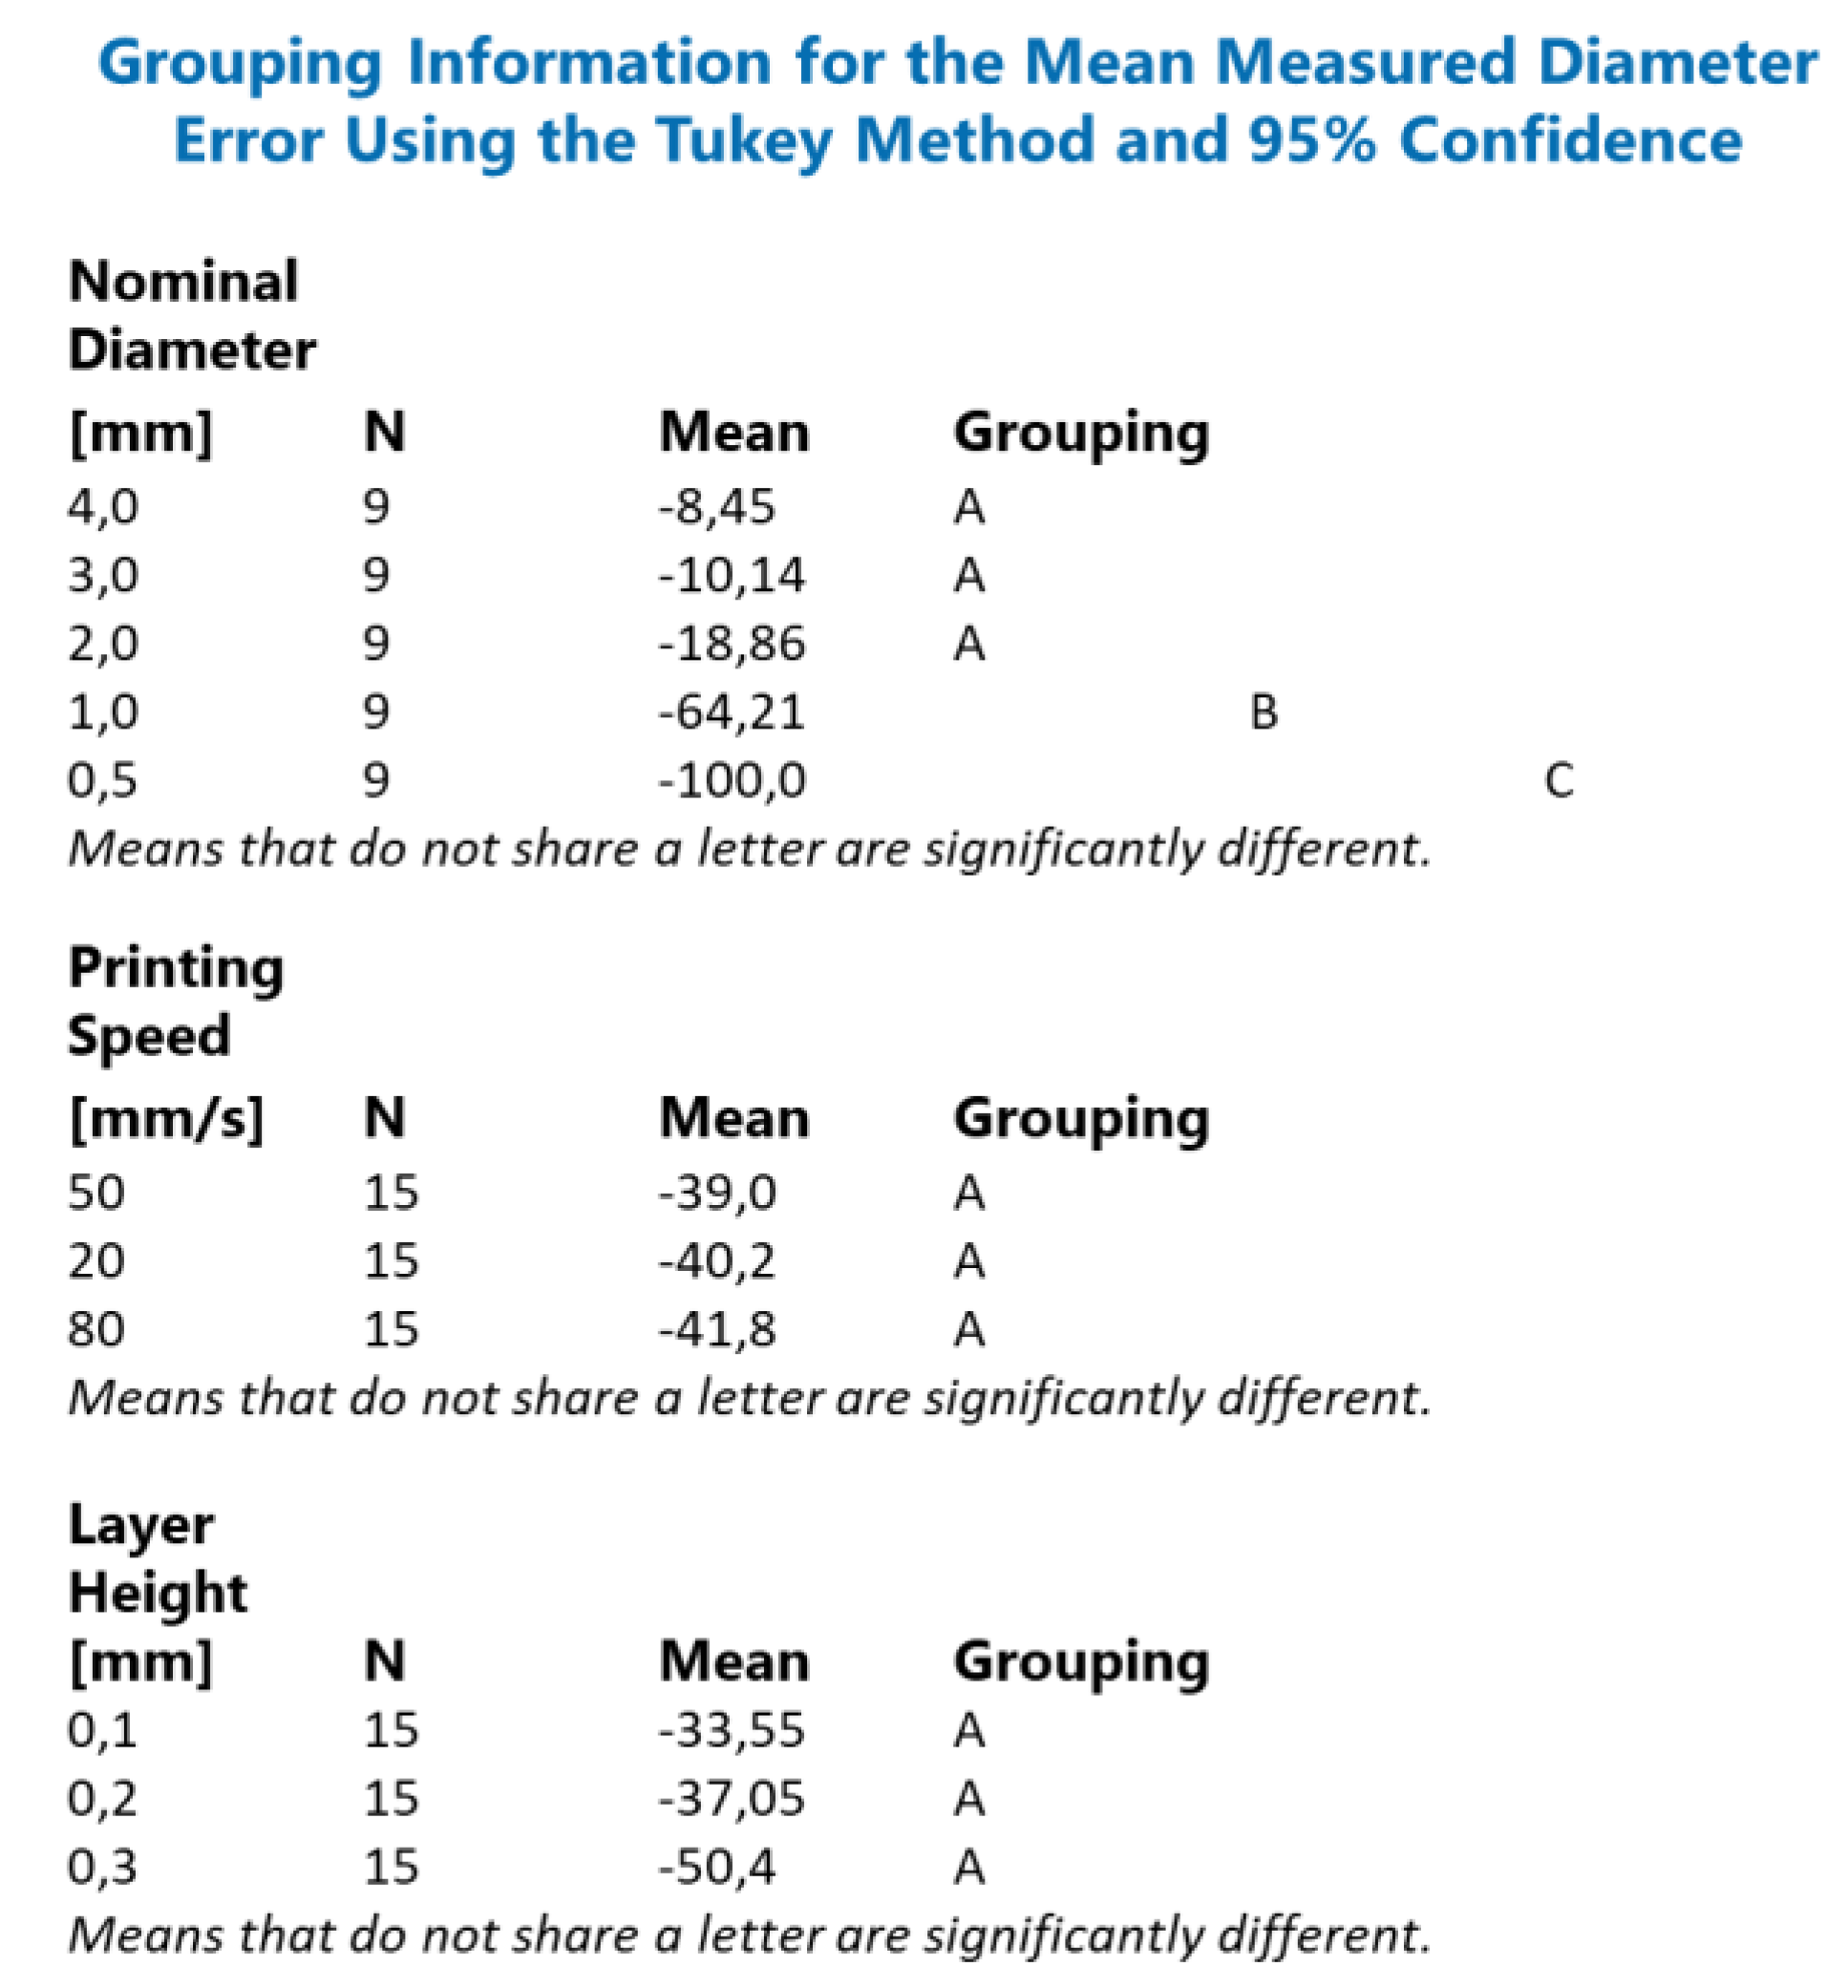
Thus, there is now the need to study if one calibration can improve the prints for all the different printing parameters or if each parameter needs its own calibration. In order to study this, an interaction plot is created and Tukey tests are carried out. In the interaction plot in Figure 4, it is observed that only nominal diameter affects the mean measured diameter error. On the other hand, it seems that the printing speed and layer height have no effect on the mean measured diameter error. These observations are verified by the Tukey tests (Figure 5). According to the Tukey tests, no significant difference is shown for different printing speeds and layer heights. On the other hand, significant differences are observed for different nominal diameters. Specifically, 0.5 mm and 1 mm nominal diameters significantly differ from the 2 mm, 3 mm and 4 mm nominal diameters. This means that one calibration is enough to print for all the different printing speeds and layer heights for the nominal diameters of 2 mm, 3 mm and 4 mm with very good accuracy. On the other hand, different calibrations will be needed to print the 0.5 mm and 1 mm nominal diameters. Nevertheless, as the mean measured diameter errors for the 0.5 mm and 1 mm nominal diameters are very high, it is advisable not to use the current 3D printer for nominal diameters below 2 mm. For the 0.5 mm and 1 mm nominal diameters, it is advisable to use a more advanced 3D printer.
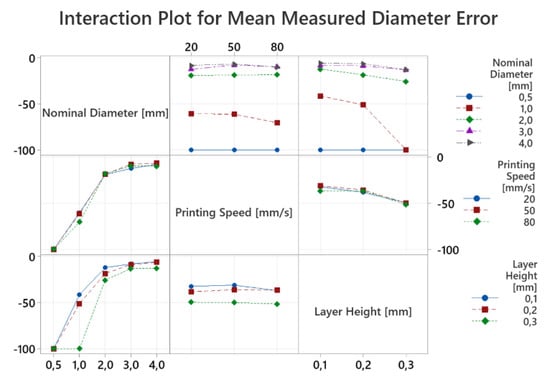
Figure 4.
Interaction plot for mean measured diameter error versus nominal diameter, printing speed and layer height.

Figure 5.
Results of Tukey method for mean measured diameter error versus nominal diameter, printing speed and layer height.
4. Conclusions
In this study, resolution holes of PETG material were built by an FDM printer, according to the ISO ASTM 52902-2021 standard. For this experiment, different nominal diameters (0.5 mm, 1 mm, 2 mm, 3 mm, 4 mm), printing speeds (20 mm/s, 50 mm/s, 80 mm/s) and layer heights (0.1 mm, 0.2 mm, 0.3 mm) were tested. The resolution holes were captured by a microscope and measured by using computer vision. The results were then analyzed statistically. The statistical analysis showed that for all the resolution holes, the mean measured diameter differs significantly from the nominal diameters, however the deviation of the 5 measurements of each set of parameters is small. This leads to the conclusion that the current 3D printer has very good repeatability and, if it is properly calibrated, can print resolution holes of above 2 mm nominal diameter with very high accuracy for all the different values of printing speed and layer height. Moreover, printing speed and layer height do not seem to affect the mean measured diameter error, which is only affected by the nominal diameter. Finally, for resolution holes of 0.5 mm and 1 mm nominal diameter, the current machine is not recommended due to the very high mean diameter errors measured. To print these nominal diameters, it is better to use a more advanced printer.
Author Contributions
Experiments, I.T.C.; Statistical Analysis, V.E.A.; Writing—Original Draft Preparation, V.E.A., I.T.C.; Supervision, A.P.M. All authors have read and agreed to the published version of the manuscript.
Funding
This research received no external funding.
Institutional Review Board Statement
Not applicable.
Informed Consent Statement
Not applicable.
Data Availability Statement
Not applicable.
Conflicts of Interest
The authors declare no conflict of interest.
References
- Srinidhi, M.; Soundararajan, R.; Satishkumar, K.; Suresh, S. Enhancing the FDM infill pattern outcomes of mechanical behavior for as-built and annealed PETG and CFPETG composites parts. Mater. Today Proc. 2020, 45, 7208–7212. [Google Scholar] [CrossRef]
- Khosravani, M.R.; Soltani, P.; Reinicke, T. Fracture and structural performance of adhesively bonded 3D-printed PETG single lap joints under different printing parameters. Theor. Appl. Fract. Mech. 2021, 116, 103087. [Google Scholar] [CrossRef]
- García, E.; Núñez, P.; Caminero, M.; Chacón, J.; Kamarthi, S. Effects of carbon fibre reinforcement on the geometric properties of PETG-based filament using FFF additive manufacturing. Compos. Part B Eng. 2022, 235, 109766. [Google Scholar] [CrossRef]
- Vyavahare, S.; Teraiya, S.; Panghal, D.; Kumar, S. Fused deposition modelling: A review. Rapid Prototyp. J. 2020, 26, 176–201. [Google Scholar] [CrossRef]
- Christodoulou, I.T.; Alexopoulou, V.E.; Karkalos, N.E.; Papazoglou, E.L.; Markopoulos, A.P. On the surface roughness of 3D printed parts with FDM by a low-budget commercial printer. Cut. Tools Technol. Syst. 2022, 52–64. [Google Scholar] [CrossRef]
- Solomon, I.J.; Sevvel, P.; Gunasekaran, J. A review on the various processing parameters in FDM. Mater. Today Proc. 2020, 37, 509–514. [Google Scholar] [CrossRef]
- Durgashyam, K.; Reddy, M.I.; Balakrishna, A.; Satyanarayana, K. Experimental investigation on mechanical properties of PETG material processed by fused deposition modeling method. Mater. Today Proc. 2019, 18, 2052–2059. [Google Scholar] [CrossRef]
- Srinivasan, R.; Ruban, W.; Deepanraj, A.; Bhuvanesh, R.; Bhuvanesh, T. Effect on infill density on mechanical properties of PETG part fabricated by fused deposition modelling. Mater. Today Proc. 2020, 27, 1838–1842. [Google Scholar] [CrossRef]
- Mohanty, A.; Nag, K.S.; Bagal, D.K.; Barua, A.; Jeet, S.; Mahapatra, S.S.; Cherkia, H. Parametric optimization of parameters affecting dimension precision of FDM printed part using hybrid Taguchi-MARCOS-nature inspired heuristic optimization technique. Mater. Today Proc. 2022, 50, 893–903. [Google Scholar] [CrossRef]
- Mwema, F.; Akinlabi, E.; Fatoba, O. Visual assessment of 3D printed elements: A practical quality assessment for home-made FDM products. Mater. Today Proc. 2019, 26, 1520–1525. [Google Scholar] [CrossRef]
- Maurya, S.; Malik, B.; Sharma, P.; Singh, A.; Chalisgaonkar, R. Investigation of different parameters of cube printed using PLA by FDM 3D printer. Mater. Today Proc. 2022, 64, 1217–1222. [Google Scholar] [CrossRef]
- Zharylkassyn, B.; Perveen, A.; Talamona, D. Effect of process parameters and materials on the dimensional accuracy of FDM parts. Mater. Today Proc. 2021, 44, 1307–1311. [Google Scholar] [CrossRef]
- AS ISO/ASTM 52902:2021; Additive Manufacturing—Test Artifacts—Geometric Capability Assessment of Additive Manufacturing Systems. ISO: Geneva, Switzerland; Standards Australia: Sydney, Australia, 2021.

Publisher’s Note: MDPI stays neutral with regard to jurisdictional claims in published maps and institutional affiliations. |
© 2022 by the authors. Licensee MDPI, Basel, Switzerland. This article is an open access article distributed under the terms and conditions of the Creative Commons Attribution (CC BY) license (https://creativecommons.org/licenses/by/4.0/).