Abstract
An effective and reliable grounding system is a necessary parameter for ensuring the safety of test equipment and personnel working in a high-voltage laboratory. This paper analyzes the performance of the grounding system of a high-voltage laboratory located at USPCAS-E, NUST. By using grounding system analysis techniques based on the IEEE standard 80-2013, and programs based on soil-layer models, the grounding system of this high-voltage laboratory is analyzed and solutions to the issues encountered are recommended.
1. Introduction
High-voltage engineering is a specialized area of electrical engineering that has many exciting and challenging aspects. While performing tests in a high-voltage laboratory, one of the most critical parameters is a reliable grounding system for ensuring the safety of the personnel and the equipment available in the laboratory [1]. During breakdown testing, rapid voltage and current variations can occur that may induce transient currents in the earthing connections [2]. The earthing system provides a safe path for fault currents and keeps the step potential and touch potential within safe limits. A good grounding system should have low resistance in power frequency tests and undergo a low potential rise in high frequency tests [3]. The magnitude, waveshape and frequency of the current are important for the grounding system. Based on the nature of the fault current, changes in the soil characteristics can reduce the ground potential rise [4].
Different earthing methods are currently in practice as per their benefits based on the soil conditions and reliability of the grounding system [5]. Copper or galvanized iron in the form of rods, plates, pipes and strips are used in vertical and horizontal configurations to limit the ground potential rise (GPR) within an allowable range [6]. Vertical grounding rods are used either as main electrodes or as assisting electrodes to reduce the earth resistance and improve the performance of the system for transients and high frequencies [7]. Increasing the length of the grounding rods improves the overall resistance of the entire grounding system. Improvements in the touch potential and the step potential are also observed upon increasing both the quantity and the length of the grounding rods [8].
The investigation of soil resistivity is necessary for evaluating the soil composition and the homogeneity of the soil structure. For soil with a higher clay content, apparent soil resistivity decreases when an impulse is applied to the grounding electrode [9,10]. Soil resistivity is affected by soil composition, compactness, mineral content, moisture and temperature. The earthing impedance as well as the soil resistivity may show seasonal variations due to changes in the soil temperature and water content [11,12,13]. The improper design of the grounding system can result in the interference and under-operation of the equipment used in the laboratory [14]. For our grounding system analysis, a cost-effective and reliable earthing solution, the IEEE-80 standards “Guide for Safety in AC Substation Grounding” [15] and the ETAP software tool were used as per the specifications provided in the standards.
2. Grounding System of NUST’s High-Voltage Laboratory
The main test hall has a 400 kV, 20 kJ impulse generator, a high-voltage construction kit with an impulse of 200 kV AC, 280 kV DC and 250 kV, and a dielectric breakdown tester. The grounding system consists of four 120 m deep-driven grounding rods named ‘High Voltage Earthing’(HVE1-4). HVE1 is connected to the HV kit and HVE2 is allocated to the control room computers and measurement instruments. HVE3 is connected to the impulse generator, while HVE4 is connected to the dielectric breakdown tester and the ‘Building Structure Earthing’ (BSE1-4). The floor of the laboratory is constructed with reinforced concrete of 0.2 m pitch steel bar mesh connected to HVE4 at four points. The building is also protected with four lightning arrestors on the roof of the building. Figure 1 shows the basic layout of earthing system in the high voltage laboratory.
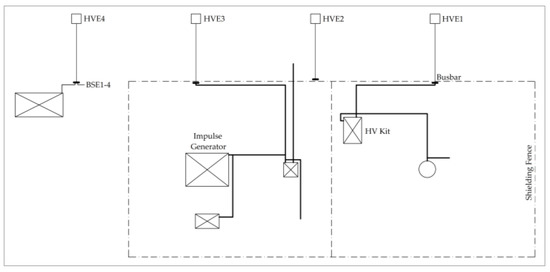
Figure 1.
Layout of the grounding system in the high-voltage laboratory.
3. Methodology
3.1. Soil Resistivity
Soil resistivity has an important role in determining the resistance of the grounding system. It determines the amount of current that can flow into the ground when a fault current is experienced or when charged high-voltage equipment is grounded during or after testing. A field test is performed to measure the soil resistivity and resistance [16]. Equation (1) is used to identify the soil resistivity using the data collected from the field test:
where ‘ρ’ is the soil resistivity (Ω-m), ‘R’ is the soil resistance (Ω), and ‘a’ is the spacing (m) between the test instrument probes.
ρ = 2πRa
3.2. Tolerable Range of the Touch and Step Voltages
There is a chance of electric shock if the laboratory personnel come into contact with a live metal structure, if the touch and step voltages are not within the tolerable ranges. Touch voltages are specified as the voltage appearing between the live conductor or metal structure and the person in contact, while the step voltages are specified as those that appear between the feet at a distance of 1 m without any contact with a grounded object. Equations (2) and (3) are used for the touch and step voltage calculations, where Cs is the derating factor for the surface layer resistivity, ρs is the surface resistivity, and ts is the current flow duration:
3.3. Ground Potential Rise (GPR)
The ground potential rise of the earthing system can reach dangerous levels during testing or fault conditions that may harm personnel in the laboratory. It can also increase the potential of metal structures in the vicinity of the laboratory through ground or buried metal structures [17]. The IEEE 80 standards suggest the use of Equation (4) for GPR:
where Ig is the ground fault current and Rg is the grounding resistance [15].
The Ground Grid Systems module of the ‘Electrical Transient Analyzer Program’ (ETAP) is used for the fast and accurate design, simulation and analysis of the touch potential, step potential and GPR of the grounding system. The system can be designed based on the Finite Element Method or the IEEE-80 method [15].
4. Results and Discussion
Vertical electrical sounding was performed to obtain the detailed picture of the ground strata using AGI MiniSting™ R1 [18]. Figure 2 shows the apparent soil resistivity, while Table 1 represents the recorded data using the Wenner method in the manual mode of the instrument. Figure 2 illustrates that the soil resistivity of the top layer was good, but as the depth increased, many patches appeared, indicating high resistivity due to rocky areas, which can be seen in Figure 2b. Deep-driven grounding rods are recommended at such sites to improve the reliability of the grounding system and to reach the deeper layers of the soil [4].
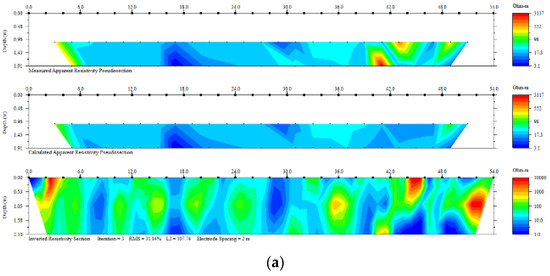
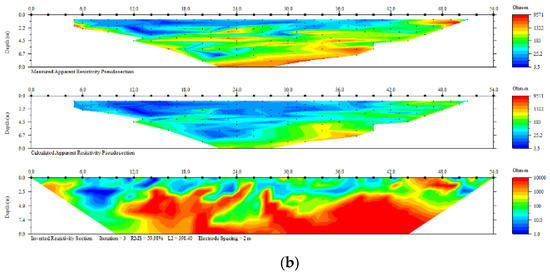
Figure 2.
Apparent soil resistivity at test site. (a) Up to 2 m in depth. (b) Up to 10 m in depth.

Table 1.
Soil resistivity and resistance measured using the manual mode of AGI MiniSting™ R1.
4.1. Simulation of the Grounding System in ETAP
Simulations were performed in ETAP to obtain the tolerable ranges of the touch and step potentials summarized in Table 2. When the grounding grid was connected to the grounding rods (Table 2, ↓), the touch potential decreased, while the step potential of the system increased slightly (Table 2, ↑) but remained in the tolerable range. The ground potential rise of both systems was below the step potential, as per the recommendations given in the IEEE standards [15].
Table 2.
Tolerable and expected range of step and touch potentials and the ground potential rise.
Figure 3 summarizes the simulation results of the touch and step potentials for the grounding system with and without the grounding rods. The touch potential considerably decreased in the whole area of the grounding system (Figure 3b) when the grounding rods were connected to the grounding grid [19]. Insights from Figure 3c,d show that the step voltages were lower around the area where grounding rods were located (Figure 3d, right) and connected to the grounding grid [4].
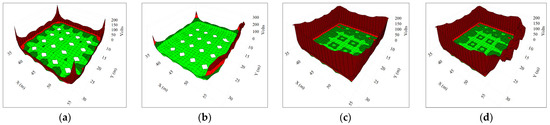
Figure 3.
(a) Touch potential without grounding rods. (b) Touch potential with grounding rods. (c) Step potential without grounding rods. (d) Step potential with grounding rods.
4.2. Parallel Effect of the Deep-Driven Grounding Rods
A study was performed by connecting deep-driven grounding rods in parallel to identify any improvements in the earthing impedance. The individual resistance of the grounding rods measured with the ‘KYORITSU KEW 4105A Digital Earth Tester’ are shown in Table 3.
Table 3.
Individual resistance of the grounding rods using KEW 4105A Digital Earth Tester.
Table 4 shows improvement in the earthing impedance when two or more grounding rods were connected in a parallel configuration, but the HVE3 and HVE4 pair had a higher impedance. The reason for this result is that soil is a heterogeneous mixture of clay, sand, water, minerals and other components. To simplify the analysis, we primarily considered a two-layer or multi-layer soil model [15]. The resistance of the complete grounding system, while all grounding rods were connected to the grounding grid, was 0.86 Ω.
Table 4.
Resistances measured in parallel configurations using the KEW 4105A Digital Earth Tester.
Tripping of the high-voltage construction kit occurred, due to current loop formation in the grounding system, as high-voltage and low-voltage earthing were interconnected at some locations. Calibration errors occurred if any equipment was running in the metal shed workshop adjacent to the laboratory because the main transformer was shared between the lab and the workshop.
5. Conclusions
An experimental analysis of the high-voltage laboratory was performed using AGI MiniSting R1 and the KYORITSU KEW 4105A Digital Earth Tester. ETAP software was used to simulate the results for the grounding system in two scenarios. In the first scenario, grounding rods were connected to the grounding grid; in the second scenario, grounding rods were not connected to the grounding grid. The system showed lower resistance, GPR and touch potential in the second scenario, when grounding rods were connected to the grounding grid. Instead of using grounding rods as separate earthing points for specialized purposes, as described in Section 2, a single-point grounding system is recommended, as it provides multiple paths for the fault currents into the ground. However, high-voltage earthing and low-voltage earthing should remain separate.
To avoid any interference and calibration errors, an isolation transformer of 25 kVA is recommended for a high-voltage construction kit, and further investigation of this matter is in progress. The main transformer should not be oversized, with the exception of future expansions, as it increases the fault current capacity, hence increasing the ground potential rise.
Author Contributions
Conceptualization, M.B. and A.K.; methodology, M.B. and S.A.Q.; software, M.B.; validation, M.B., A.K. and N.A.; formal analysis, M.B. and S.A.Q.; investigation, M.B. and S.A.Q.; resources, M.B. and N.A.; data curation, M.B. and N.A.; writing—original draft preparation, M.B. and S.A.Q.; writing—review and editing, A.K. and N.A.; visualization, M.B.; supervision, A.K.; funding acquisition, A.K. All authors have read and agreed to the published version of the manuscript.
Funding
This research received no external funding.
Institutional Review Board Statement
Not applicable.
Informed Consent Statement
Not applicable.
Data Availability Statement
The data presented in this study are available on request from the corresponding author.
Conflicts of Interest
The authors declare no conflict of interest.
References
- Alyami, S. Grid Grounding Calculations for a 132-KV Substation Using Soil Backfilling. IEEE Access 2019, 7, 104933–104940. [Google Scholar] [CrossRef]
- Kind, D. An Introduction to High-Voltage Experimental Technique, 1st ed.; Vieweg: Kranzberg, Germany, 1978. [Google Scholar]
- Chalaki, M.R.; Ahmed, Z.; Robinson, I.; Kluss, J.V. Performance Evaluation of High Voltage Laboratory Grounding. In Proceedings of the 2018 IEEE Electrical Insulation Conference, San Antonio, TX, USA, 17–20 June 2018; pp. 212–215. [Google Scholar] [CrossRef]
- Worley, V.F.H. Design of The Ohio State University High Voltage Laboratory. Ph.D. Thesis, The Ohio State University, Columbus, OH, USA, 1987. [Google Scholar]
- Nassereddine, M.; Rizk, J.; Hellany, A. How to design an effective earthing system to ensure the safety of the people. In Proceedings of the 2009 International Conference on Advances in Computational Tools for Engineering Applications, Beirut, Lebanon, 15–17 July 2009; pp. 416–421. [Google Scholar] [CrossRef]
- Poulimenos, G.; Damianaki, K.D.; Christodoulou, C.A.; Androvitsaneas, V.P.; Gonos, I.F. Examination of the effectiveness of the grounding systems of distribution substations. In Proceedings of the 2018 IEEE International Conference on High Voltage Engineering and Application, Athens, Greece, 10–13 September 2019. [Google Scholar]
- Mousa, S.; Griffiths, H.; Harid, N.; Haddad, A. Experimental investigation of high frequency and transient performance of earth rod systems. In Proceedings of the 2012 International Conference on Lightning Protection (ICLP), Vienna, Austria, 2–7 September 2012. [Google Scholar] [CrossRef]
- Unde, M.G.; Kushare, B.E. Cost effective design of grounding grid using ground rods—A case study. In Proceedings of the 2012 IEEE fifth power India conference, Haryana, India, 19–22 December 2012. [Google Scholar] [CrossRef]
- Nor, N.M.; Haddad, A.; Griffiths, H. Performance of earthing systems of low resistivity soils. IEEE Trans. Power Deliv. 2006, 21, 2039–2047. [Google Scholar] [CrossRef]
- Sima, W.; Wu, P.; Yuan, T.; Yang, Q.; Zhu, B.; Ai, L. A method for the interpretation of soil structure in the vicinity of grounding system. In Proceedings of the 2014 ICHVE International Conference on High Voltage Engineering and Application, Poznan, Poland, 8–11 September 2014. [Google Scholar] [CrossRef]
- Singh, J.; Sood, Y.R.; Jarial, R.K.; Verrma, P. Earthing of High Voltage Laboratory. Int. J. Elect. Power Eng. 2007, 1, 353–358. [Google Scholar]
- Kusim, A.S.; Abdullah, N.E.; Hashim, H.; Kutty, S.B. Effects of salt content on measurement of soil resistivity. In Proceedings of the 2013 IEEE 7th International Power Engineering and Optimization Conference (PEOCO), Langkawi, Malaysia, 3–4 June 2013; pp. 124–128. [Google Scholar] [CrossRef]
- Khan, Y.; Malik, N.H.; Al-Arainy, A.A.; Qureshi, M.I.; Pazheri, F.R. Efficient use of low resistivity material for grounding resistance reduction in high soil resistivity areas. In Proceedings of the TENCON 2010-2010 IEEE Region 10 Conference, Fukuoka, Japan, 21–24 November 2010; pp. 620–624. [Google Scholar]
- Pungsiri, B.; Chotigo, S. Design and construction of grounding system in high voltage laboratory at KMUTT. In Proceedings of the 2008 International Conference on Condition Monitoring and Diagnosis, Beijing, China, 21–24 April 2008. [Google Scholar]
- IEEE Standard 80-2015; IEEE Guide for Safety In AC Substation Grounding. IEEE Society: New York, NY, USA, 2015.
- Boys, P. Resistivity testing for earthing safety. In Proceedings of the 2016 Down to Earth Conference (DTEC), Hunter Valley, NSW, Australia, 13–15 September 2016. [Google Scholar] [CrossRef]
- Wu, A.Y.; Meliopoulos, A.P. Analysis of ground potential gradients around power substations. In Proceedings of the Annual Technical Conference on Pulp and Paper Industry, Seattle, WA, USA, 18–22 June 1990; pp. 56–66. [Google Scholar] [CrossRef]
- AGI MiniSting R1. Available online: https://www.agiusa.com/ministing (accessed on 17 February 2022).
- Zeng, R.; He, J.; Wang, Z.; Gao, Y.; Sun, W.; Su, Q. Analysis on influence of long vertical grounding electrodes on grounding system for substation. In Proceedings of the PowerCon 2000. 2000 International Conference on Power System Technology, Perth, WA, Australia, 4–7 December 2000; Volume 3, pp. 1475–1480. [Google Scholar]
Publisher’s Note: MDPI stays neutral with regard to jurisdictional claims in published maps and institutional affiliations. |
© 2022 by the authors. Licensee MDPI, Basel, Switzerland. This article is an open access article distributed under the terms and conditions of the Creative Commons Attribution (CC BY) license (https://creativecommons.org/licenses/by/4.0/).