Design and Simulation of a Point-of-Care Microfluidic Device for Acoustic Blood Cell Separation †


Abstract
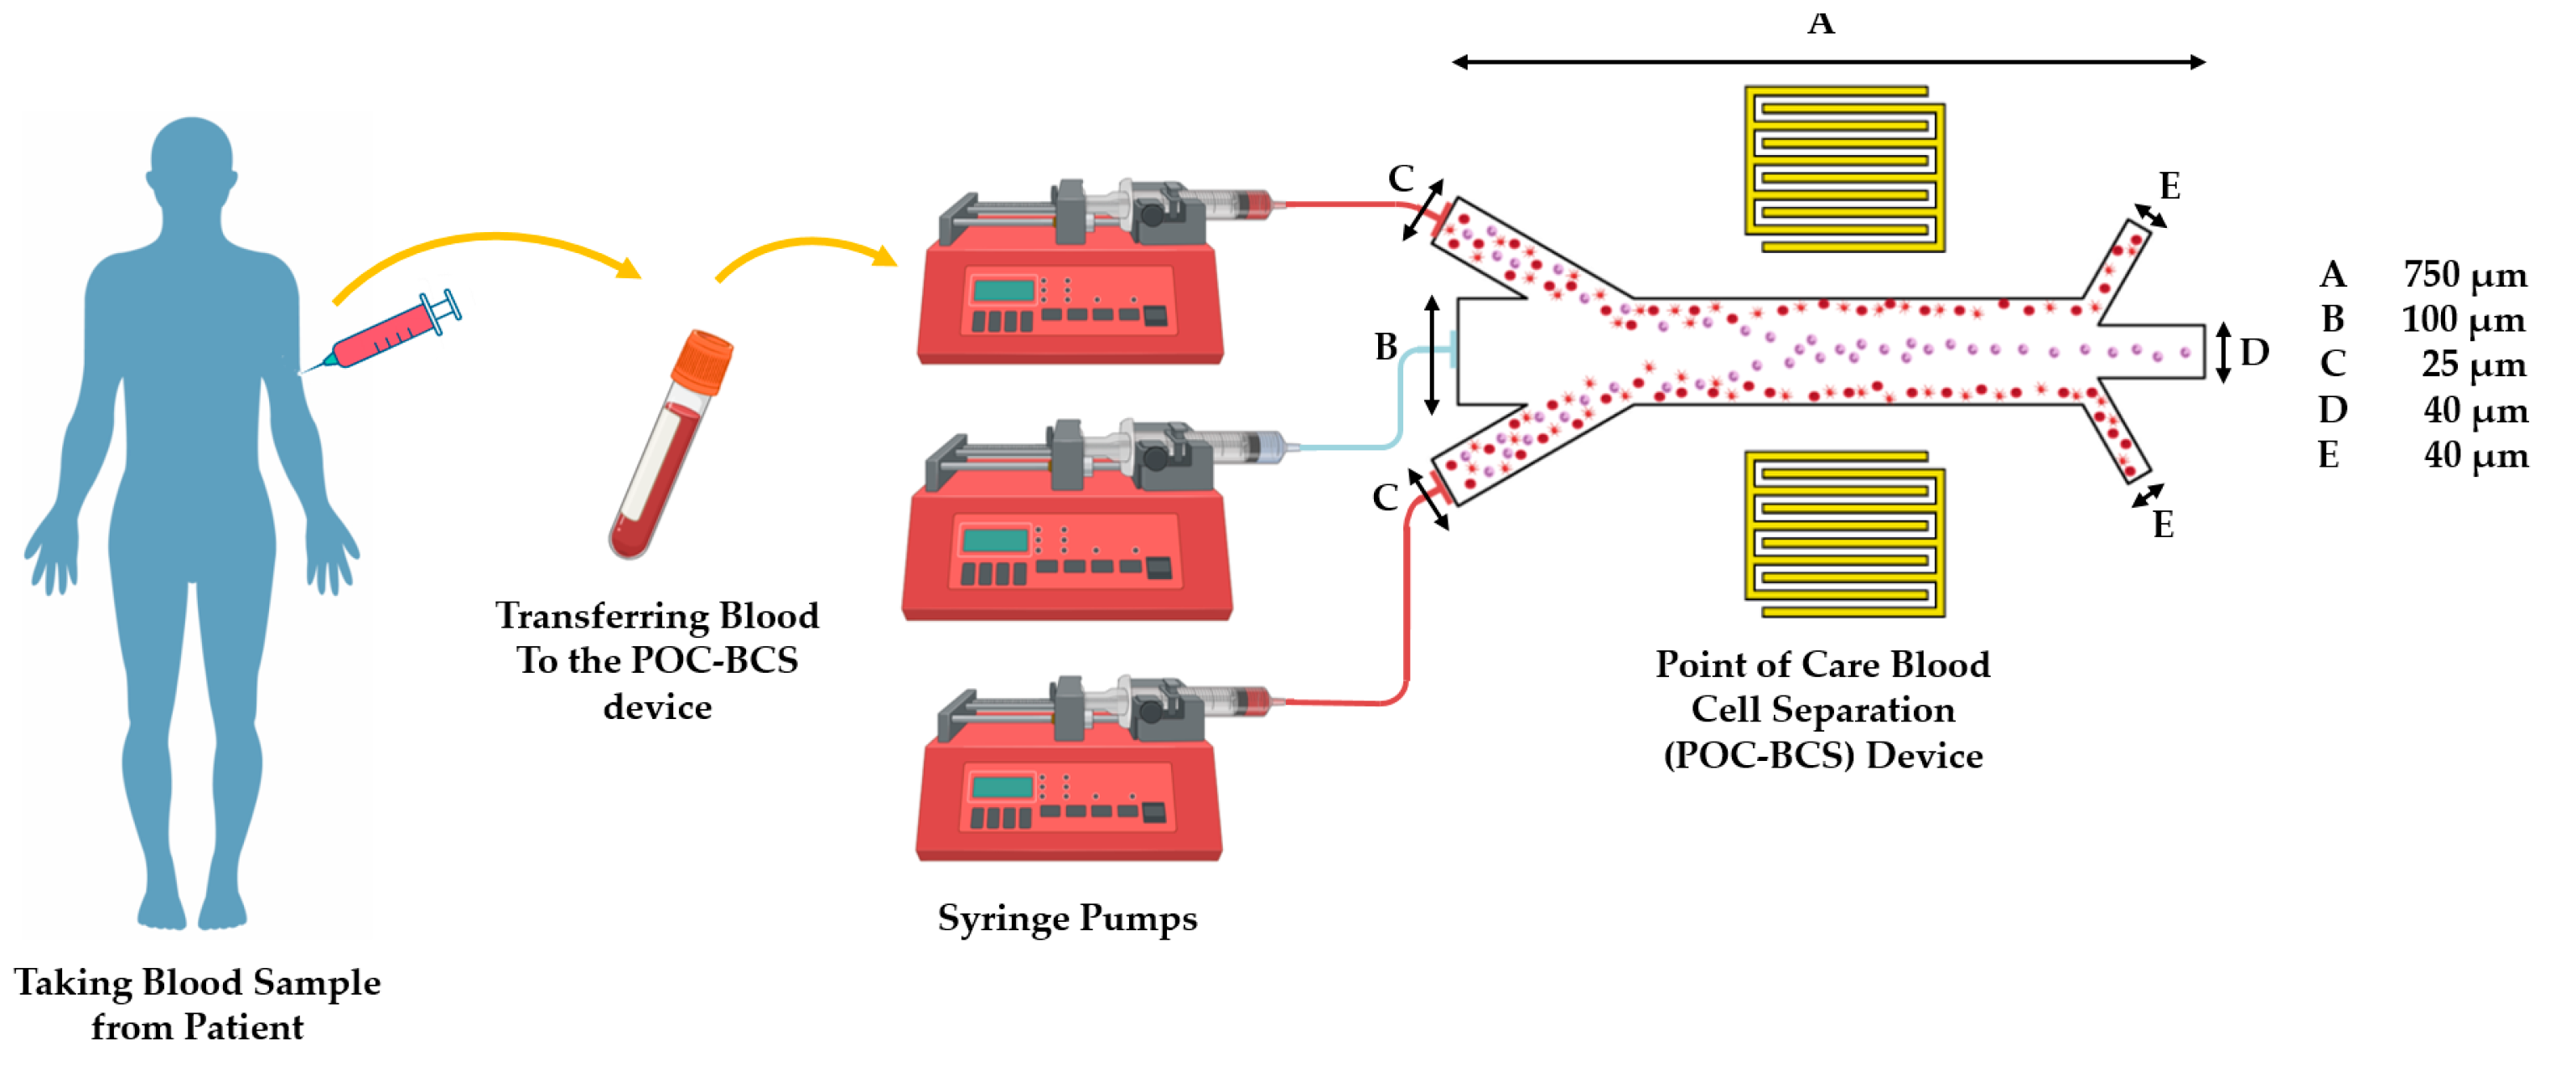
:1. Introduction
2. Material and Methods
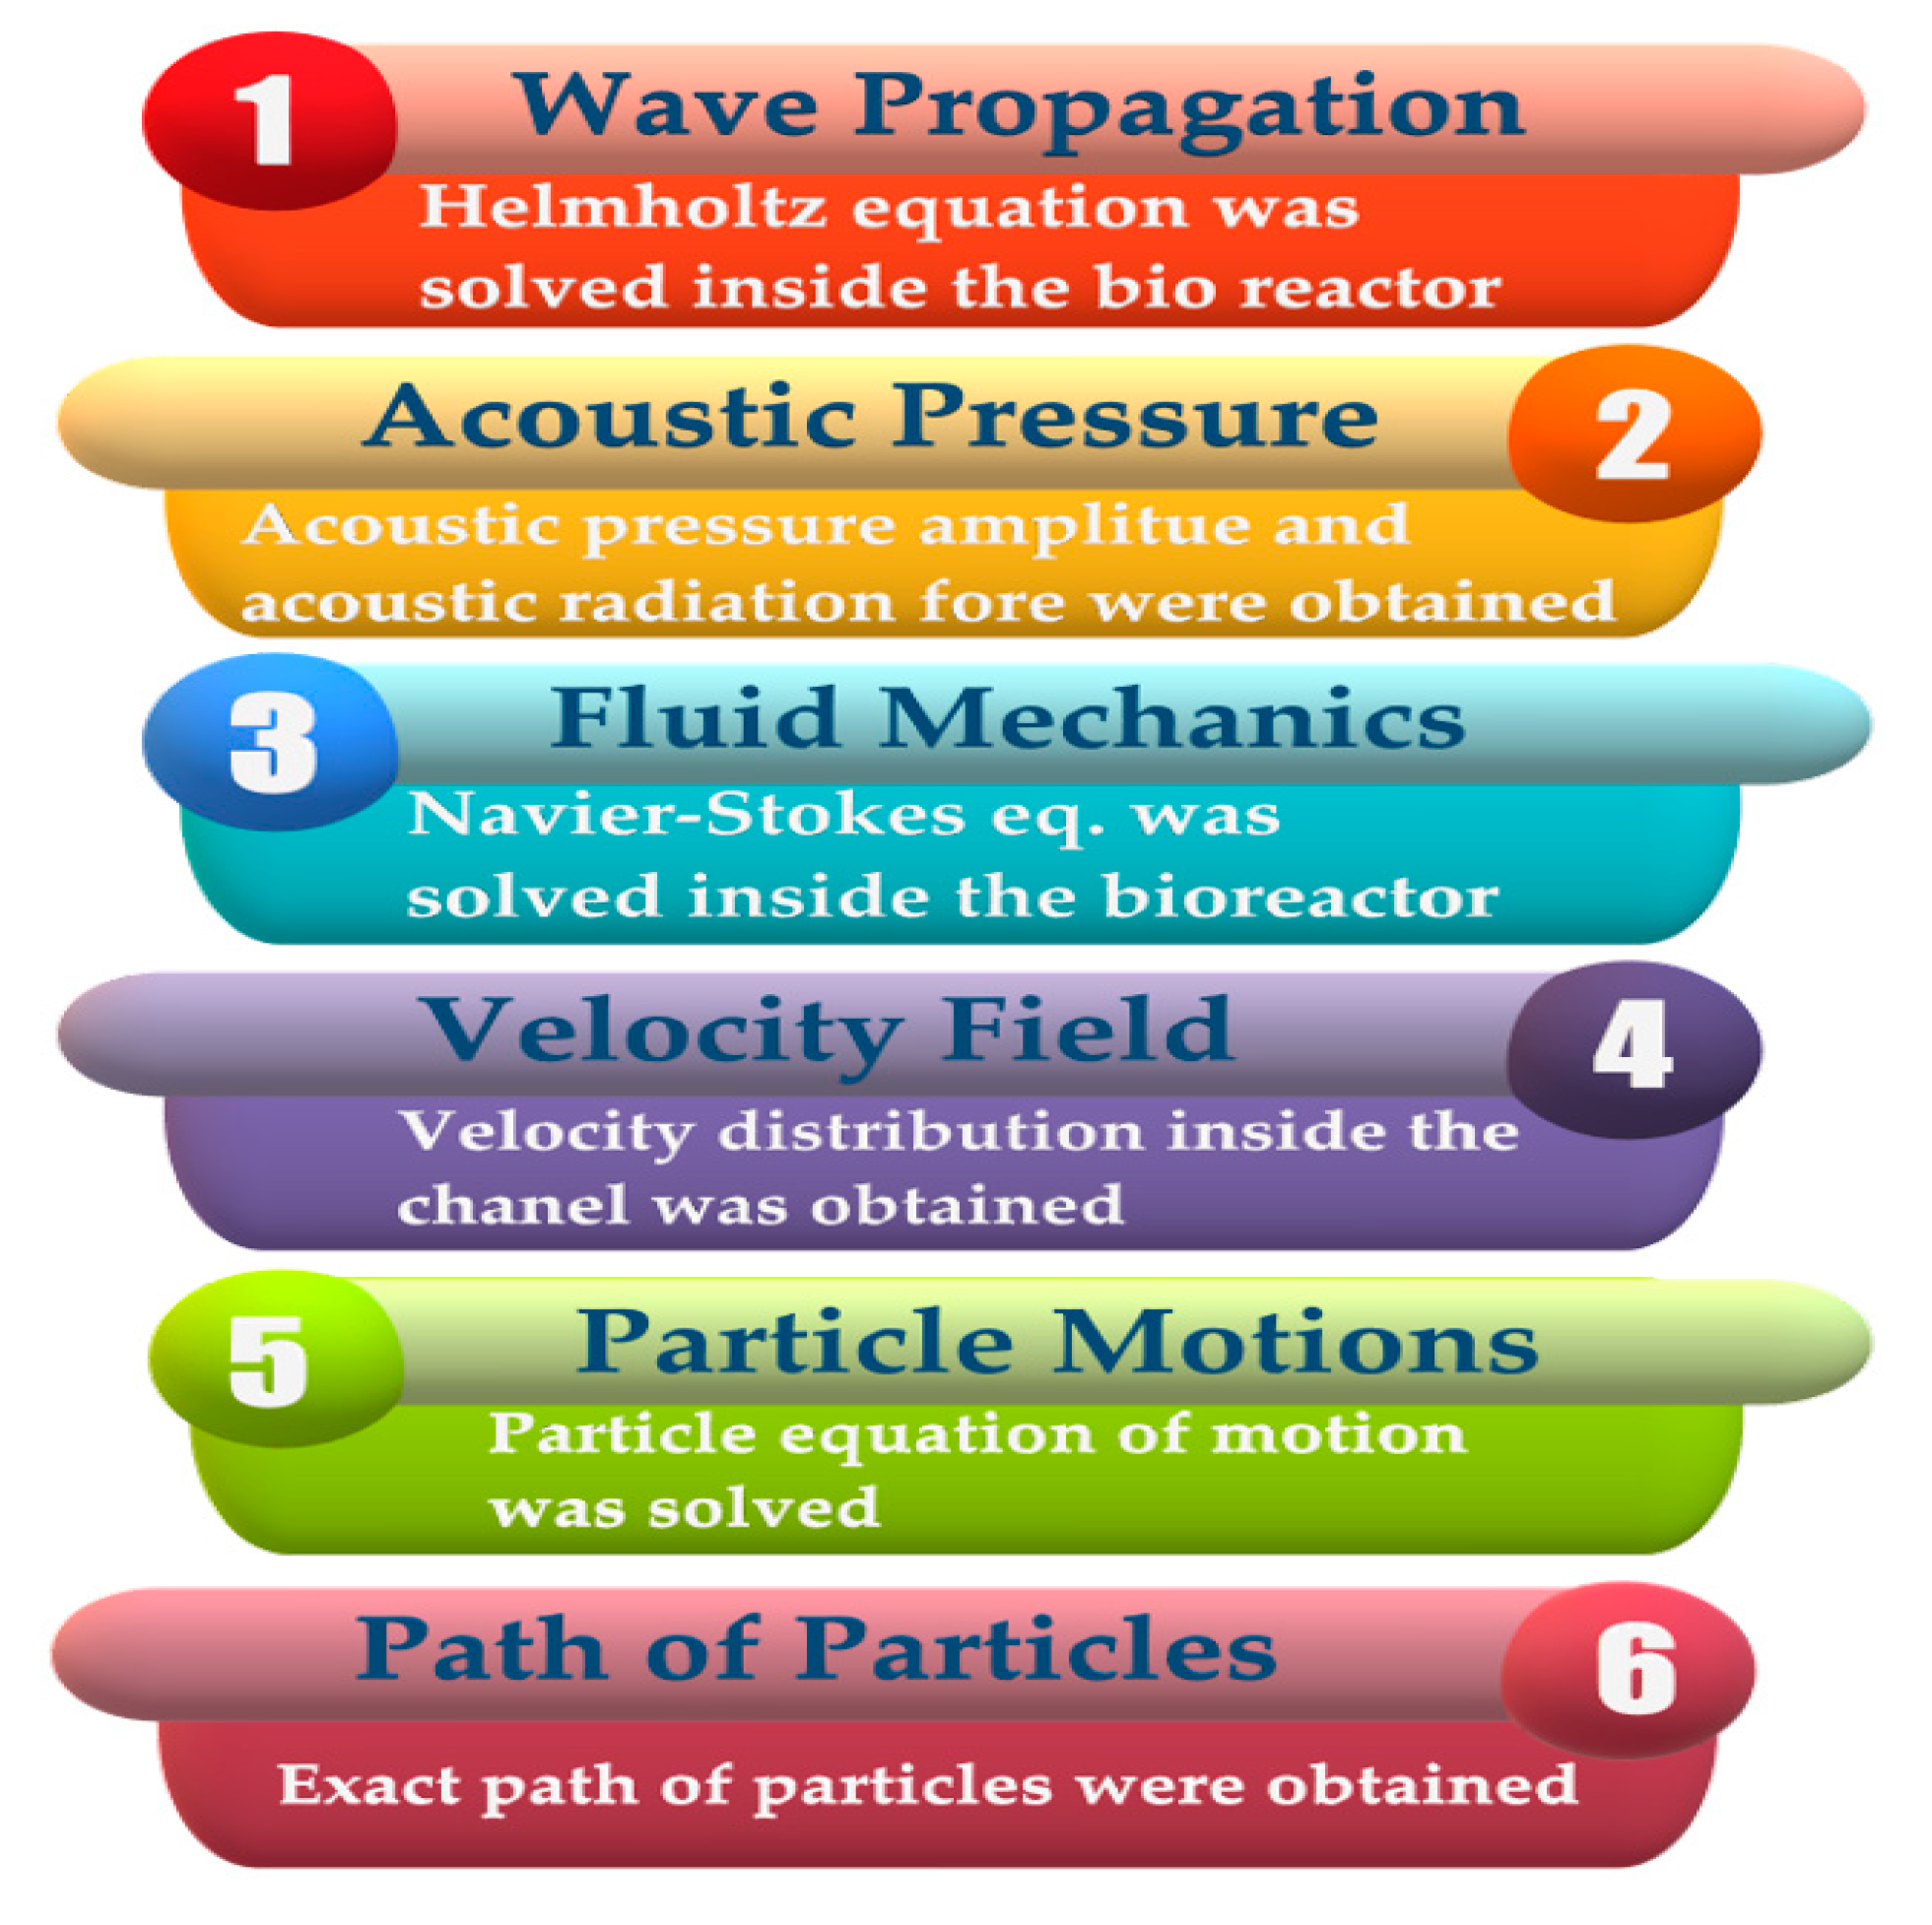
2.1. Governing Equations
2.1.1. Wave Propagation
2.1.2. Fluid Mechanics
2.1.3. Particle Motions
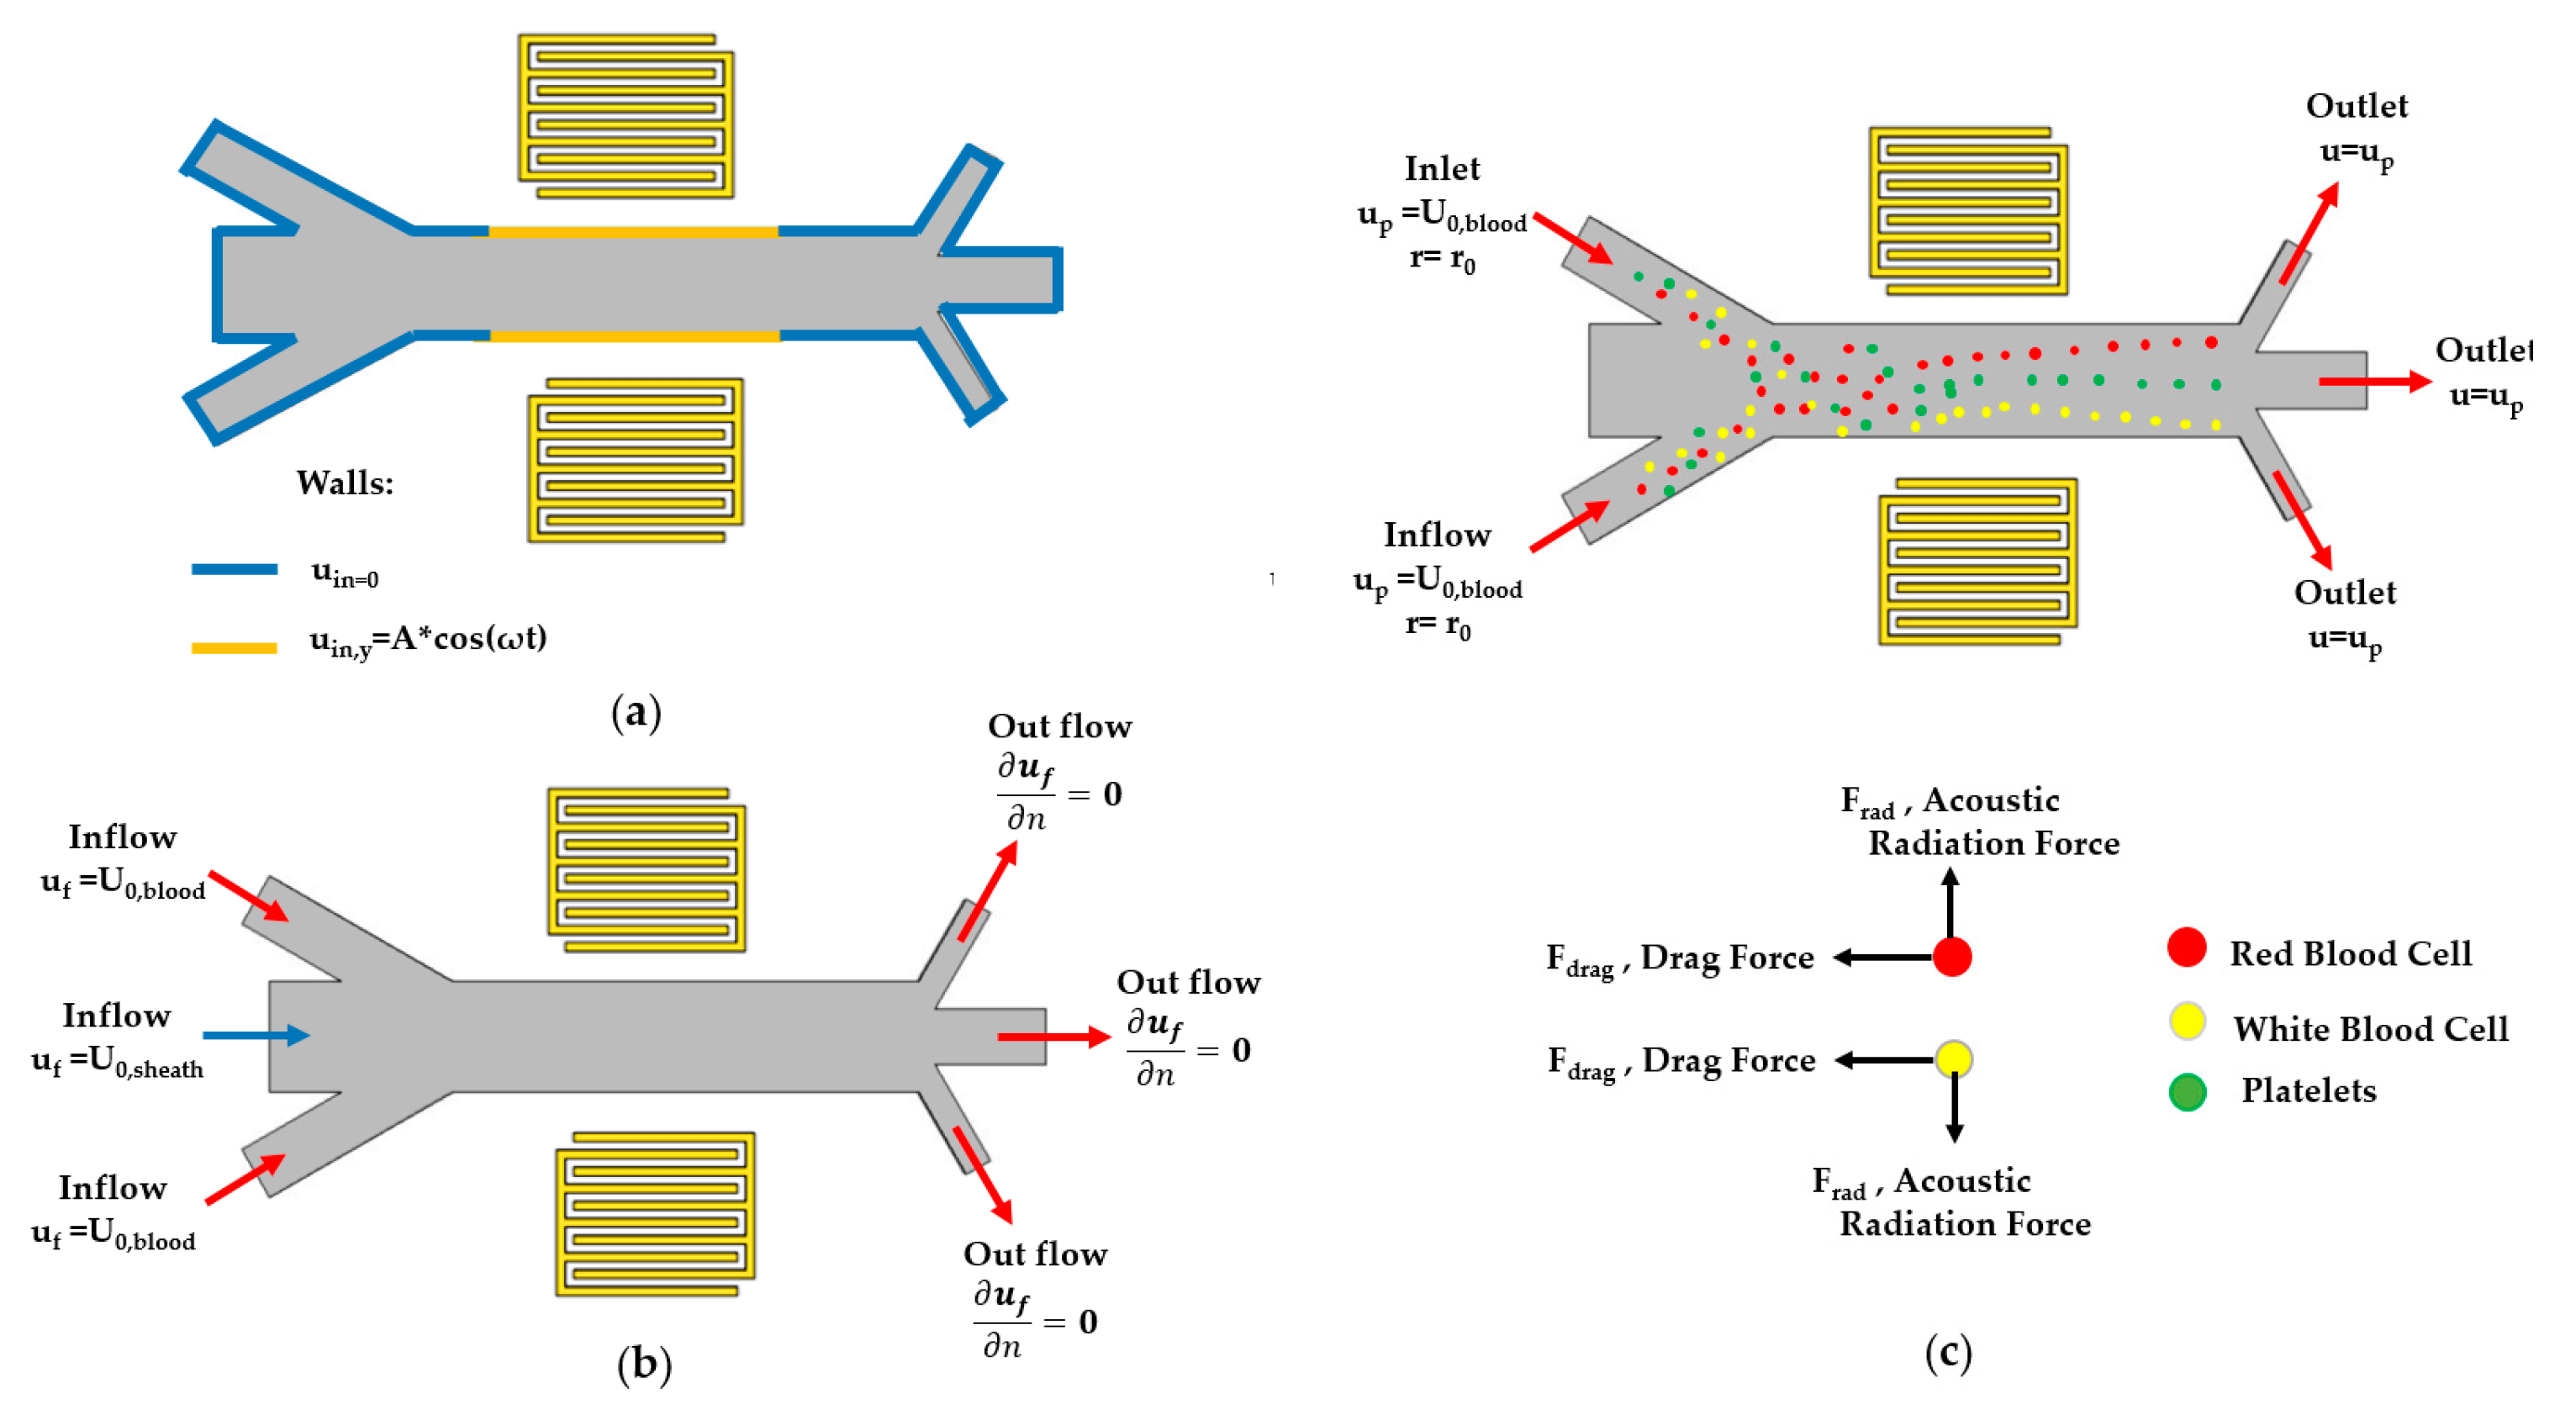
2.2. Boundary Conditions
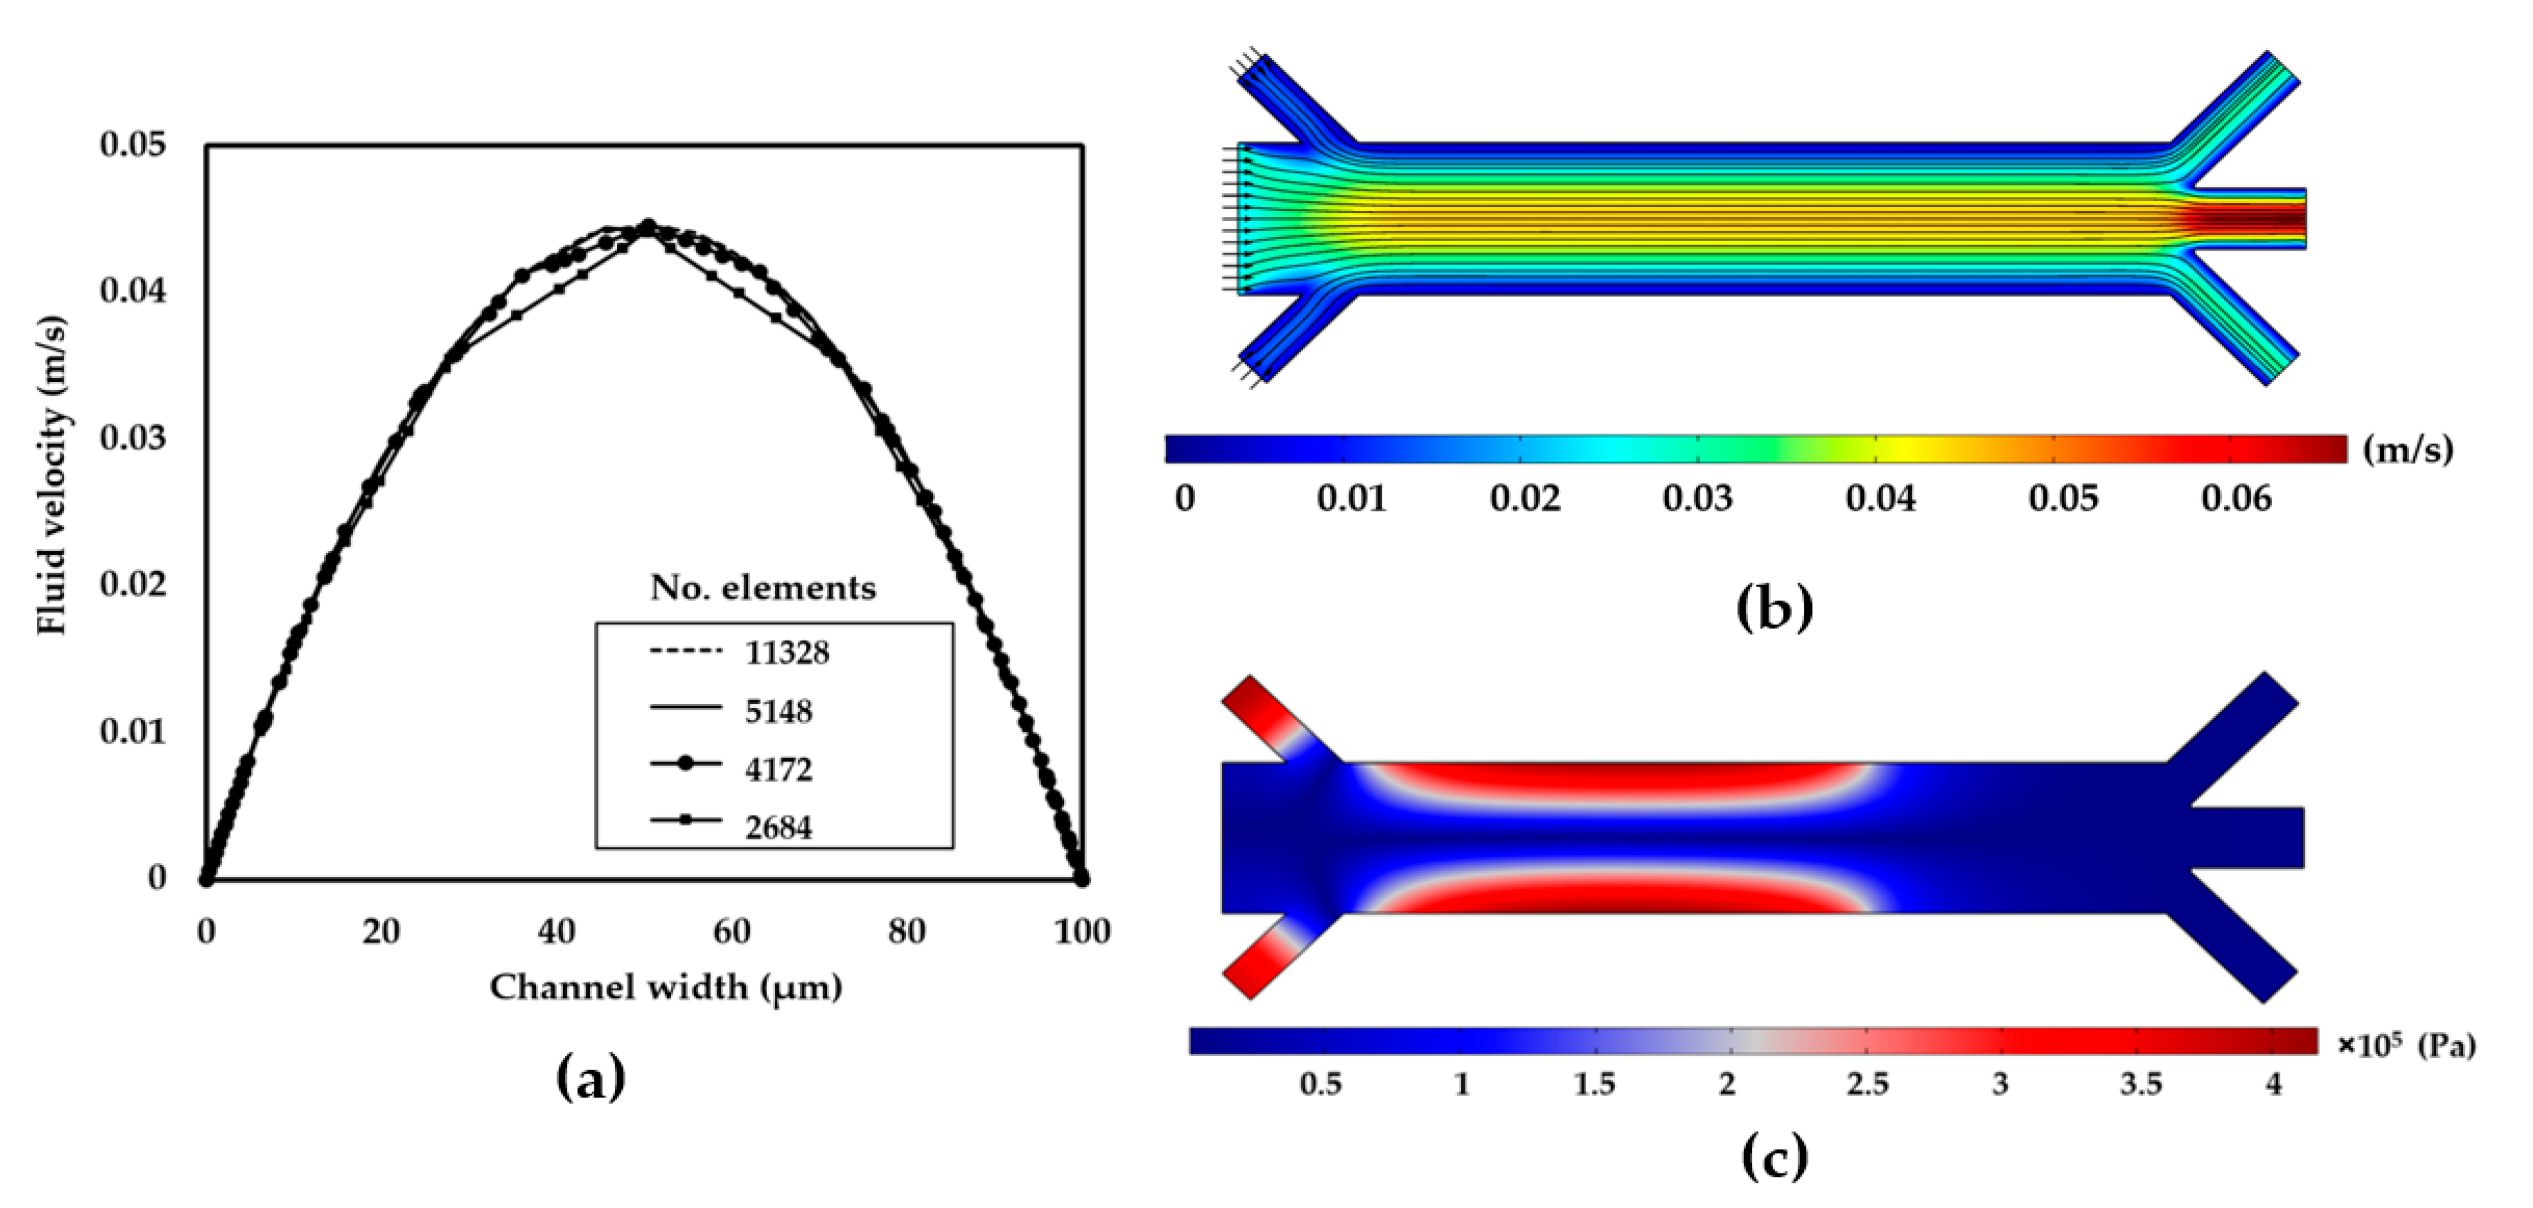
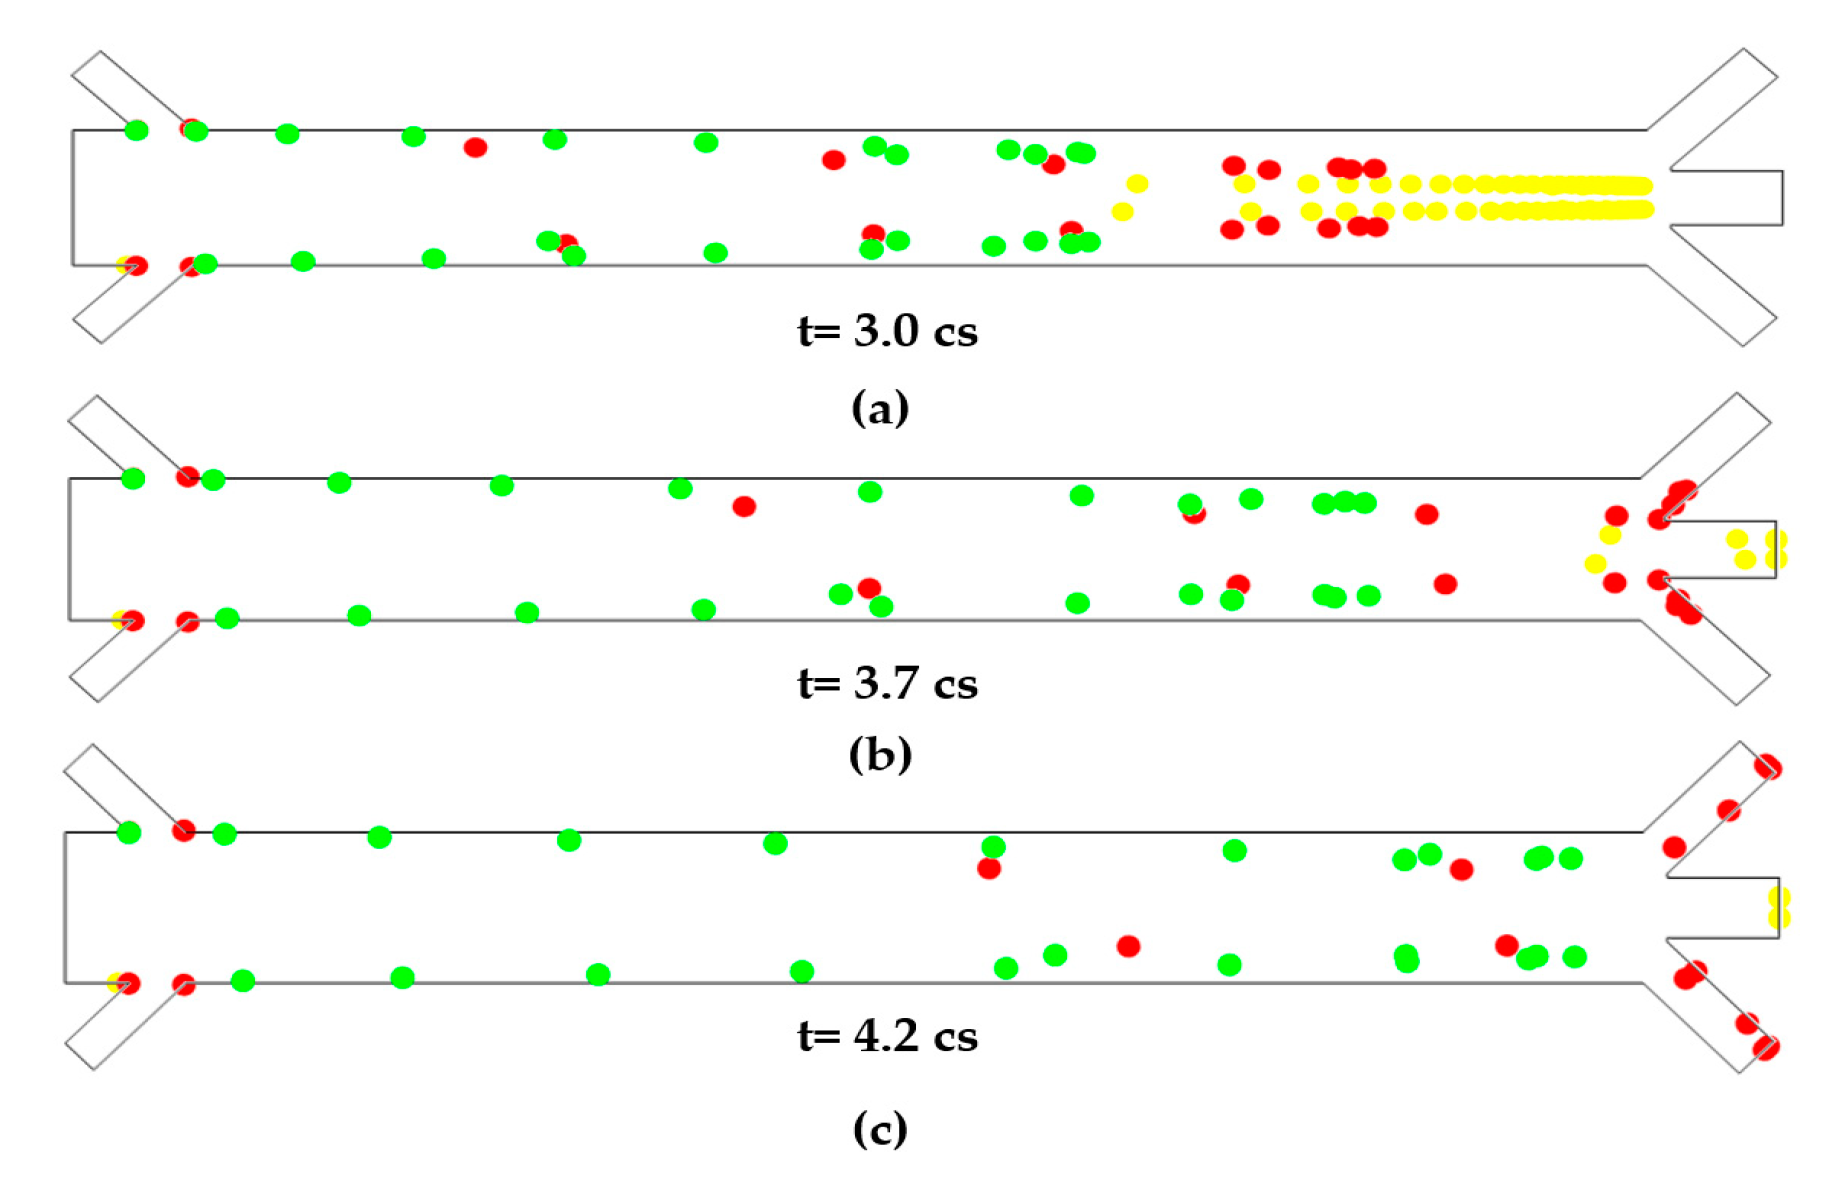
3. Results
4. Discussions and Conclusions
Author Contributions
Conflicts of Interest
References
- Li, H.; Steckl, A.J. Paper microfluidics for point-of-care blood-based analysis and diagnostics. Anal. Chem. 2018, 91, 352–371. [Google Scholar] [CrossRef] [PubMed]
- Ellett, F.; Jorgensen, J.; Marand, A.L.; Liu, Y.M.; Martinez, M.M.; Sein, V.; Butler, K.L.; Lee, J.; Irimia, D. Diagnosis of sepsis from a drop of blood by measurement of spontaneous neutrophil motility in a microfluidic assay. Nat. Biomed. Eng. 2018, 2, 207–214. [Google Scholar] [CrossRef] [PubMed]
- Yousuff, C.M.; Ho, E.T.W.; Hussain, K.I.; Hamid, N.H.B. Microfluidic platform for cell isolation and manipulation based on cell properties. Micromachines 2017, 8, 15. [Google Scholar] [CrossRef]
- Wu, M.; Ozcelik, A.; Rufo, J.; Wang, Z.; Fang, R.; Huang, T.J. Acoustofluidic separation of cells and particles. Microsyst. Nanoeng. 2019, 5, 32. [Google Scholar] [CrossRef] [PubMed]
- Franke, T.; Hoppe, R.; Linsenmann, C.; Zeleke, K. Numerical simulation of surface acoustic wave actuated cell sorting. Open Math. 2013, 11, 760–778. [Google Scholar] [CrossRef]
- White, F.M.; Corfield, I. Viscous Fluid Flow; McGraw-Hill: New York, NY, USA, 2006; Volume 3. [Google Scholar]


| Simulation Parameter-Symbol [SI Unit] | Value | Source |
|---|---|---|
| water viscosity—μ [Pa-s] | 0.001 | [6] |
| water density—ρf [kg/m3] | 1000 | [6] |
| speed of sound in water—cf [m/s] | 1481 | [5] |
| compressibility—κ [1/Pa] | 4 × 10⁻¹⁰ | [5] |
| Acoustic velocity amplitude—A [nm/s] | 5 | calculated |
| Angular frequency—ω [rad/s] | 30 × 106 | calculated |
| Sheath flow velocity at inlet—U0, sheath [m/s] | 2.5 × 10⁻² | calculated |
| Blood velocity at inlet—U0, blood [m/s] | 10−2 | calculated |
Publisher’s Note: MDPI stays neutral with regard to jurisdictional claims in published maps and institutional affiliations. |
© 2020 by the authors. Licensee MDPI, Basel, Switzerland. This article is an open access article distributed under the terms and conditions of the Creative Commons Attribution (CC BY) license (https://creativecommons.org/licenses/by/4.0/).
Share and Cite
Sharifi, F.; Sedighi, A.; Rehman, M. Design and Simulation of a Point-of-Care Microfluidic Device for Acoustic Blood Cell Separation. Eng. Proc. 2020, 2, 76. https://doi.org/10.3390/ecsa-7-08221
Sharifi F, Sedighi A, Rehman M. Design and Simulation of a Point-of-Care Microfluidic Device for Acoustic Blood Cell Separation. Engineering Proceedings. 2020; 2(1):76. https://doi.org/10.3390/ecsa-7-08221
Chicago/Turabian StyleSharifi, Fatemeh, Armin Sedighi, and Mubashar Rehman. 2020. "Design and Simulation of a Point-of-Care Microfluidic Device for Acoustic Blood Cell Separation" Engineering Proceedings 2, no. 1: 76. https://doi.org/10.3390/ecsa-7-08221
APA StyleSharifi, F., Sedighi, A., & Rehman, M. (2020). Design and Simulation of a Point-of-Care Microfluidic Device for Acoustic Blood Cell Separation. Engineering Proceedings, 2(1), 76. https://doi.org/10.3390/ecsa-7-08221