Proceeding Paper

Low-Energy and Modular Wearable Device for Wireless Measurement of Physiological Signals †

by
Manuel A. Herrera-Juárez
and
Roberto G. Ramírez-Chavarría
*
Instituto de Ingeniería, Universidad Nacional Autónoma de México, Ciudad Universitaria, Ciudad de México 04510, Mexico
*
Author to whom correspondence should be addressed.
Presented at the 7th Electronic Conference on Sensors and Applications, 15–30 November 2020; Available online: https://ecsa-7.sciforum.net/.
Eng. Proc. 2020, 2(1), 75; https://doi.org/10.3390/ecsa-7-08213
Published: 14 November 2020
(This article belongs to the Proceedings of 7th International Electronic Conference on Sensors and Applications)

Abstract

:
The most common way for accessing healthcare and monitoring physiological signals is based on commercial devices. Most of them are, in general, expensive, highly invasive, and require sophisticated infrastructure for operating. Nowadays, wearable devices (WD) offer an attractive technology for circumventing the limitations of classic medical devices. The design of WD, however, remains a challenging task to reach high-performance, reliability, and to be ergonomic. In this work, we develop, to the best of our knowledge, a novel WD with two main highlights. (i) Our device is based on a low-power 32-bit microcontroller, embedding a Bluetooth Low Energy (BLE) module for wireless data streaming with a mobile application for signal monitoring and recording, alongside a warning notification system. (ii) The proposed WD has a modular and flexible design, such that the user can increase the number of sensors by sharing the acquisition and processing system, thus reducing the hardware requirements and exhibiting a minimally invasive arrangement. For all the WD stages, we show their design methodology, the tests for characterizing their performance, and the results obtained from a case of study. For the latter, we consider two sensor prototypes for measuring the corporal temperature with a passive sensor, as well as the breath and heart rates via photoplethysmography signals. Results show that our WD is a cost-effective alternative and a promising tool for healthcare monitoring, as it operates in agreement with physiological levels with high-reliability.

1. Introduction

The number of people with chronic-degenerative diseases is a huge worldwide problem. Traditionally, to follow the disease evolution requires specialized medical personnel and bench-top equipment for testing and diagnostic, which implies that patients should go to medical centers whenever they need either clinical care or tests. This issue needs classic medical instruments and protocols that increase the amount of money invested in healthcare services and difficulties the long-term monitoring of physiological levels. One of the most pervasive challenges to overcome the problem is nowadays the use of engineering techniques to develop measurement devices with integrated technologies able to monitor physiological levels at high reliability [1].
Wearable devices (WD) are a set of technologies and devices implementing computer functions that can be worn, carried by, or attached to the human body [2]. Particularly, WD dedicated to healthcare devices, alongside mobile technologies, offer an attractive way to design measurement devices for monitoring, treatment, or diagnosis of several diseases [3]. The main advantages of WD rely on remotely collecting physiological data from patients and reducing the number of visits to hospitals, thus lowering the costs and time [4]. On the other hand, the collected data could be analyzed by healthcare experts, which allows earlier diagnoses. Therefore, patient illnesses could be treated as soon as possible, thus improving their life quality [5,6]. The design and development of WD is, however, a technological challenge that involves issues such as ergonomic design, minimal invasive apparatus, and the ability to retrieve high-reliable results [7]. Moreover, in many cases, it is hard to measure several parameters at the same time and in the same place with a single WD and without disturbing the patient free movement [8].
In this paper, we propose an attractive device, highlighting ergonomic and minimal invasive features, low power consumption, and wireless data streaming to a custom-designed mobile application. We introduce a framework where different flexible electronics-based sensors work in parallel, sharing one central processing system as the main WD, with a focus on the measurement of corporal temperature, breath rate (BR), and heart rate (HR) at high throughput.

2. Materials and Methods

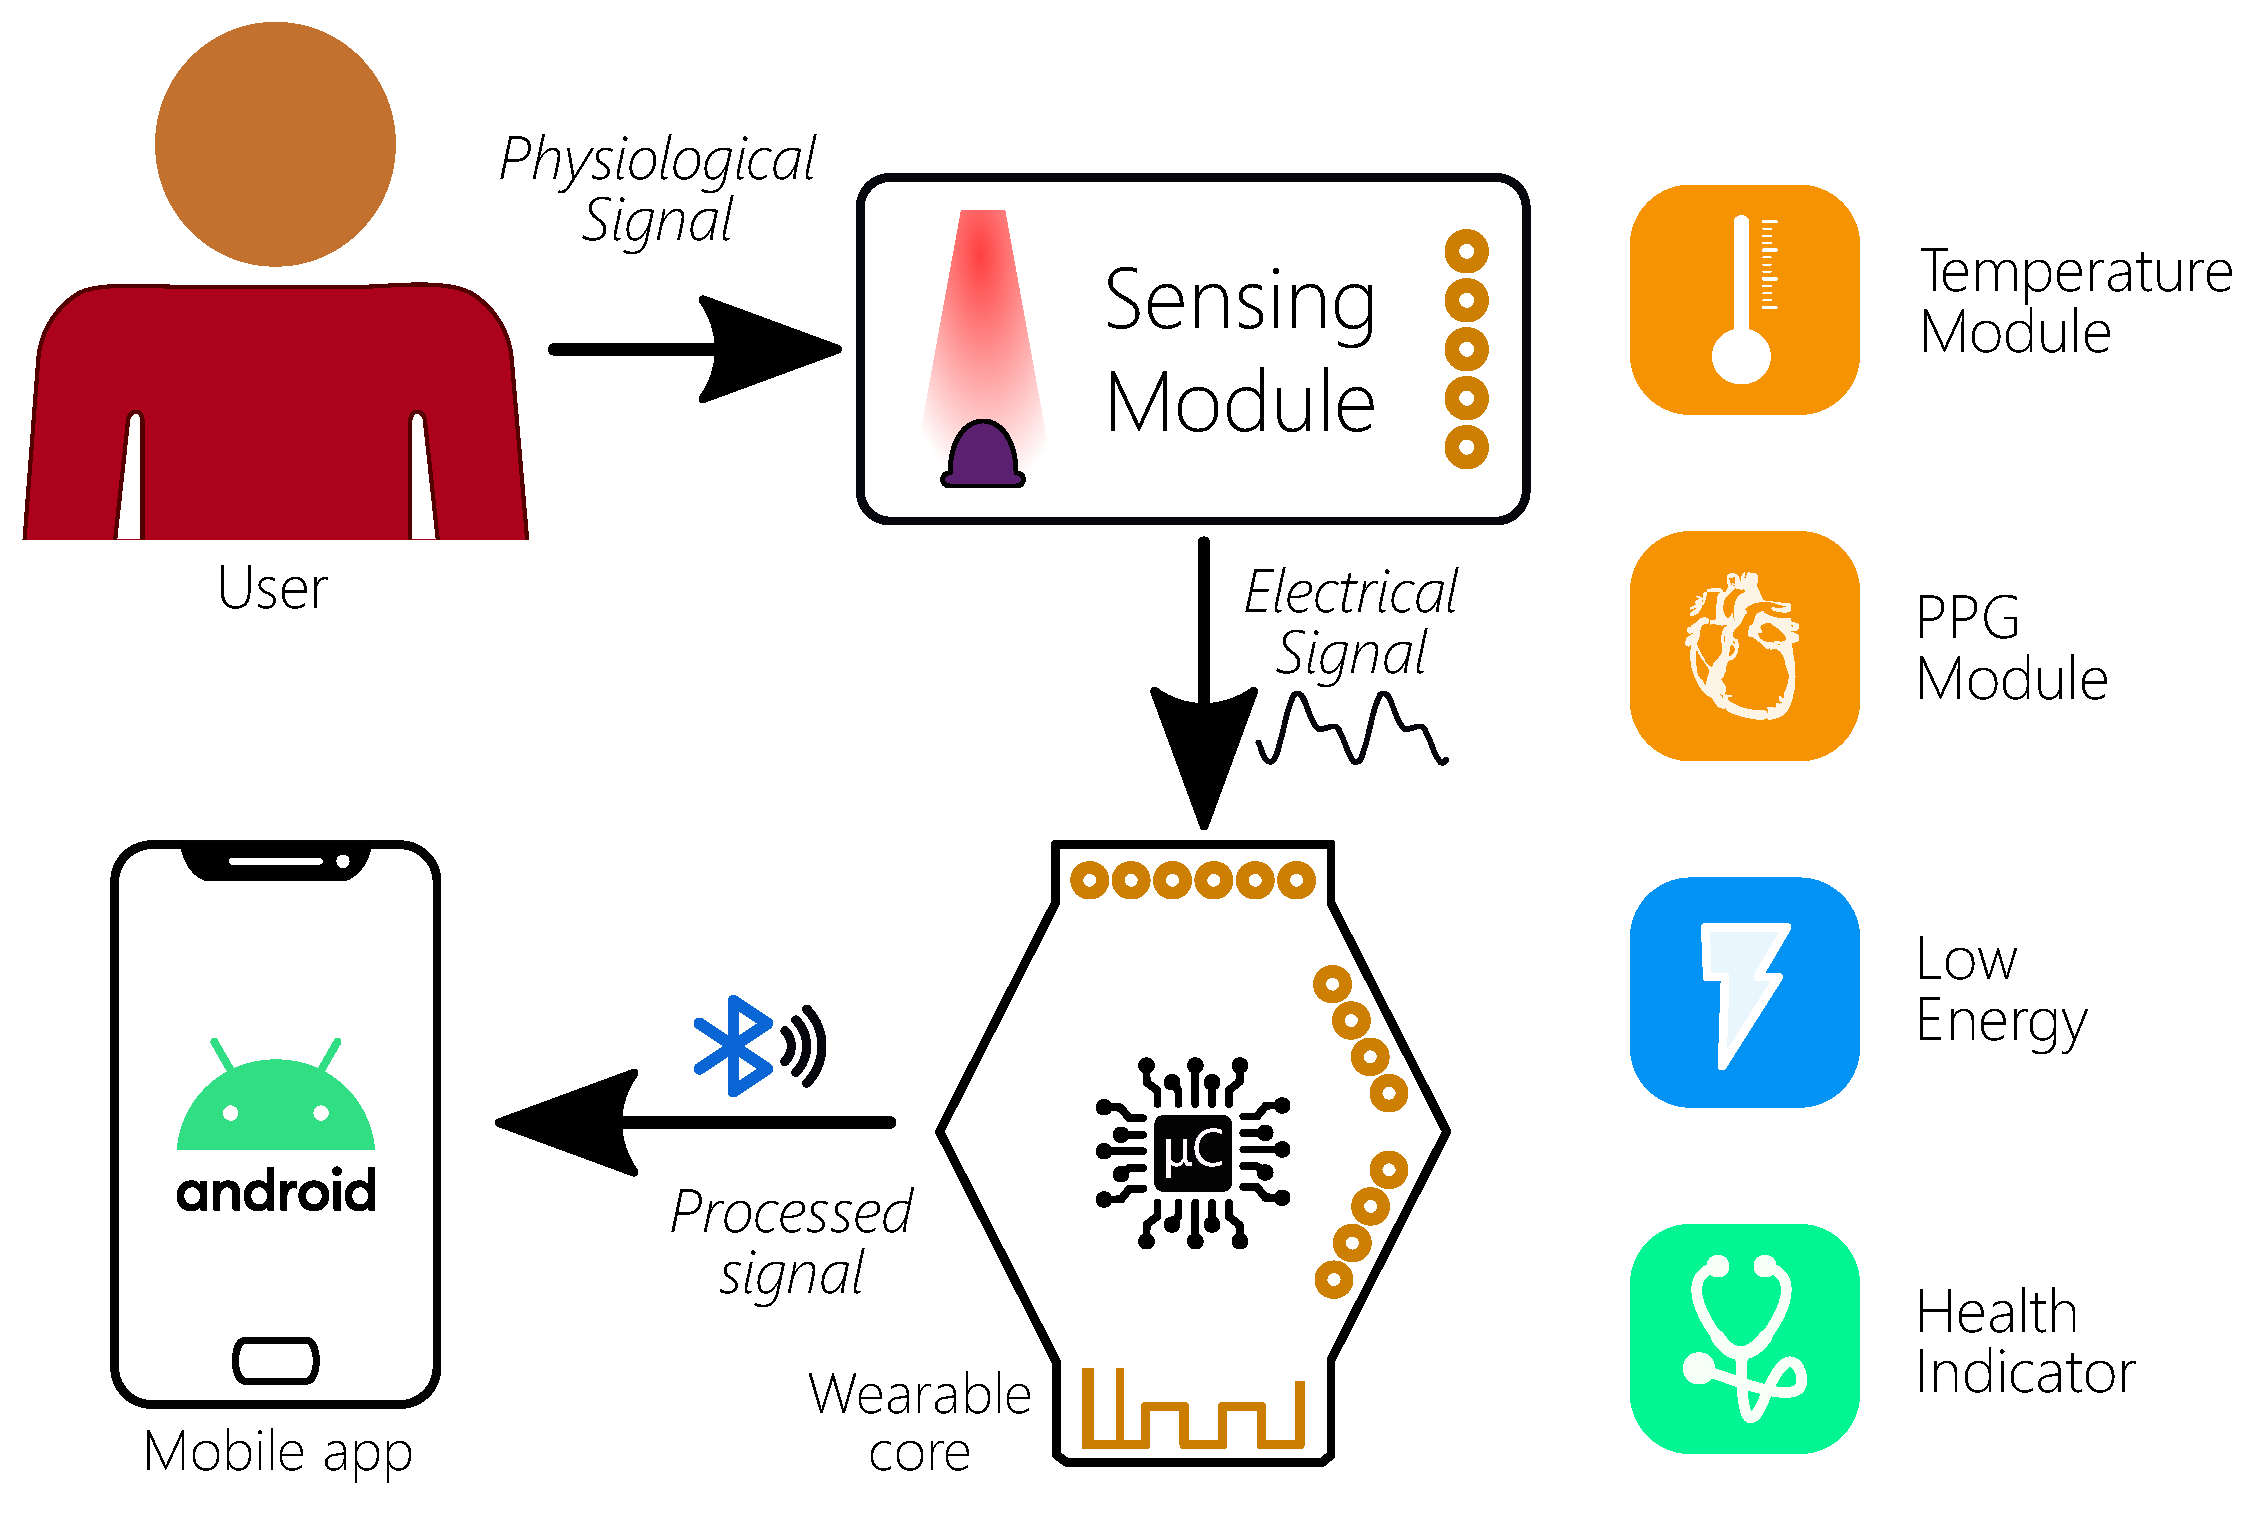
2.1. System Overview

Figure 1 shows the block diagram of the proposed system, which comprises three elements, alongside the user who wears the device. The first element is a flexible electronics-based sensing module, which has two sensitive elements for measuring three parameters: corporal temperature, breath rate (BR) and heart rate (HR). The body thermometer is based on a resistive temperature detector (RTD), whereas the BR and HR are measured with an optical transducer performing the photoplethysmography (PPG) technique. Each sensor contains a dedicated analog-front-end (AFE) for signal conditioning to enhance the quality of the resultant electrical signals. The second element is a wearable device core (WDC), which acquires, digitizes, pre-process the electrical signal, and wirelessly transmits the digitally formatted signals over a Bluetooth Low Energy (BLE) module to a mobile device running an AndroidTM operating system. The MD executes a custom-designed mobile application (MA) which processes the received data to indicate the final health care information. Ultimately, the MD shows all the physiological parameters in real-time and records the complete waveforms after the measuring process ends.

2.2. Hardware Design

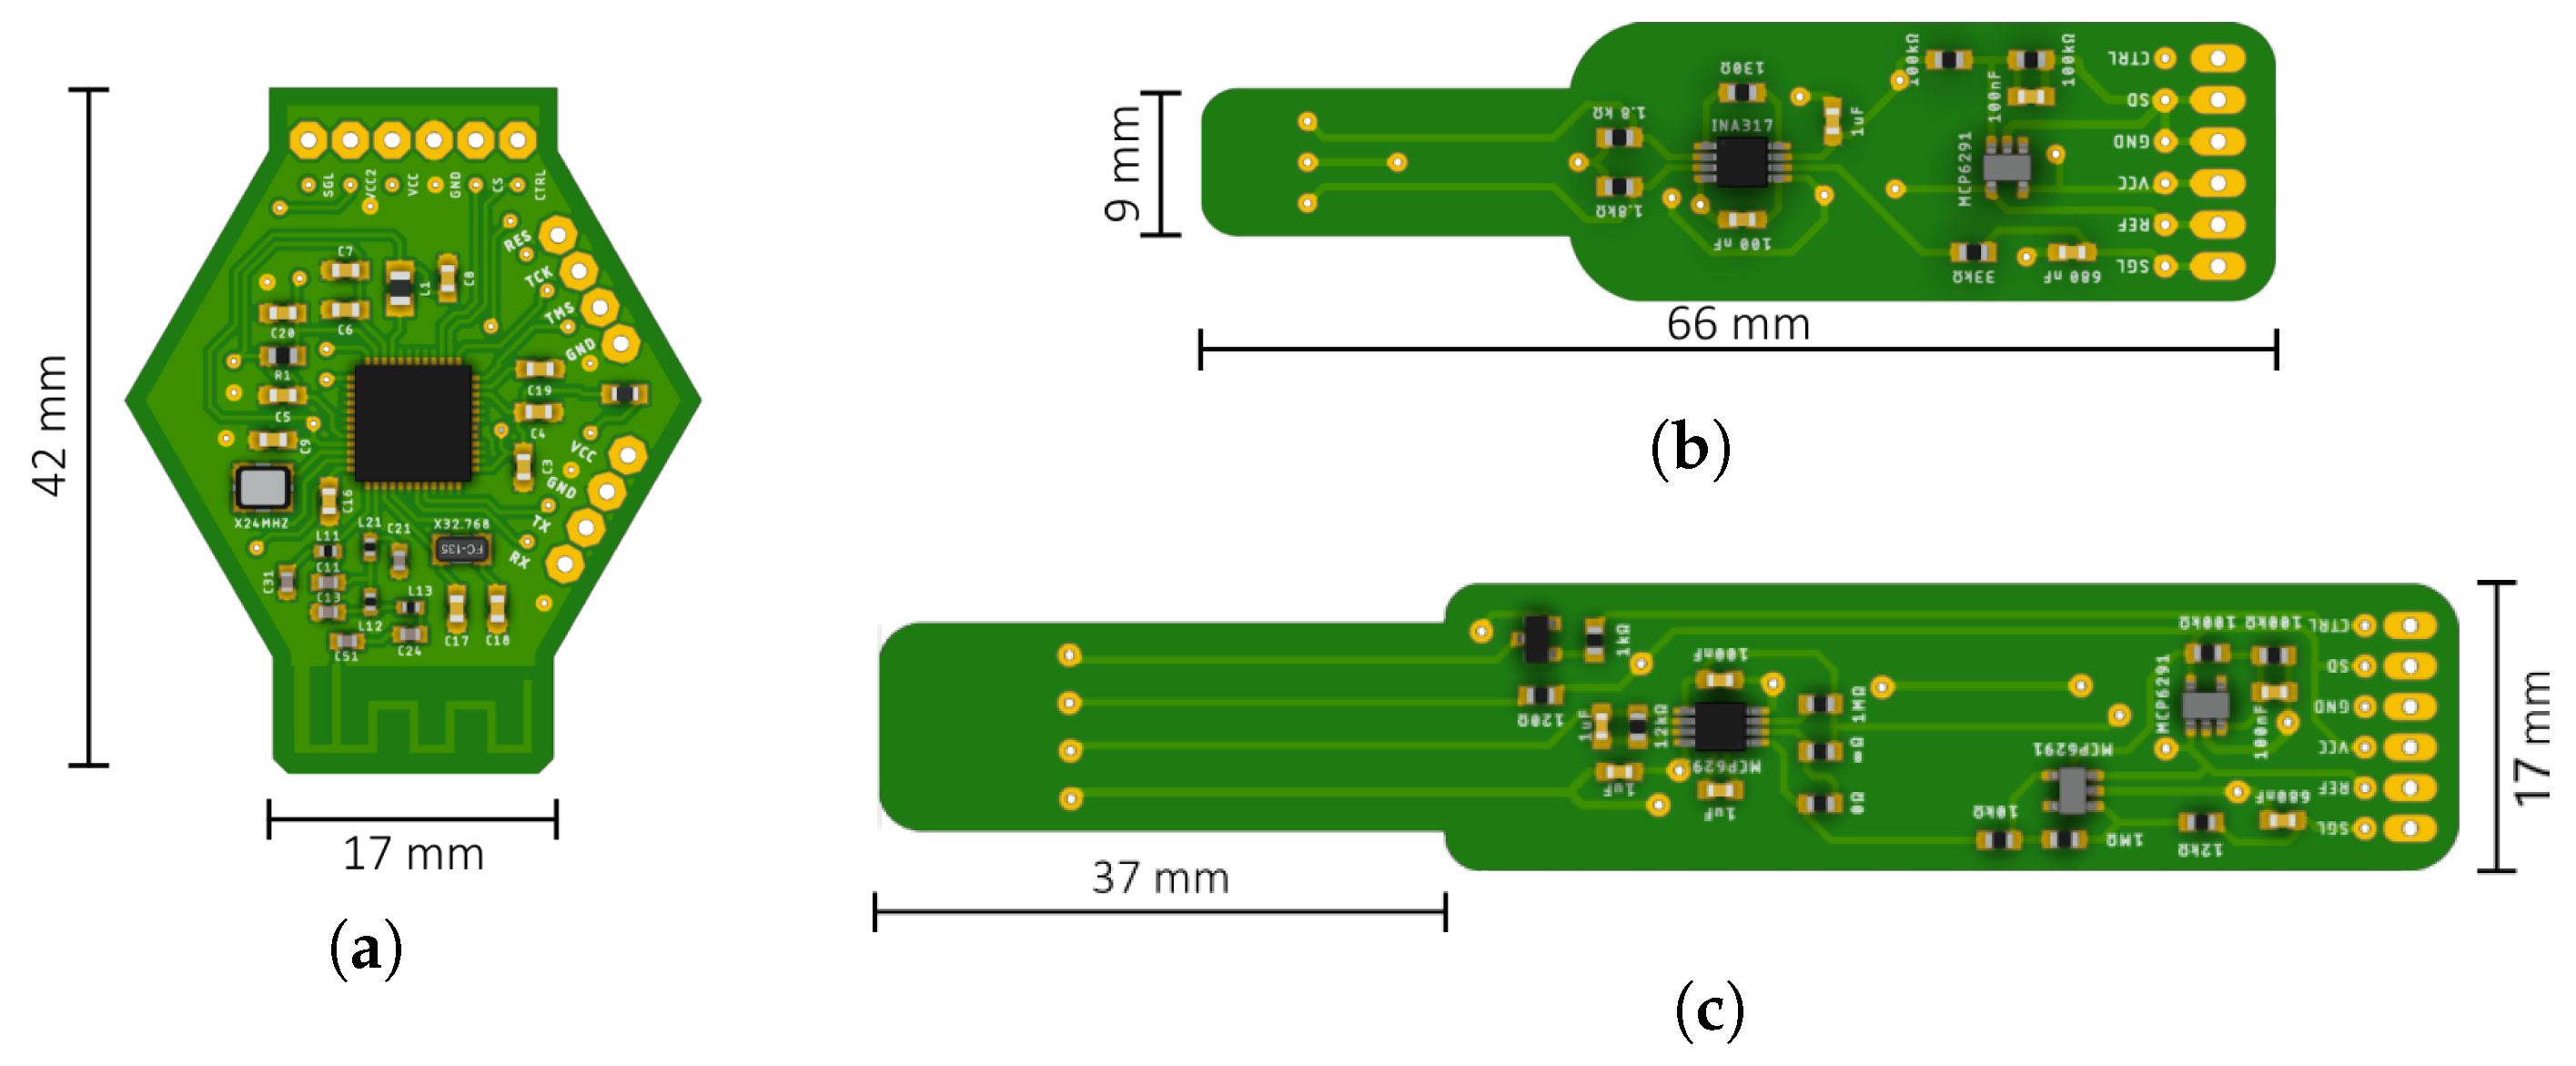
2.2.1. Wearable Device Core

The core of the proposed health care system is the wearable device core (WDC) built around the Texas InstrumentsTM CC2640R2F microcontroller (MCU). It offers a 32-bit powerful ARMTM Cortex-M3 processor, viable for WD applications due to its outstanding features. The MCU has an inbuilt 12-bit analog-to-digital-converter (ADC) for signal acquisition, a wide voltage supply ranging from 1.8 to 3.7   V suitable for low-power applications, and finally, a module for implementing the Bluetooth Low Energy (BLE) communication with a dedicated co-processor for data streaming tasks.

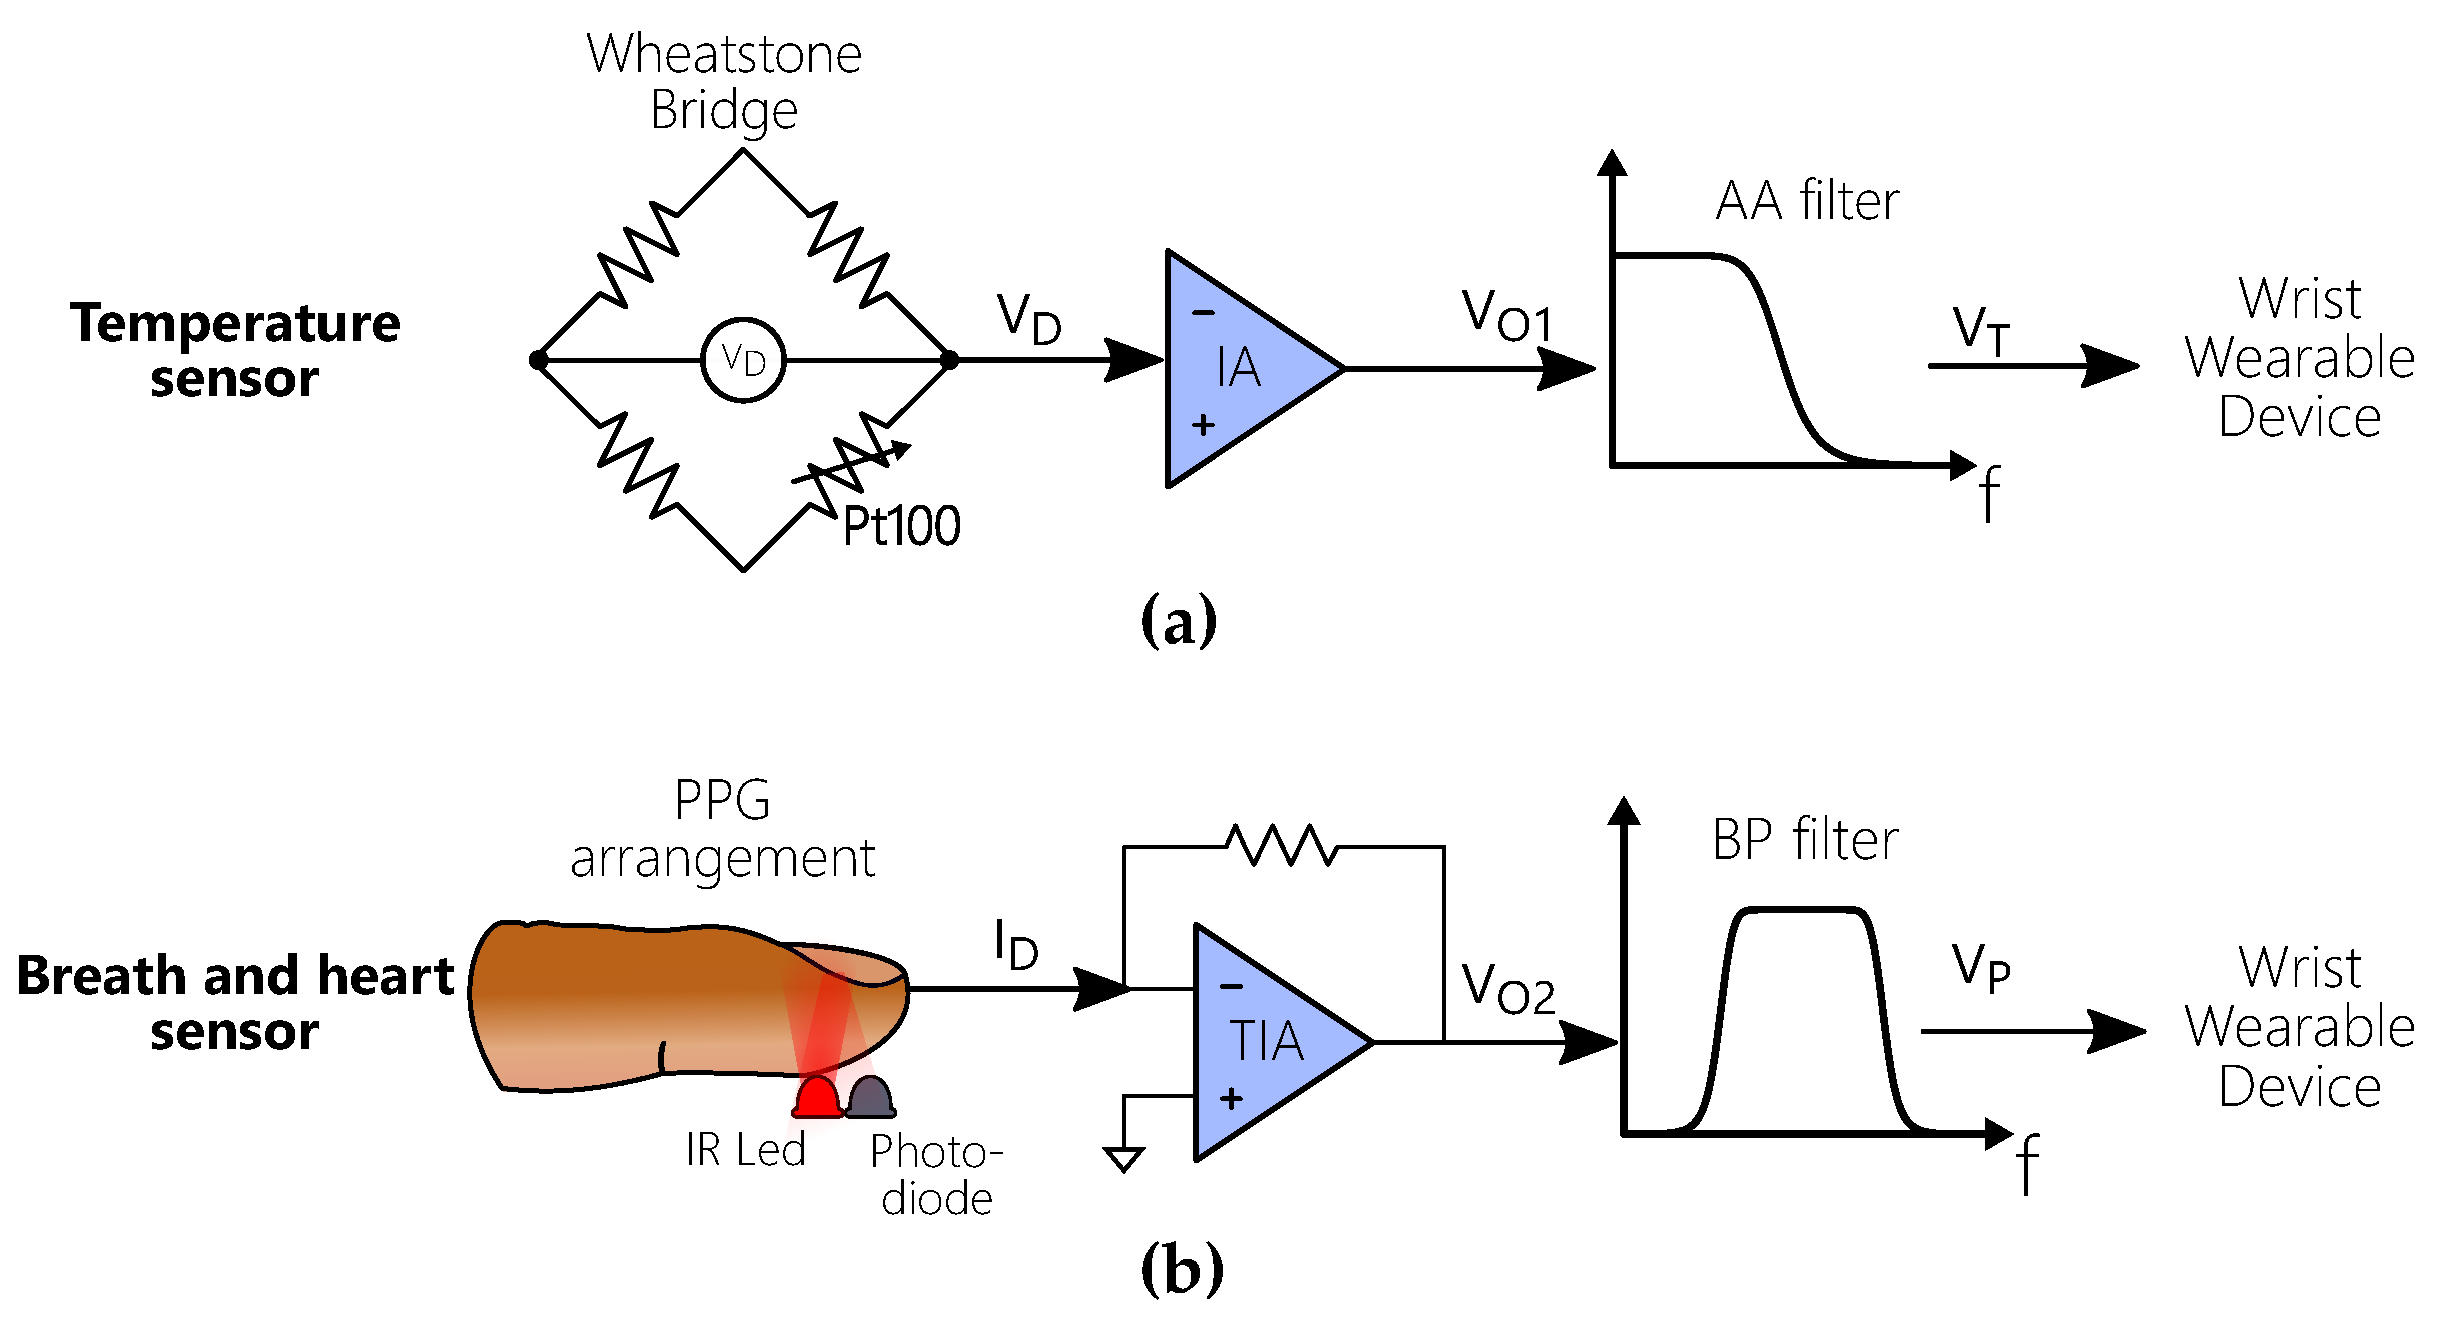
2.2.2. Corporal Temperature Sensor

As shown in Figure 2a, the temperature sensing module is constructed with a millimeter-sized platinum resistance temperature detector (Pt100). A Wheatstone bridge converts the sensor output into a voltage signal for detecting small changes in the resistance due to the increment and decrement of the patient body temperature. Afterward, an instrumentation amplifier (IA) measures a differential voltage ( V D ) across the output terminals of the bridge circuit, amplifies it, and rejects the common-mode signals for increasing the signal-to-noise ratio (SNR) of the output voltage ( V O 1 ). Finally, the latter is fed into hardware anti-aliasing (AA) filter to restrict the signal bandwidth before the sampling process.

2.2.3. Breath and Heart Rate Sensor

The BR and HR sensor uses the photoplethysmography technique. The PPG arrangement uses an infrared (IR) light-emitting diode (LED) at a centered emission wavelength of λ = 940 nm, whereas a photo-diode (PD) detects the reflected light on the skin. Wherein, the light intensity is the result of the interaction of cardiovascular, respiratory and autonomous nervous systems. As depicted in Figure 2b, the output current signal ( I D ) is converted to a voltage signal ( V O 2 ) by a low-noise transimpedance amplifier (TIA). Finally, the output voltage is band-pass (BP) filtered to limit the bandwidth for the corresponding heart and breath rate frequencies.

2.2.4. Device Fabrication

For the WD fabrication, we use surface mount technology (SMT) to keep as small as possible the dimensions of the electronics, thus allowing portability and minimally invasive features. It is worth to mention that, the WDC shown in Figure 3a, is the only rigid circuit, such that it is placed on the form of a wrist band. Figure 3b shows the corporal thermometer, which was fabricated by using a flexible substrate and is positioned as an armband at the upper arm in such a manner that the RTD is in direct contact with the skin. Finally, in Figure 3c the breath and heart sensor is depicted. The PPG flexible was designed over a double-sided printed circuit in such a way that the optical elements were directly attached to the finger, whereas the AFE was at the top of the flexible board.

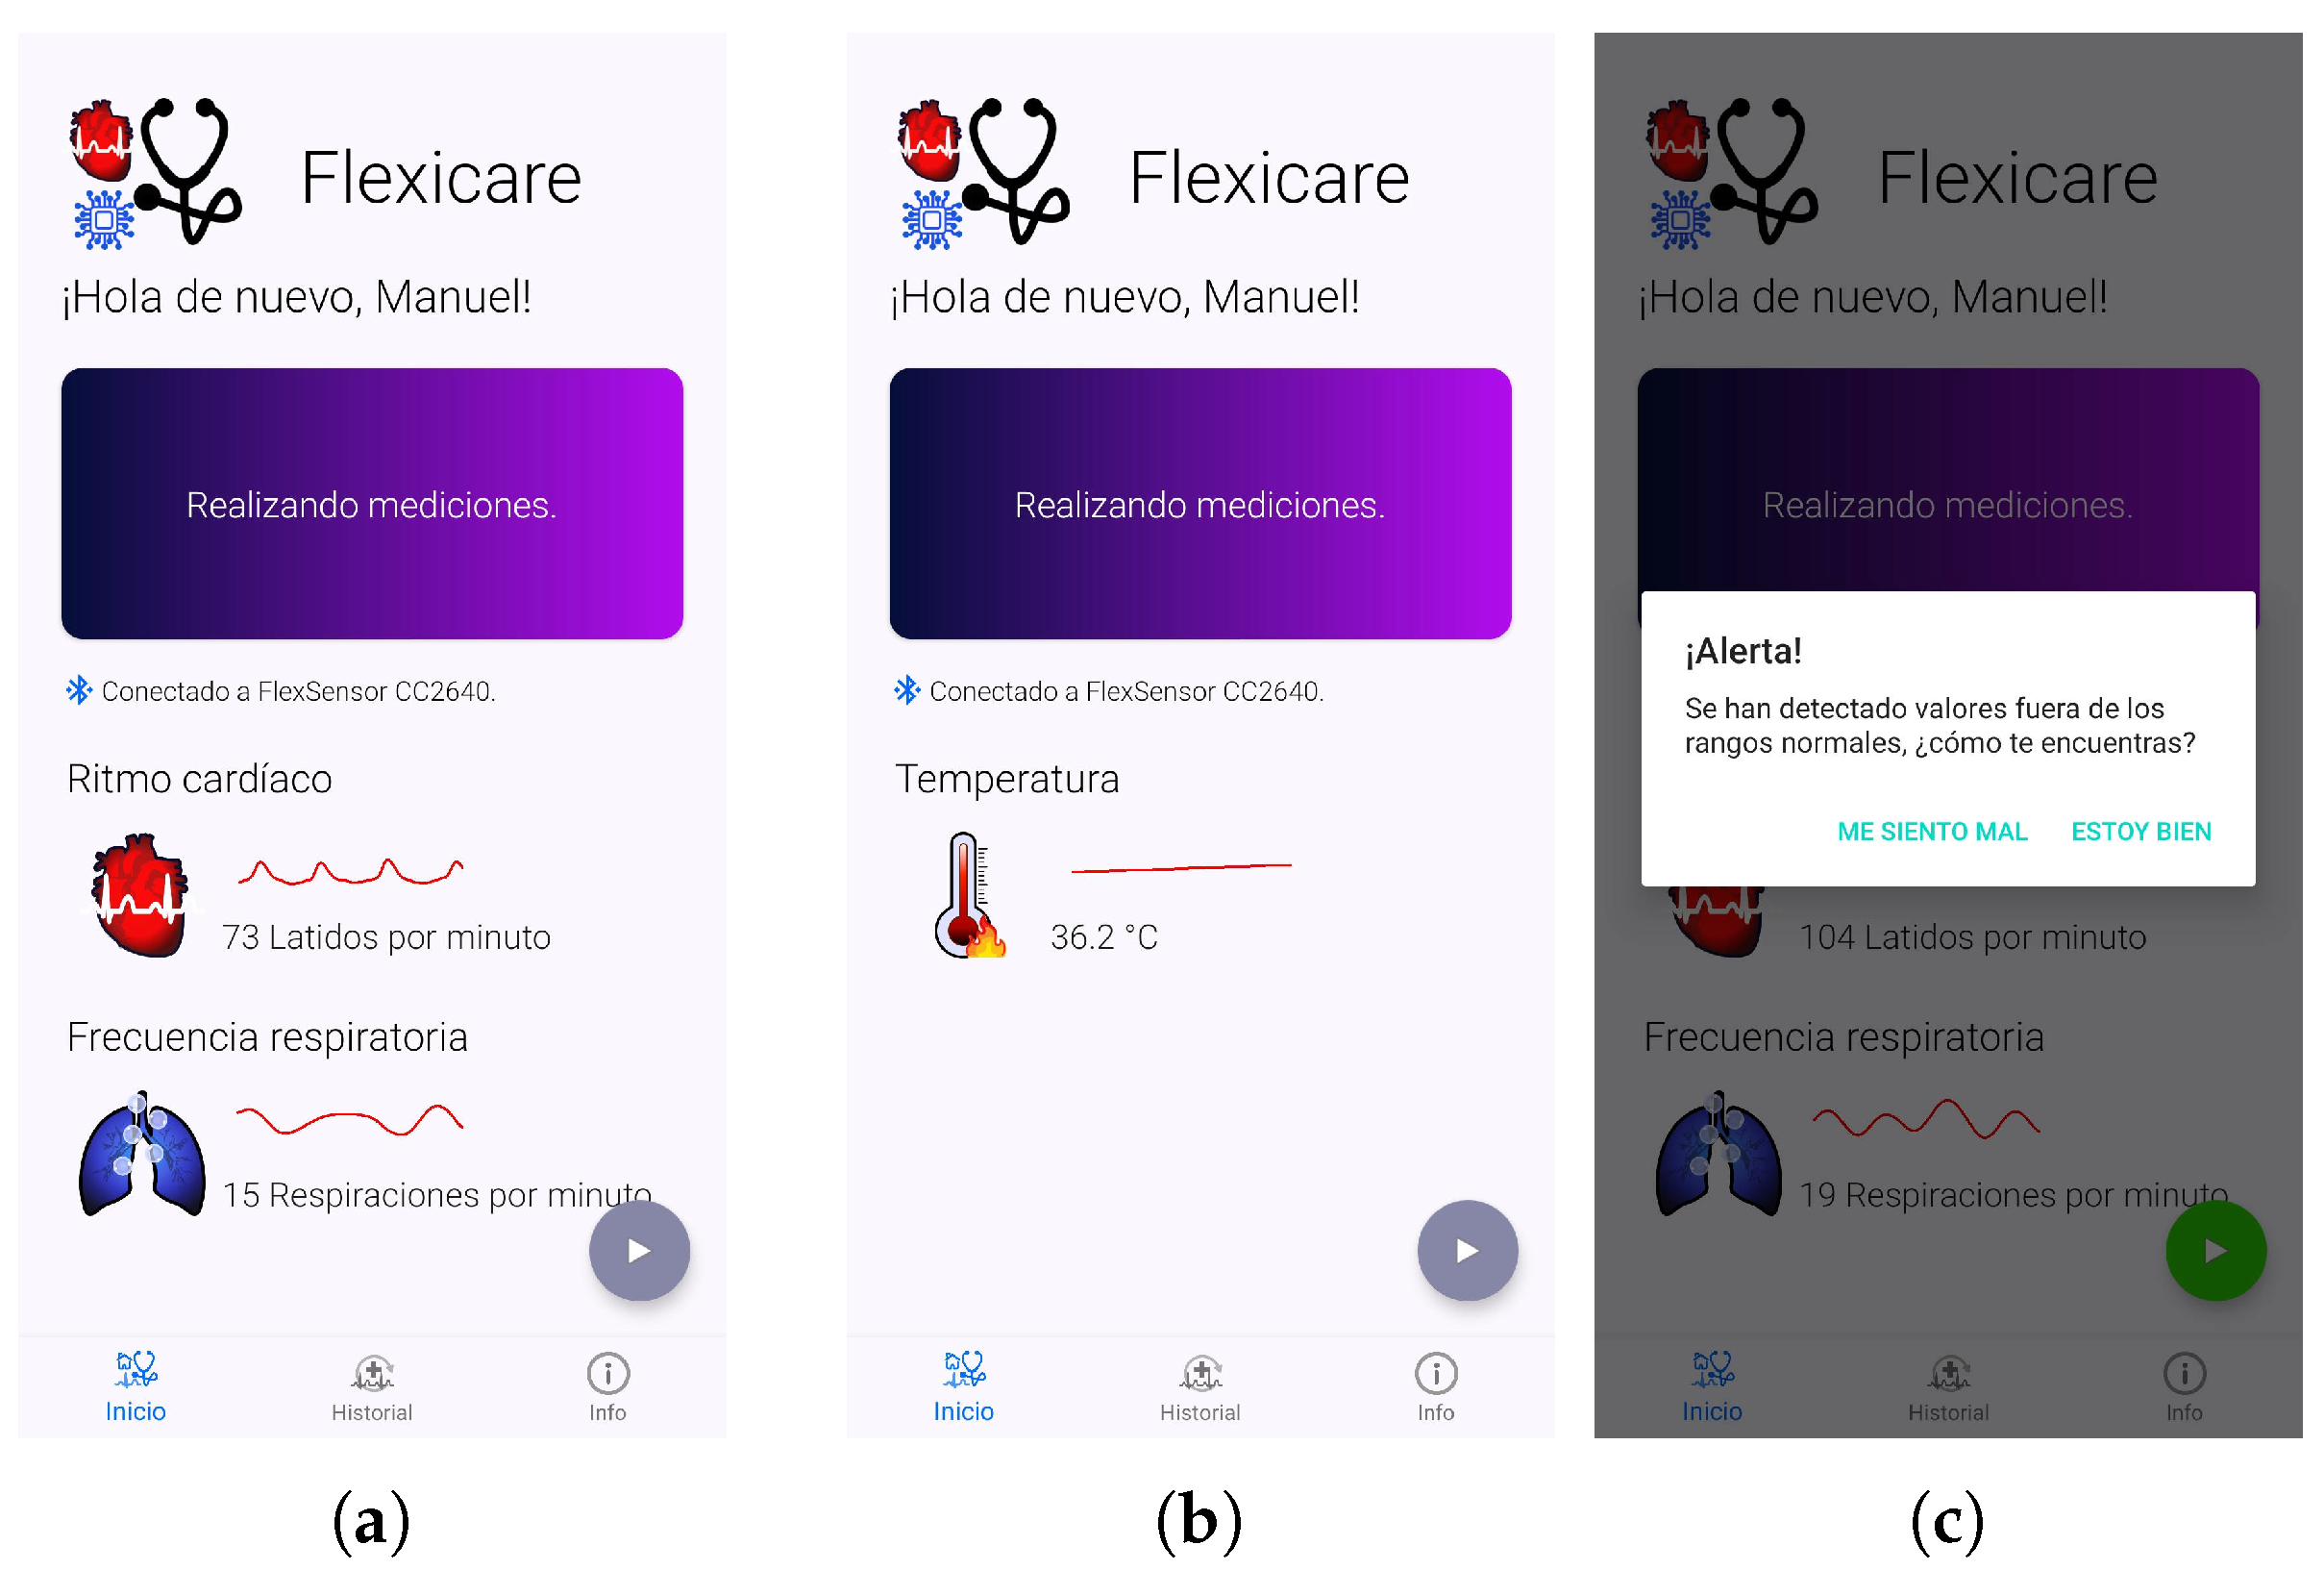
2.3. Firmware and Mobile Application

The firmware for the MCU was developed in C language, along with a software development kit (SDK) for implementing a General Attribute Profile (GATT)-based BLE server for wireless communication. The data frame has information about the module (type, status, ID) and the parameters of the signal sampling process (packet size, sampling frequency) to be streamed via BLE to the MA. Also, there are dedicated pointers for calling the respective initialize, finalize and process methods for each registered sensing module. Once the MA is launched and connected to the WD, and the user begins an acquisition process, the WDC detects the connected sensing module and starts sending the data packets to the MA. A digital signal processing stage, in the MA, applies online two different band-pass Butterworth filters to split the signal into breath rate ( f c 1 = 0.18Hz , f c 2 = 0.45Hz ), and heart rate ( f c 1 = 0.83Hz , f c 2 = 3.7Hz ) waveforms. Afterward, they are analyzed by a peak detector algorithm (PDA) to extract their frequency. Finally, the application displays the physiological parameters and trigger an alter system if the values are out of normal ranges.

3. Results and Discussion

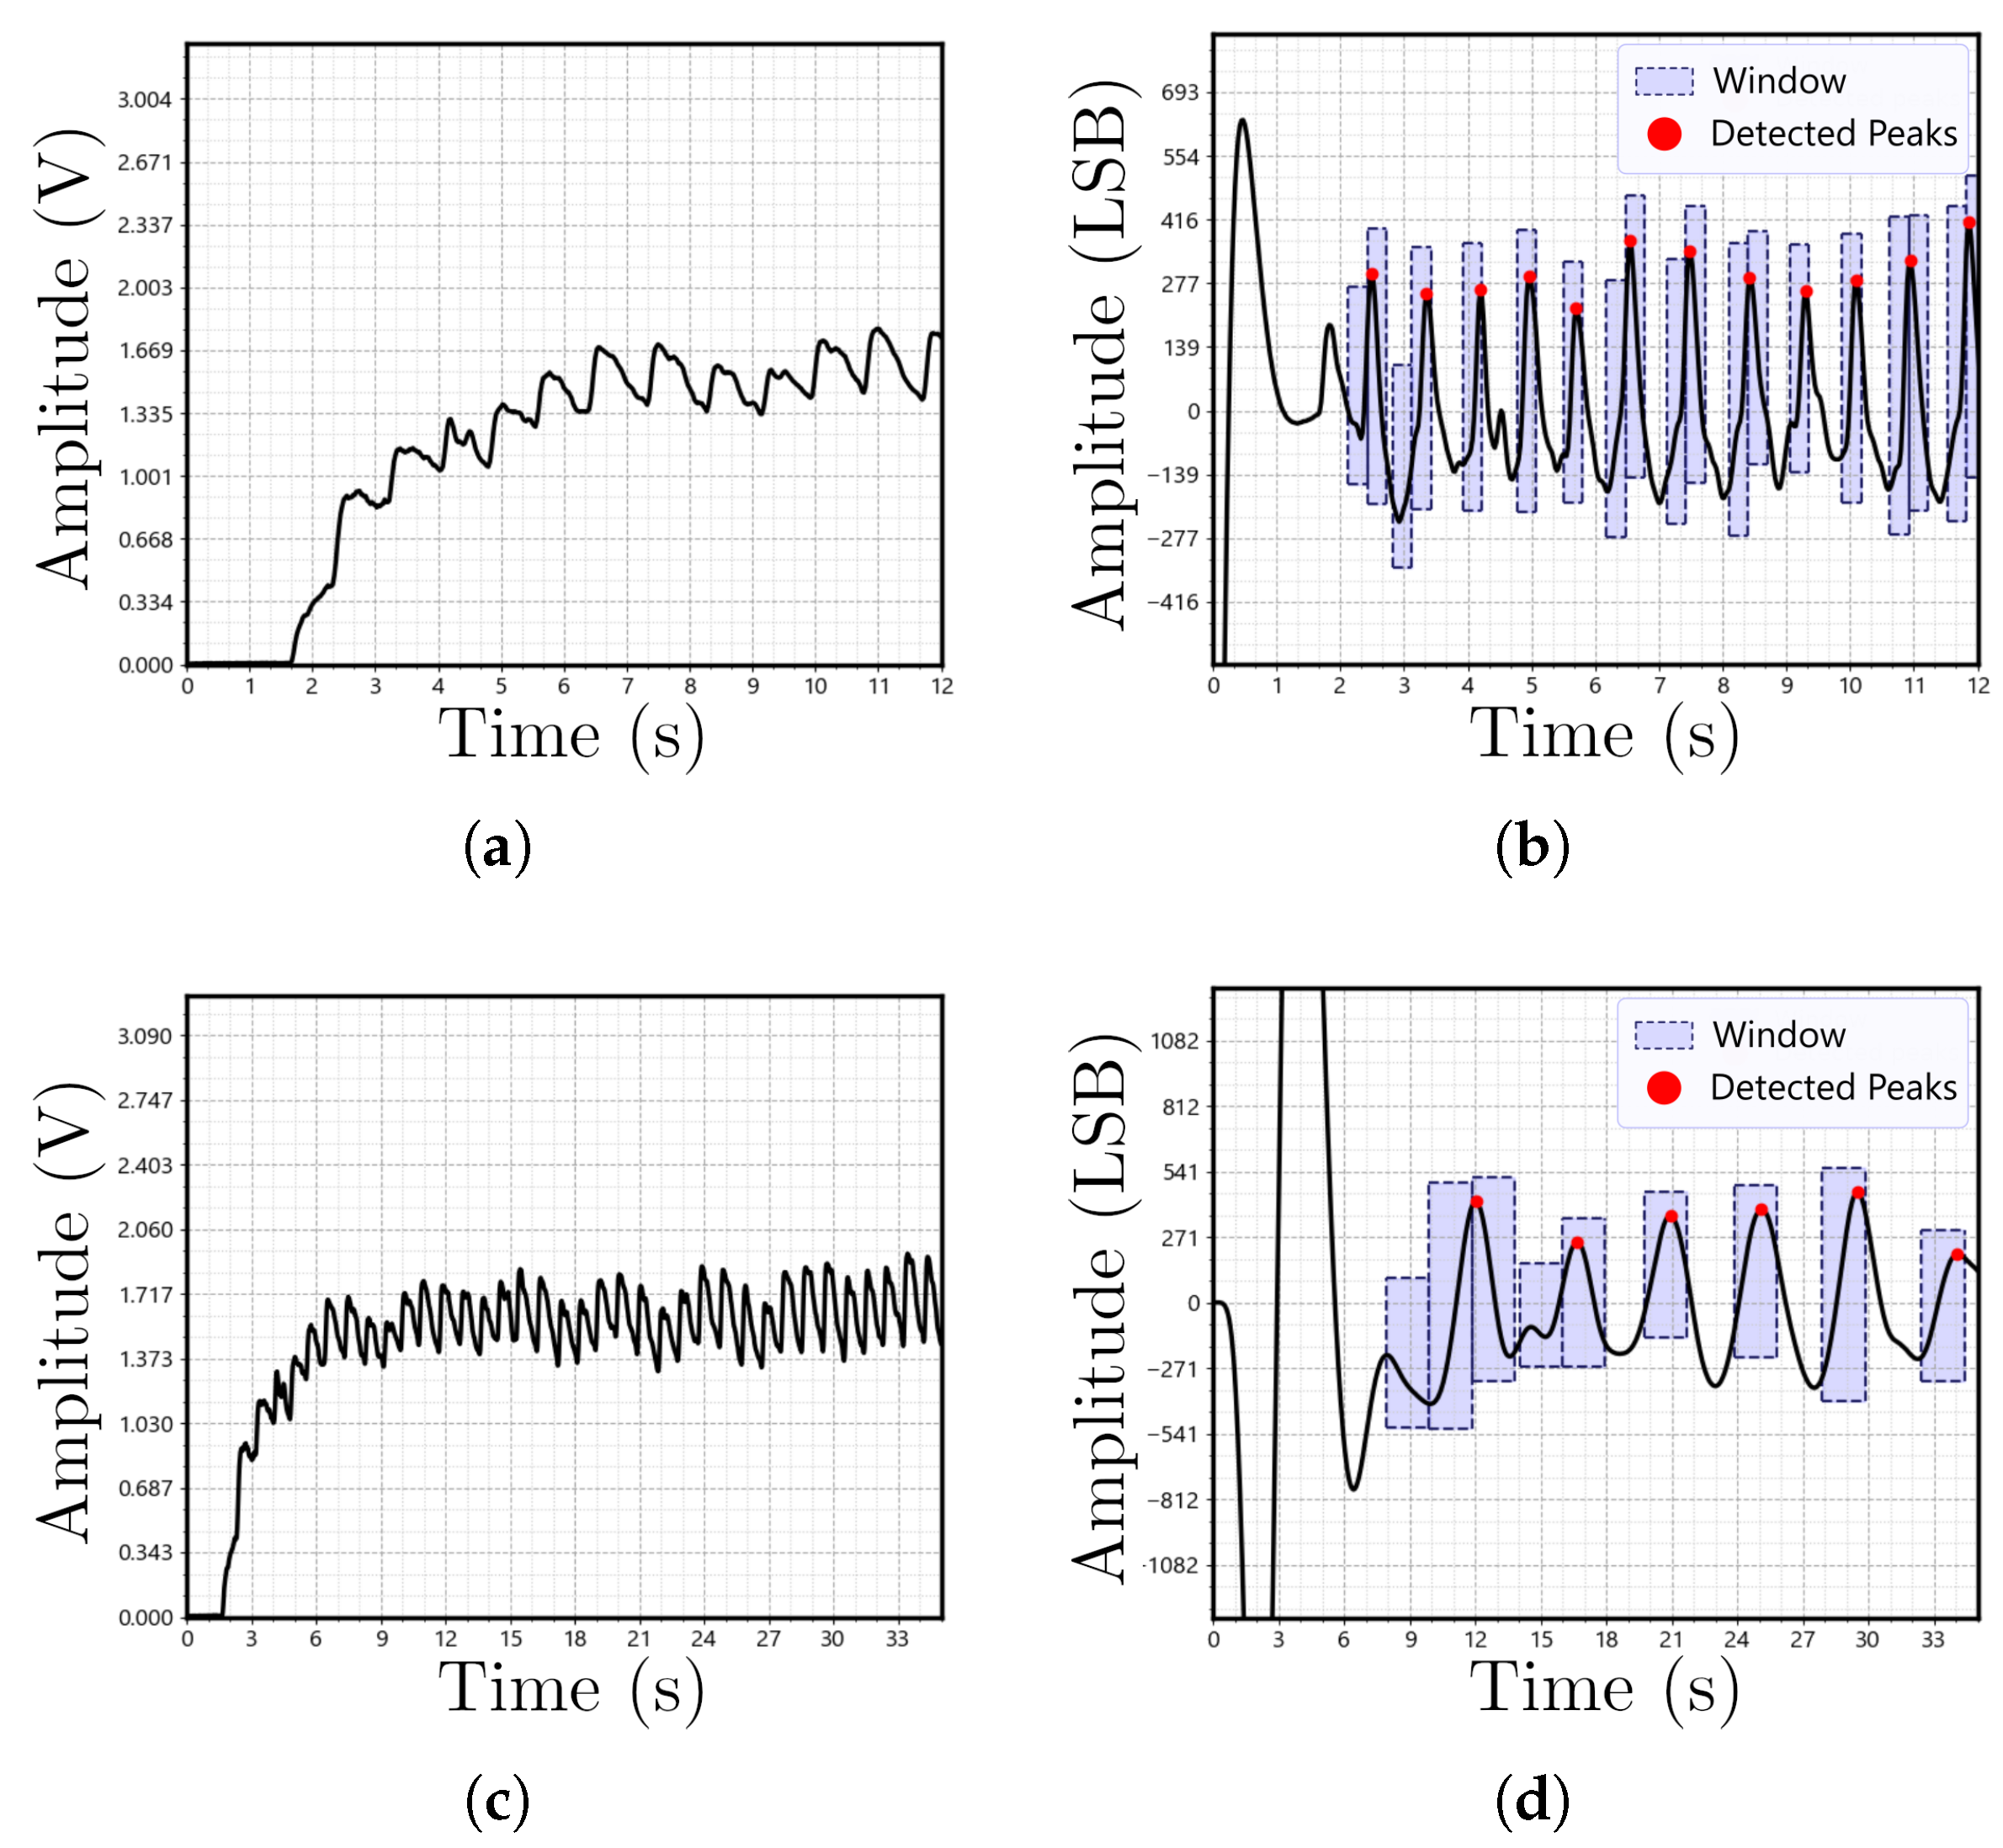
3.1. Corporal Temperature Sensor Calibration

The corporal thermometer was calibrated within the range from 32.5 °C to 41.4 °C using a controlled heating system. The procedure was done by comparing the output voltage V O 1 (see Figure 2a) with the temperature measured by a commercial thermometer. After ensuring reproducible experiments, the experimental data were fitted to an optimal linear model, in a least-squares sense, given by
T = V O 1 14.53 V cc ° C + 31.85 ° C ,
where T is the temperature in ° C and V cc is the battery supply voltage. As a result, the coefficient of determination r 2 = 0.9983 suggests a high linearity behavior, with a sensitivity of 4.4° C / V and 0.2 ° C resolution. From Equation (1), one can notice that the supply voltage is included in the model due a twofold reason: (i) it provides a stable reference voltage for the AFE and acquisition stages, and (ii) it allows us to keep a simple design with minimum components and less energy consumption.

3.2. PPG Signals Analysis

The breath and heart rates were extracted via the PPG signals. Figure 4a,c show the raw PPG signals for the HR and BR, respectively. Therein, one can see a high-frequency component and an envelope. The former is related to the cardiac cycle, whereas the latter is due to the respiratory rate. In Figure 4b,d we show the peaks detected by the PDA and the time window for digital filtering. As expected, the algorithm discards the initial time transients due to motion artifacts, and after a few seconds, starts to find local maxima, marked by red dotted peaks. Furthermore, one can see that the bandwidth is such that the filters operate with a fast response and without distorting the signals.

3.3. Experimental Results

We validate our design placing the WD on a volunteer. Under the user request, a measurement starts, and the WD streams the pre-processed signals to the MA, which displays the final values to the user, as shown in Figure 5. As the process finishes, the MA permanently stores the signals into the device memory, notifies the user, and gives him the option for contacting a medical service.
Table 1 summarizes the data of the WD energy consumption for three operating conditions, BLE advertisement, connection, and data streaming, which joint consume below 3 mAh. By considering a 60 m A h Li-ion battery, the device can operate in a continuous data acquisition and streaming state for about 13 h and 46 min with the temperature sensing module and 2 h 48 min with the PPG module. Conversely, if the WD diversifies the measurements, only enabling the temperature module, the device can perform 909 measures; meanwhile, with the PPG module, only 255 measurements can be done before charge or replacement of the battery.

4. Conclusions

In this work, we introduced an attractive wearable device with two main features, modular and flexible design. We demonstrated that our WD was able to wirelessly acquire and record corporal temperature, heart rate, and breath frequency in real-time. Our framework showed minimal hardware elements, low-energy consumption via Bluetooth communication, and the feature to connect several sensing modules sharing one central core for data acquisition, processing, and streaming to a custom-designed mobile application. Results showed that our proposal could serve as a proof-of-concept to design novel home-made and cost-effective wearables exhibiting enough sensitivity and resolution to measure parameters at physiological levels.

References

  1. Dias, D.; Paulo Silva Cunha, J. Wearable Health Devices-Vital Sign Moni-toring, Systems and Technologies. Sensors 2018, 18, 2414. [Google Scholar] [CrossRef] [PubMed]
  2. Cherrylyn, B.; Hee-Cheol, K. Wearable Computers in Human Perspective: The Decision Process of Innovation Acceptance with User Issues and Concerns. J. Em. Tech. Adv. Eng. 2012, 2, 573–580. [Google Scholar]
  3. Sang, Y.L.; Keeheon, L. Factors that influence an individual’s intention to adopt a wearable healthcare device: The case of a wearable fitness tracker. J. Tech. Fore. and Soc. Change 2018, 129, 154–163. [Google Scholar]
  4. Jamin, C.; Nicholas, O.; Lara, K. Wearable healthcare: Lessons from the past and a peek into the future. Telemat. Inform. 2017, 34, 1011–1023. [Google Scholar]
  5. Suphan, N.; Yigit, Y. Consumers and Physicians Perceptions about High Tech Wearable Health Products. Procedia Soc. Behav. Sci. 2015, 2015 195, 1261–1267. [Google Scholar]
  6. Minjeong, H.; Seongdong, L.; Hyunhyub, K. Wearable and flexible sensors for user-interactive health-monitoring devices. J. Mater. Chem. B 2018, 6, 4043–4064. [Google Scholar]
  7. Edwards, J. Medicine on the Move: Wearable devices supply health-care providers with the data and insights necessary to diagnose medical issues and create optimal treatment plans. IEEE Signal Process. Mag. 2019, 36, 8–11. [Google Scholar] [CrossRef]
  8. Mukhopadhyay, S.C. Wearable Sensors for Human Activity Monitoring: A Review. IEEE Sens. J. 2015, 2, 1321–1330. [Google Scholar] [CrossRef]
Figure 1. Block diagram of the proposed system.
Engproc 02 00075 g001
Figure 2. Schematic diagram of the sensing modules and analog-front-end (AFE) for signal conditioning. (a) Corporal thermometer. (b) Photoplethysmography (PPG) detector.
Engproc 02 00075 g002
Figure 3. Wearable device circuit boards. (a) Wearable device core. (b) Temperature sensing module. (c) Breath and heart rate sensing module.
Engproc 02 00075 g003
Figure 4. PPG signals of heart and breath rates. (a) Heart rate raw signal. (b) Heart rate filter signal and detected peaks. (c) Breath rate raw signal. (d) Breath rate filtered signal and detected peaks.
Engproc 02 00075 g004
Figure 5. Mobile application main view. (a) HR and DR display. (b) Temperature display. (c) Alter system notification.
Engproc 02 00075 g005
Table 1. WDC energy consumption, V c c = 3.3 V .
StateConsumption ( m A h )
BLE advertising0.24
BLE connected0.49
Data acquisition & streaming1.93
+Temperature sensing module+2.42
+PPG sensing module+2.77
+PPG sensing module enable+16.7
Publisher’s Note: MDPI stays neutral with regard to jurisdictional claims in published maps and institutional affiliations.

