1. Introduction
Non-invasive medical exploration of a human body or its parts by scanners using X-rays, micro waves, or nuclear magnetic resonance may be accompanied by undesirable physiological and psychological influence on an examined person. In the case of the magnetic resonance imaging (MRI) technique, the patient is exposed to the vibration of the gradient-coil system and the acoustic noise [
1]. Its negative impact during scanning has already been observed in the subject’s palm bloodstream changes and the evoked vocal cord tension in the simultaneously recorded speech signal [
2]. The stress induced in this way can be evaluated also by monitoring the blood pressure (BP) and the heart rate (HR). The photoplethysmographic (PPG) measurement can be successfully used for non-invasive pickup of vital functions of the vascular system from the skin [
3] by detecting blood volume changes inside the tissue. In practice, two basic types of optical sensors based on transmission and reflection principles are used for PPG wave pick-up [
4]. The PPG signals can be sensed and recorded from various body positions, e.g., finger, ear, wrist, arm, neck, nose, etc. [
5].
In our previous research [
6,
7], the PPG signal was picked up from the little or index finger of the left or right hand using the sensor based on transmission principle only. The current work is focused on testing two types of PPG sensors working in transmission and reflection modes placed on different parts of a human body. Our aim was to find a general recommendation for all tested persons or to confirm a necessity of individual settings for every person and both types of tested PPG sensors. We also analyze the PPG wave features (energetic and temporal) as well as the statistical parameters of HR values determined from the PPG signal. For comparison of the HR values determined from the PPG signal, the control measurement with a portable blood pressure monitor (BPM) device is also performed. The final aim is to determine conditions and formulate practical advices for the development of a wearable PPG sensor with wireless connection, enabling measurement in the magnetic field environment with radio-frequency disturbance caused by execution of scanning sequences of the MRI tomograph.
2. Subject and Methods
2.1. Basic Principles and Types of PPG Sensors
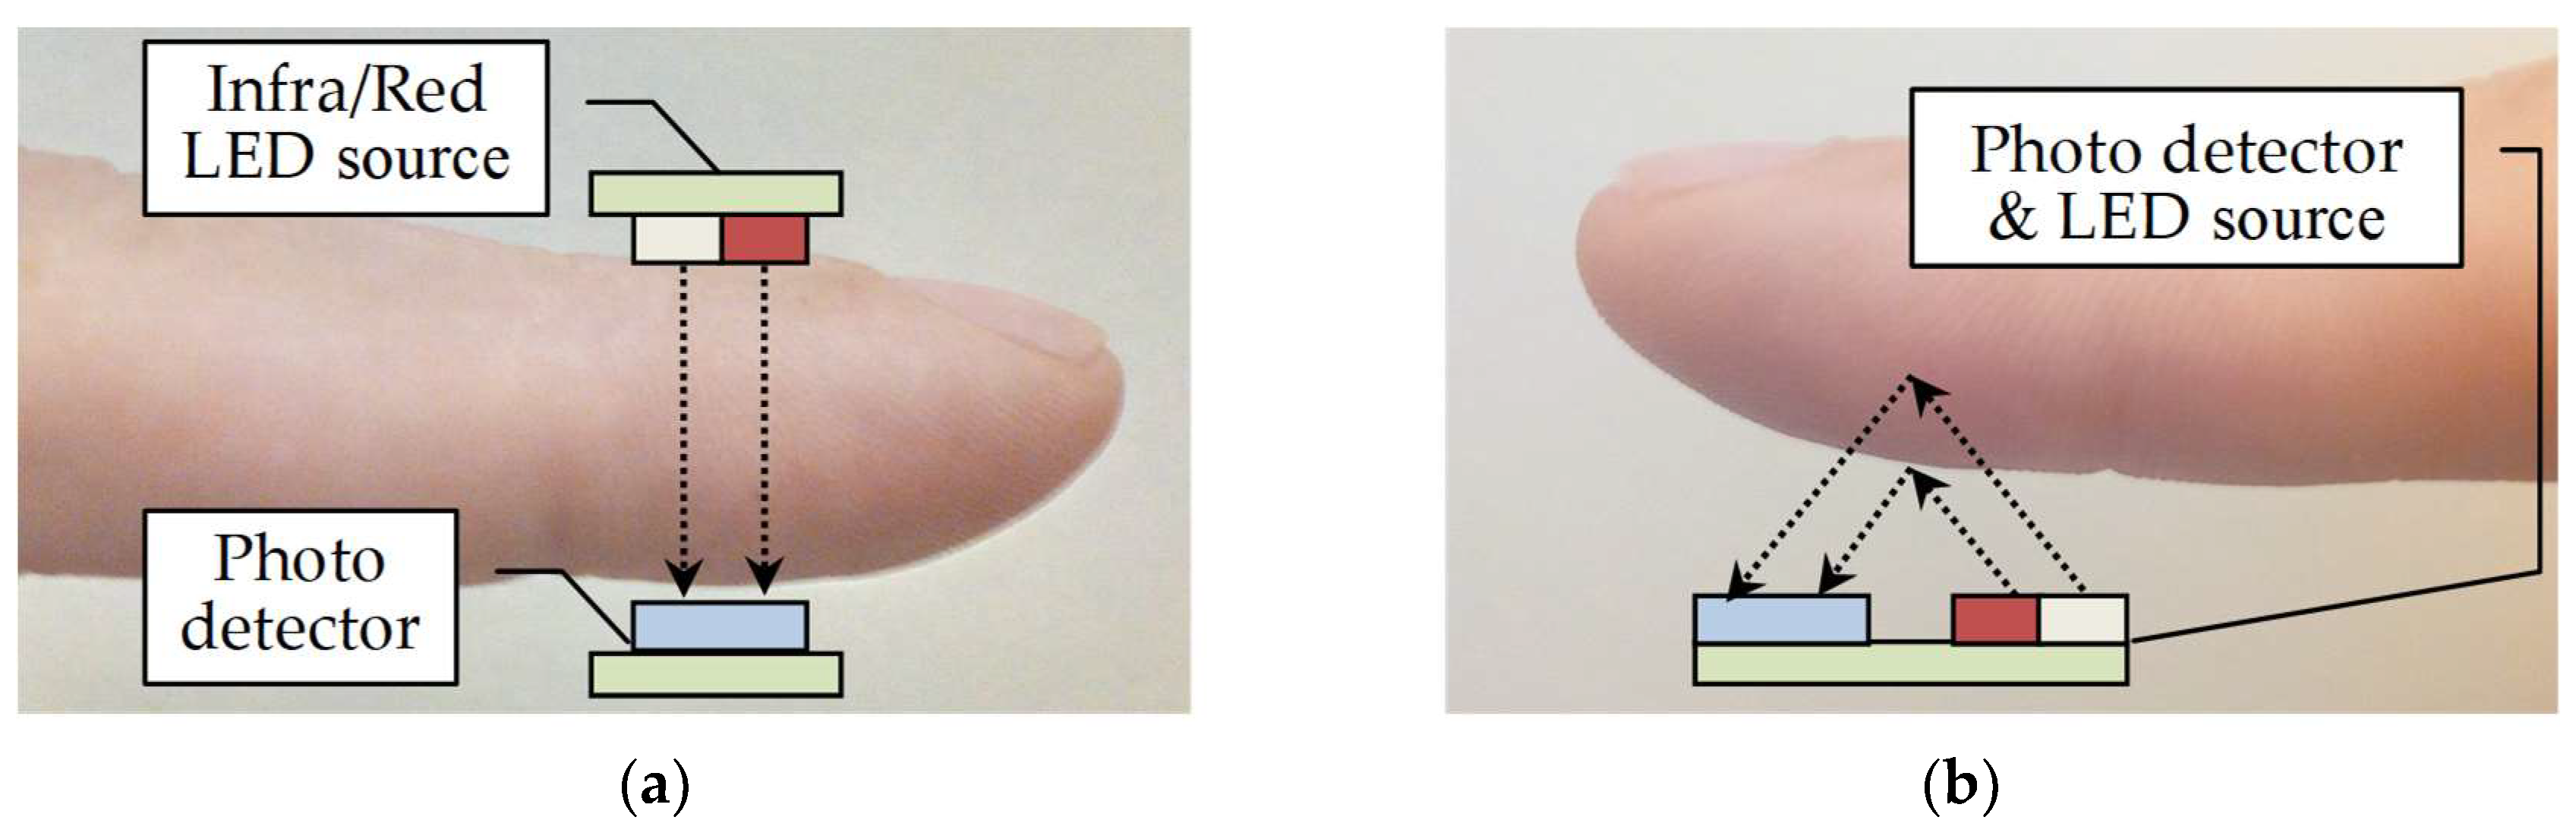
The optical sensors for measurement of the PPG signal can work in transmission or reflection modes. Both sensor types consist of two parts: a transmitter (light source) and a receiver (photo detector). The arrangement of the light source(s) consisting of one or more infra/red light emitting diodes (IF/RD LED) and a photo detector (PHD) depends on the operation mode—as documented by the principal scheme in
Figure 1.
In the transmission mode measurement, the IF/RD LED and PHD are placed on opposite sides of the measured human tissue (see
Figure 1a). Here, the PHD detects a residual light from the source after its absorption by the tissue. In practice, this type of a wearable PPG sensor is usually realized in the form of a finger ring (FR), a finger clip (FC), or an ear clip (EC). The finger types are widely used in medical applications (FC mainly for pulse oximeters); the EC realization is often applied for vitality monitoring.
In the PPG sensors working on the reflection principle, the IF/RD LEDs and the PHD measuring the intensity of the reflected light are placed side by side on the same body surface (see
Figure 1b). Therefore, the reflection sensors offer higher flexibility of the PPG signal measurement from different locations on the body, and thus, they are more suitable for non-invasive wearable long-term monitoring devices.
2.2. Analysis of Signal Properties of the PPG Wave
For description of signal properties of the sensed PPG waves the energetic, temporal, and statistical parameters can be determined. The first one used in our current work is the root-mean-square (RMS) value
SRMS of the PPG signal with
M processed samples
x(
i) calculated as
Another energetic parameter
EnTK can be determined using the absolute value of the mean of the Teager–Kaiser energy operator
OTK [
8]
The upper and lower envelopes of the signal are determined by the RMS in a sliding window with the length of
wL samples, where
wL <<
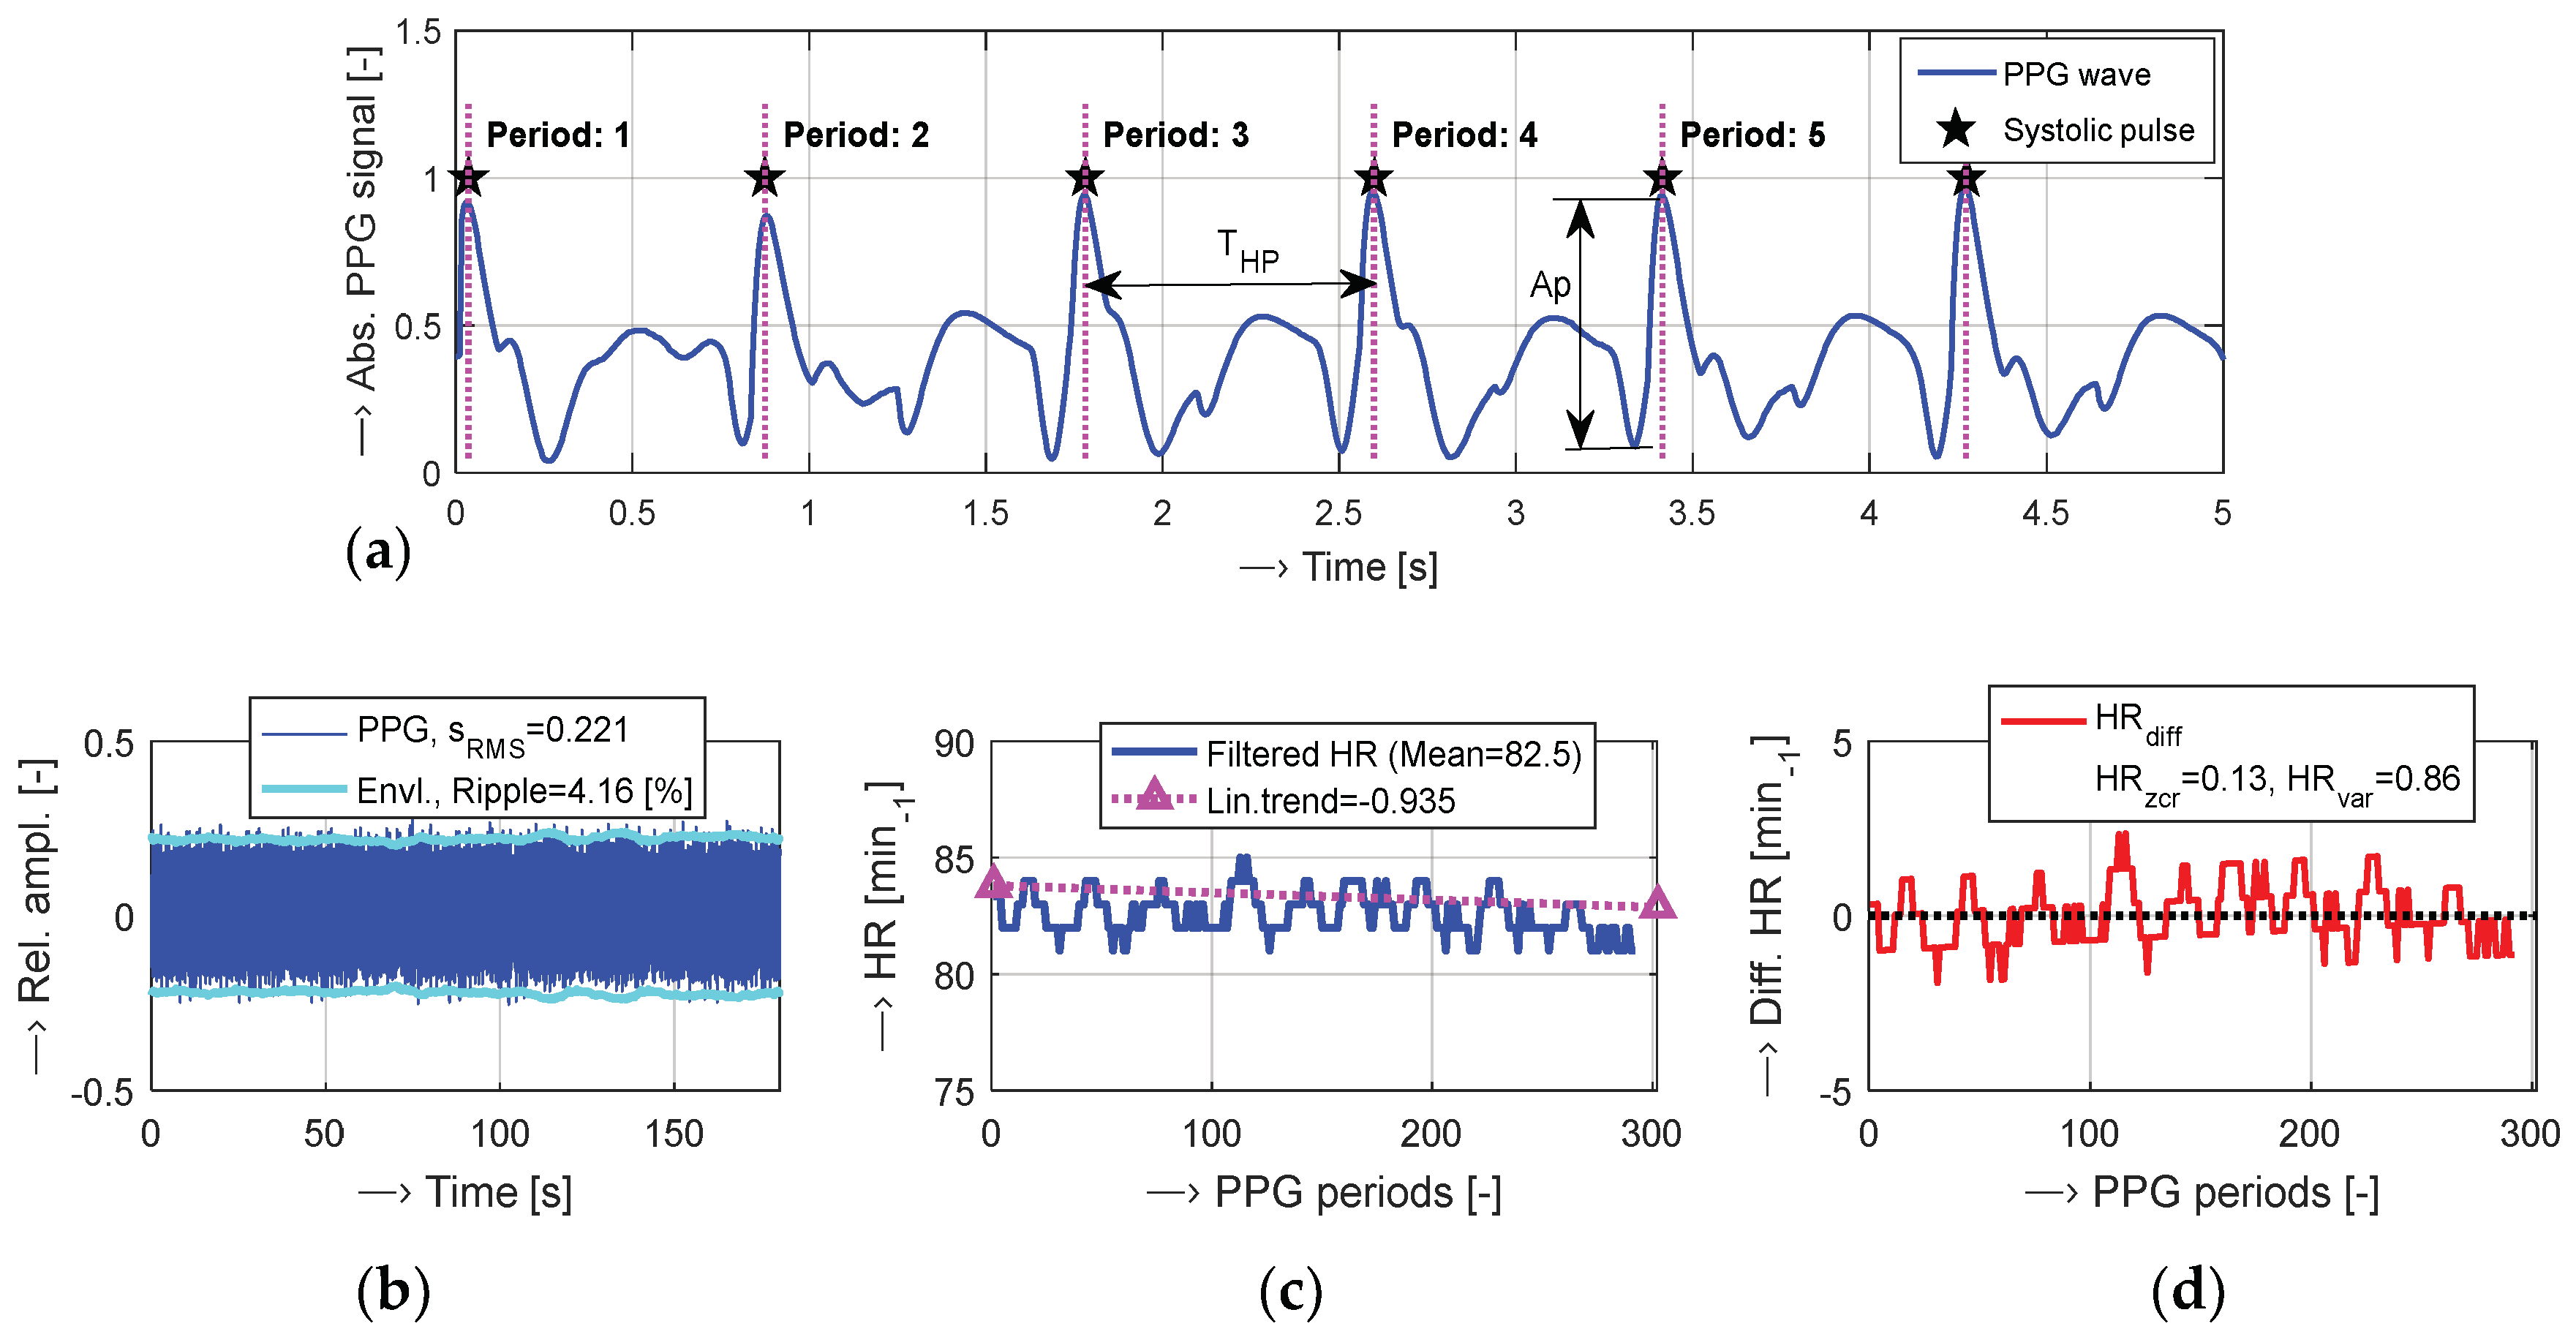
M. Next, we calculate the PPG signal ripple as the relative amplitude perturbation from the detected peak amplitudes expressed in percentage as
where
Api is the value of the systolic pulse amplitude in the
ith heart pulse time period
THP, and
NHP is the number of the processed PPG periods—see an example in
Figure 2.
The methodology of HR determination from the PPG wave was described in more detail in [
7]. In principle, the procedure works in three steps: the systolic peaks are localized in the PPG signal, then the heart pulse periods
THP are determined, and finally the HR in [min
−1] is calculated as HR = 60/
THP. The obtained sequence of HR values is next smoothed by a 3-point median filter and the linear trend (LT) is calculated (see
Figure 2c). After the mean and LT removal from the HR sequence we get HR
DIFF values (see
Figure 2d) that are then used to calculate the average number of zero-crossings (HR
ZCR) as a number of all zero-crossings
NZCR divided by the number of cycles
NHP (HR
ZCR =
NZCR/
NHP) and the variance (HR
VAR) which is a squared standard deviation.
3. Instrumentation, Experiments, and Results
Two types of transmission PPG sensors were used in our experiments. The first one was the HRM-2511E by Kyoto Electronic Manufacturing Co., Tokyo, Japan, practically realized as a rubber finger ring and consisting of an IR LED transmitter and a PHD detector [
9] further called “
FRS” (finger ring sensor). The second one was realized in the form of an ear clip originally used as a supplementary component for monitoring heart rate beats during a sporting activity on the Kettler Consul Home Bike [
10] next called “
ECS” (ear clip sensor). In both these sensors, the output from the PHD element must be pre-amplified and double filtered in a cascade connection using the Embedded Lab Easy Pulse sensor module [
9]. As a representative of the reflection PPG sensors (further called “
REFS”) we tested the Pulse Sensor Amped PRODUCT (Adafruit 1093) [
11]. This realization has the basic analog interface integrated on the board together with the light transmitter and receiver. In both cases, the pre-processed clean PPG signal comes to the analog mixer Behringer XENYX Q802 and is digitized with the basic sampling frequency
fs = 2 kHz using the USB interface to be fed to the PC.
In all performed experiments of the PPG signal recording, the pressure cuff of the blood pressure monitor (BPM) was put on the opposite arm to eliminate the supposed influence of the inflated BPM arm cuff on the blood flow in the measured hand. We collected two databases of the recorded PPG signals sensed from six healthy volunteer persons—three males (JP, TD, and MG) and three females (AP, EN, and BO) with the mean age of 49 years. The tested person was always sitting on a chair at a table without any physiological/psychological stimuli evocating stress in normal interior conditions. The database DB1 consists of the PPG signals recorded by sensors working in a transmission mode. We tested four fingers from the little to the index finger—on both hands (“P1L/R,..,P4L/R”) and both ear lobes (“UL/R”) to finally obtain 5 × 2 = 10 of 180-s records for each tested person. The database DB2 contains the PPG material picked up by the REFS sensor with the same number of 10 records (from five fingers of the left and right hand—“P1L/R,..,P5L/R”) and the total duration of 30 min per person. All collected records were next processed to obtain PPG signal properties (SRMS, EnTK, and Ripple) and HR values including their zero-crossings and variance statistical parameters.
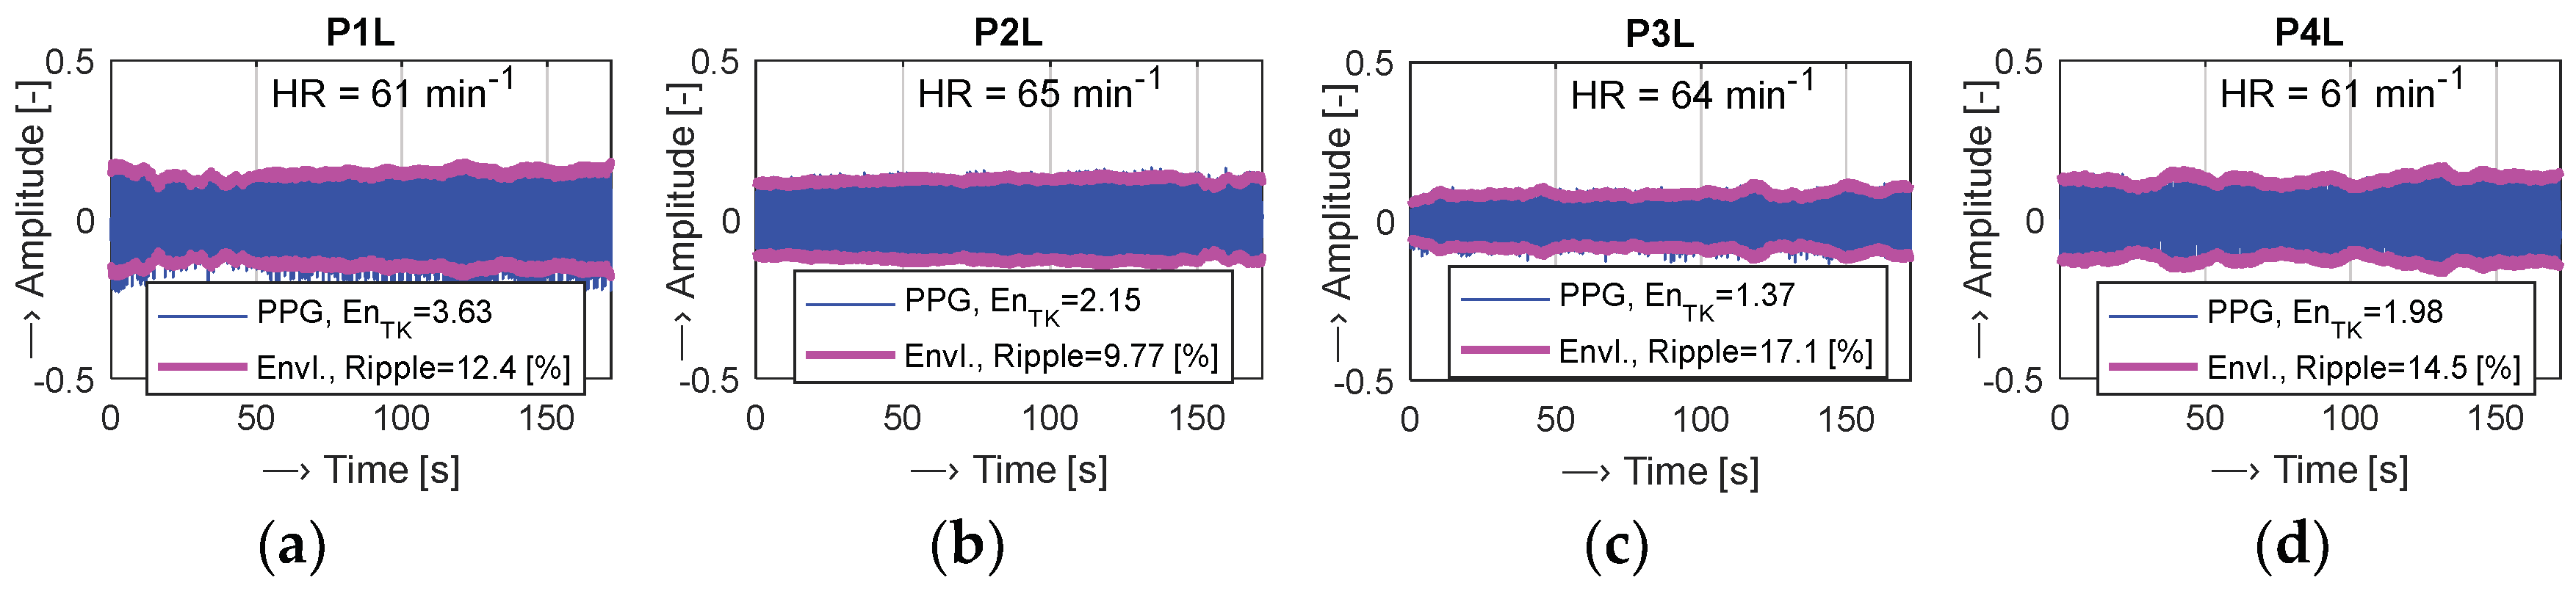
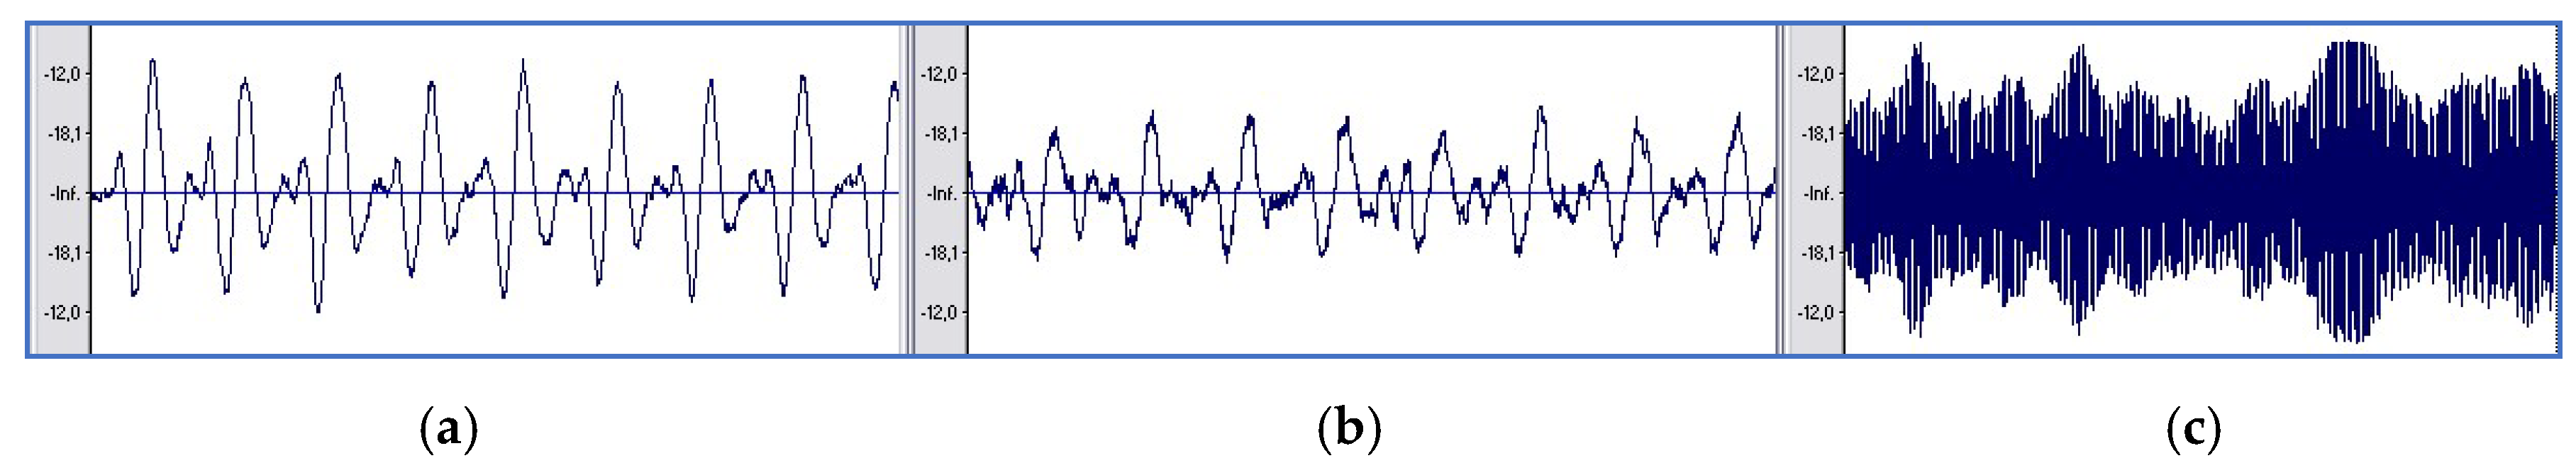
Visualization of the PPG waves together with the signal envelopes picked up using the
FRS sensor from four fingers of the left hand of the male person JP is shown in
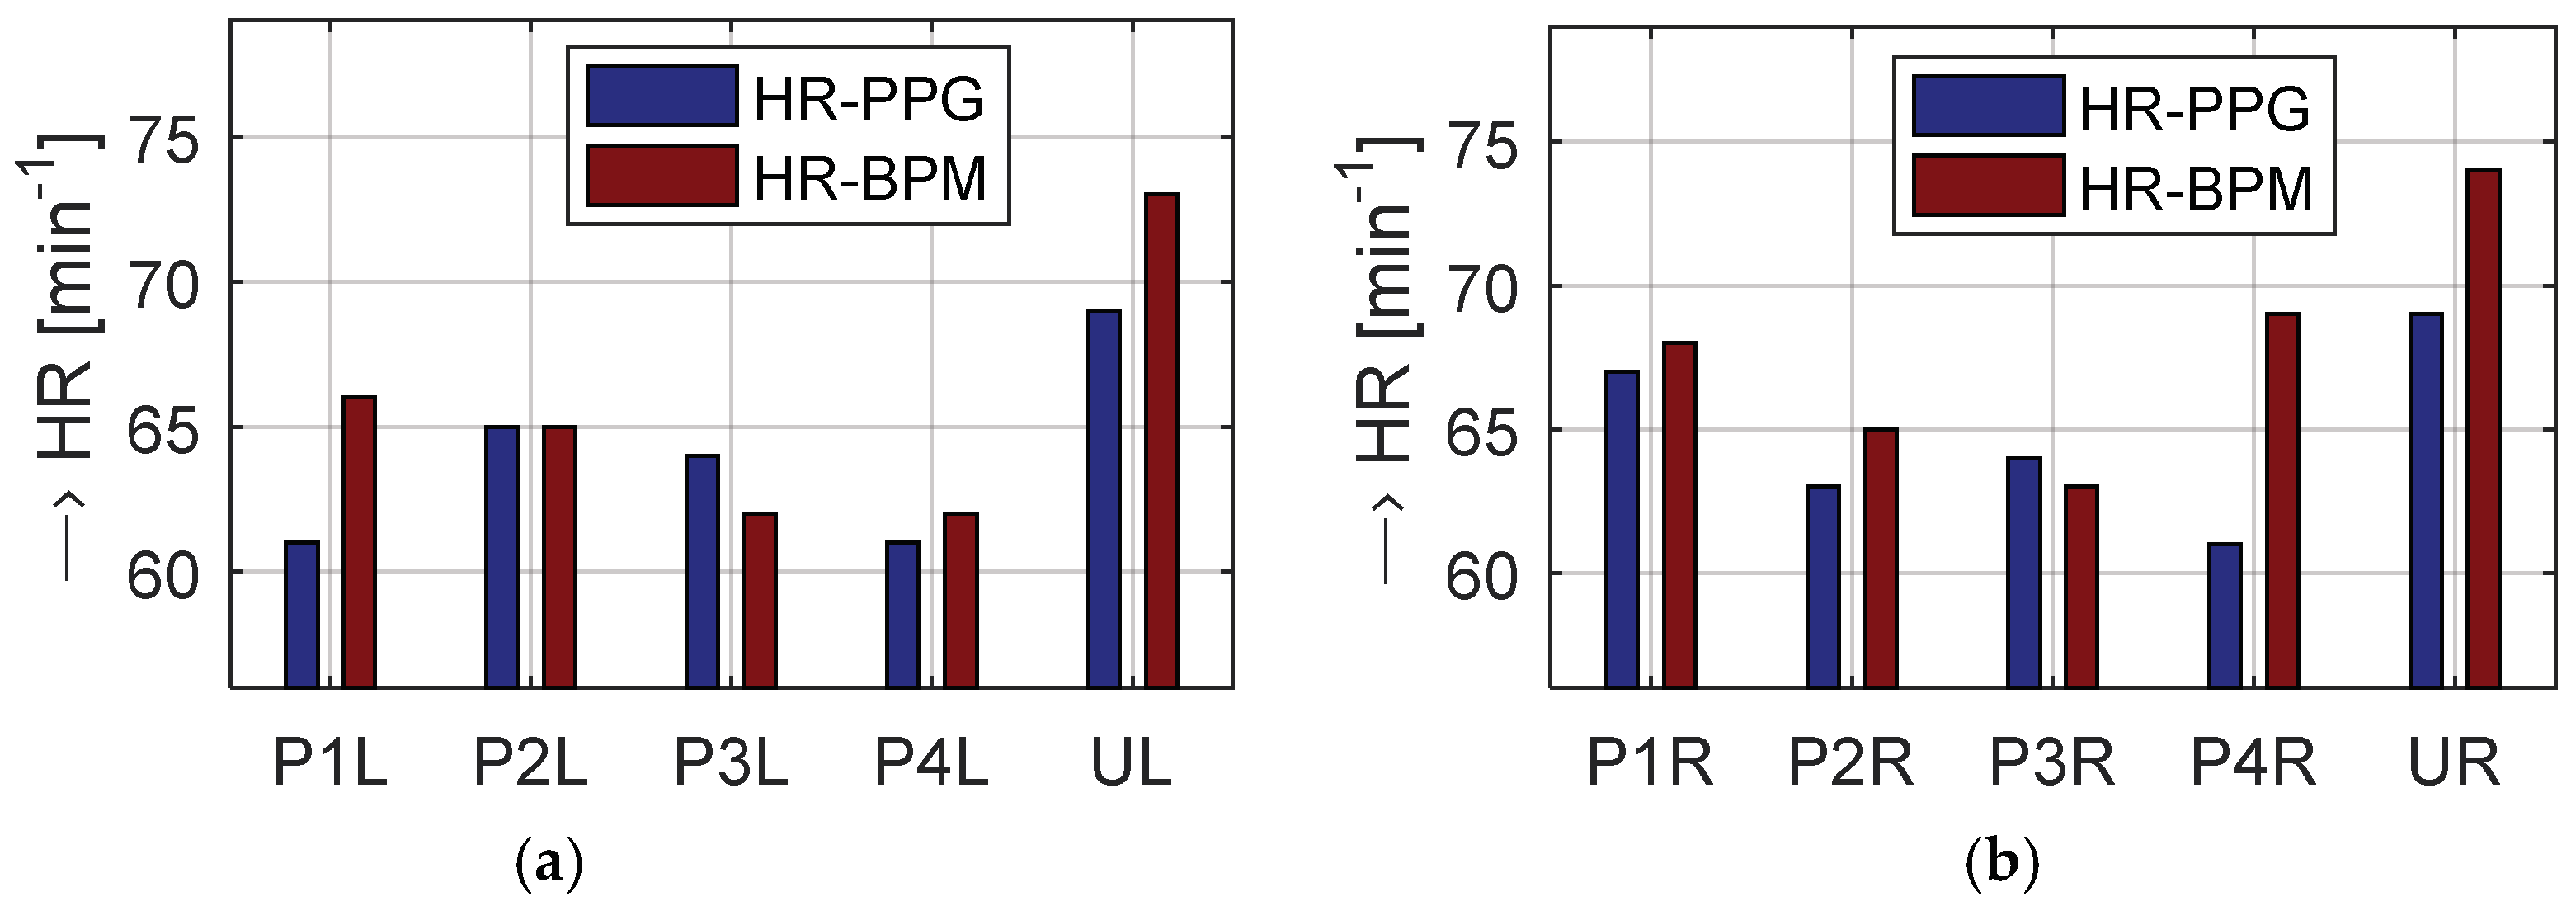
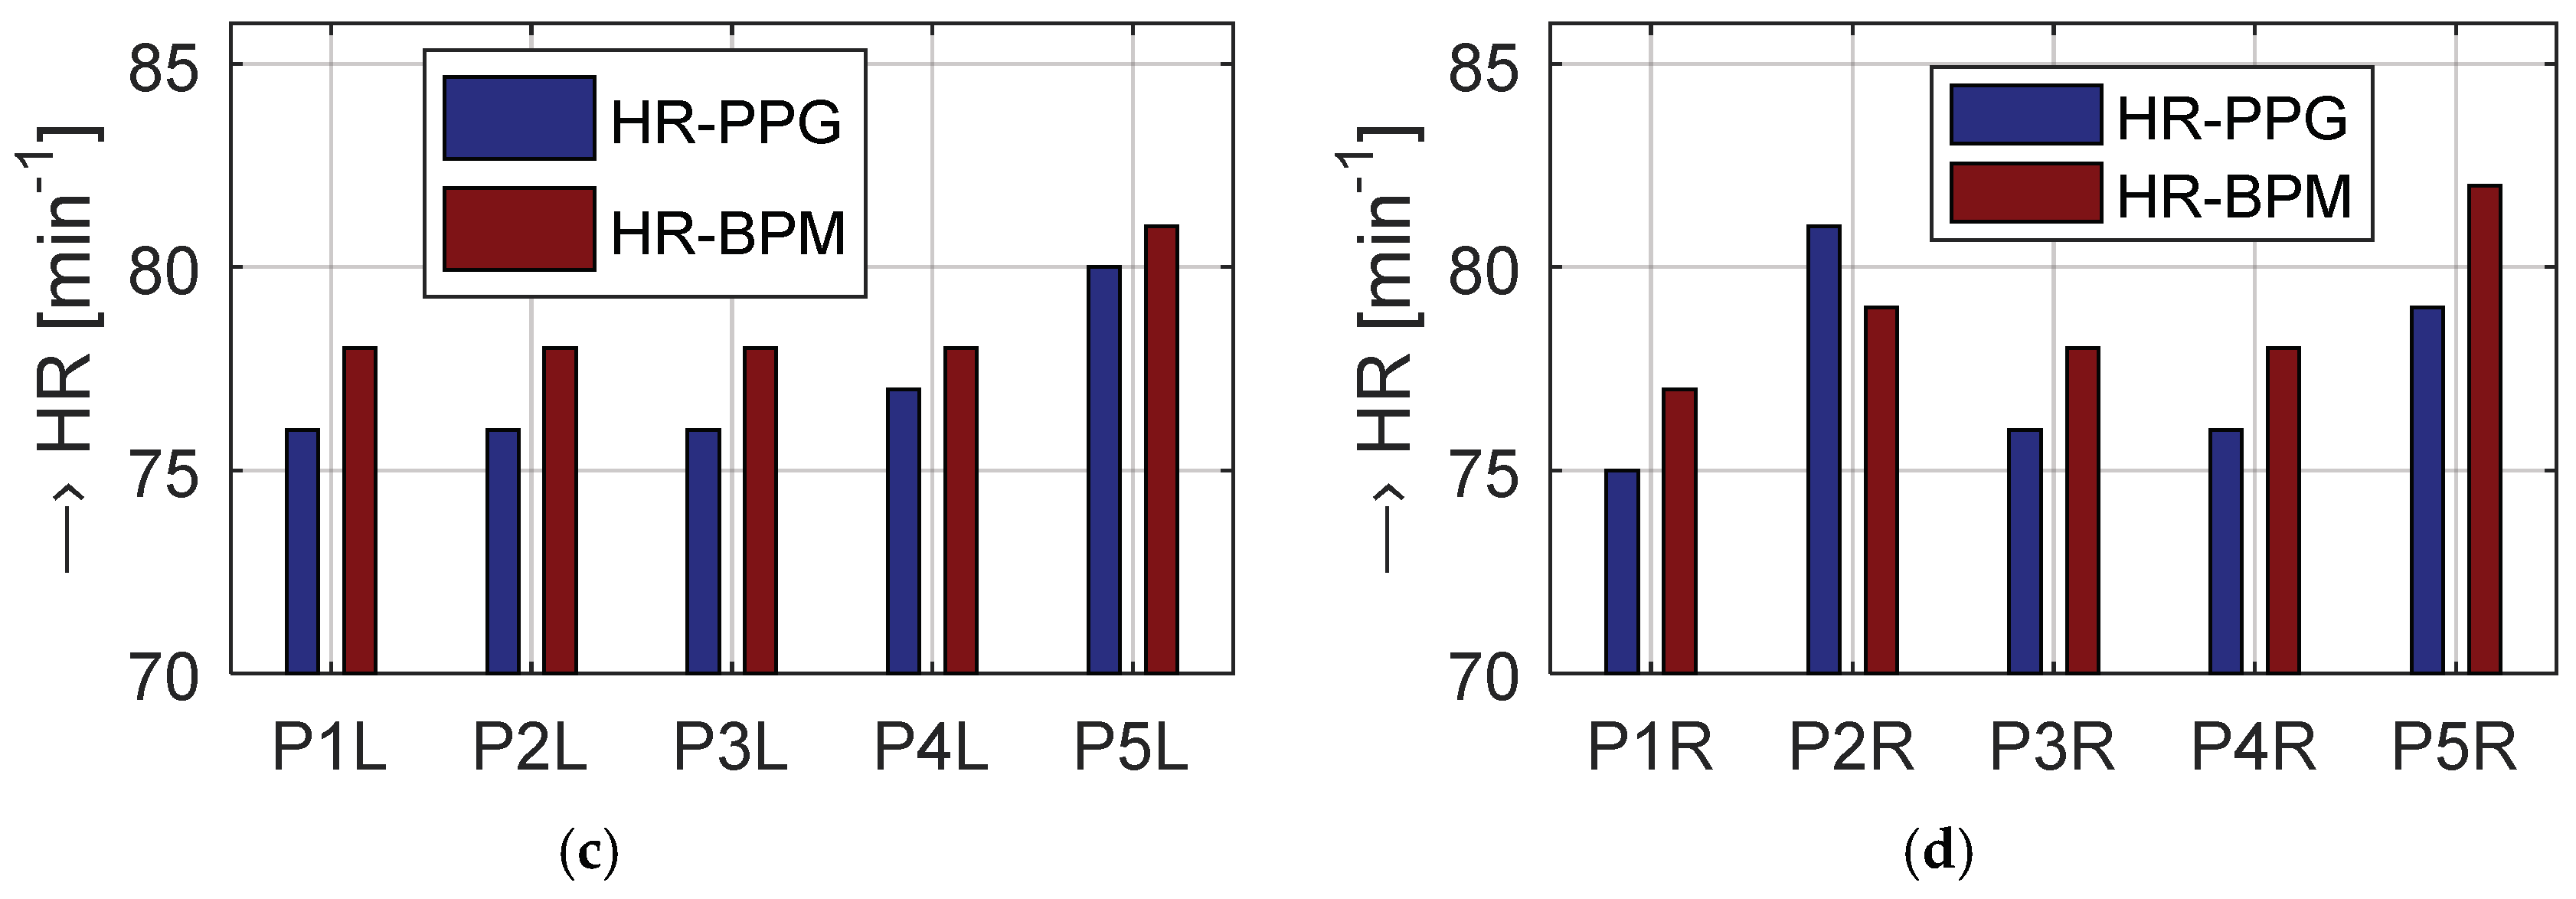
Figure 3. Graphical comparison of partial results for both hands of the person JP showing mean HR values determined from PPG signals and measured by a BPM device for the
REFS sensor is presented in
Figure 4. The numerical comparison for four fingers of the right hand and the right ear lobe using
FRS/ECS sensors together with values for five fingers using the
REFS sensor for the person AP is given in
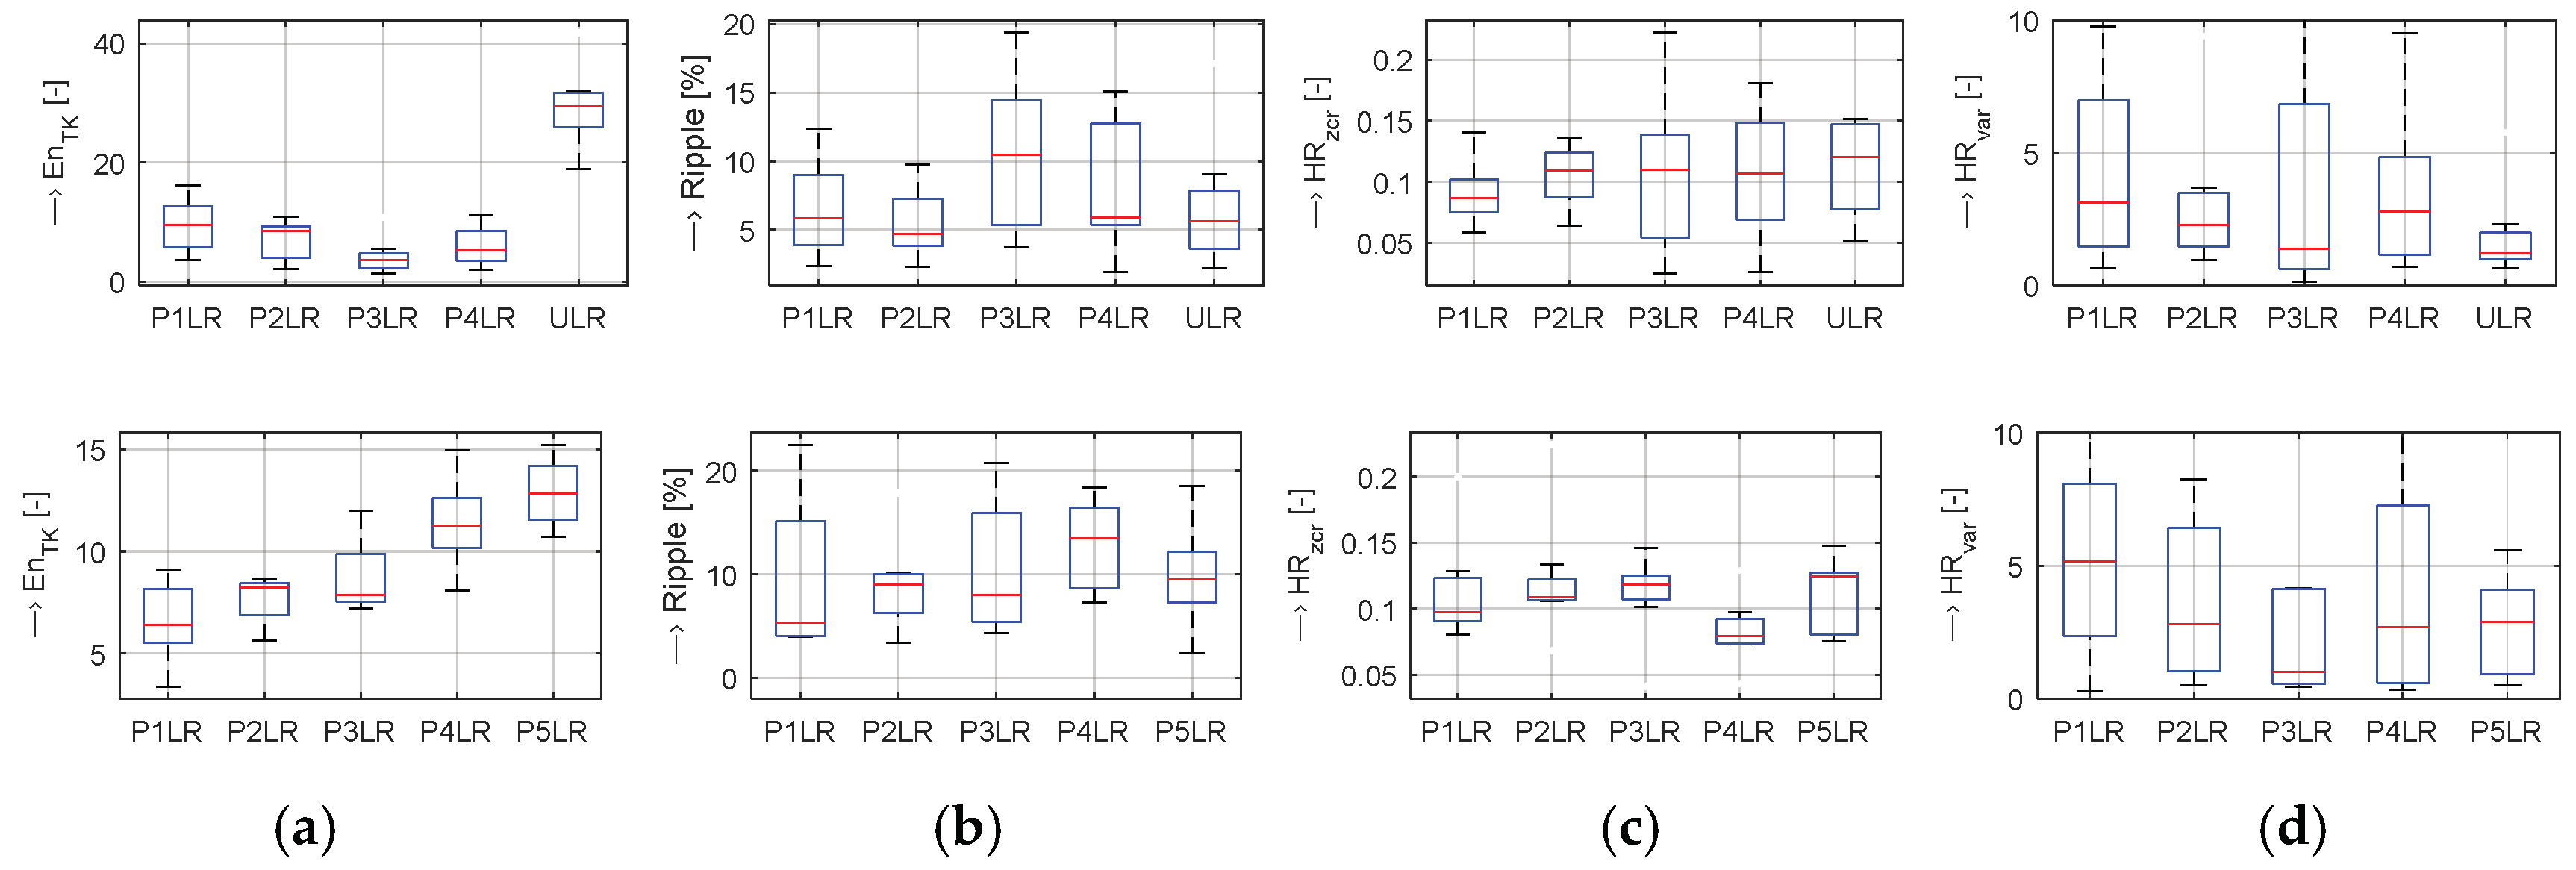
Table 1. Graphical summary comparison by the box-plots of PPG signal properties and HR statistical parameters for all tested persons and two basic types of PPG sensors is presented in
Figure 5.
4. Discussion of Obtained Results
Measurements using the
FRS PPG sensor show differences in the signal energy expressed by En
TK and
SRMS parameters, and the signal short-time stability represented by the envelope ripple. The PPG signal from the little finger is characterized by the greatest energy and approximately average ripple (see
Figure 3a). This finger is the thinnest one, and the most amount of light from the IR LED source penetrates through it to the sensor photo-detector. In the same manner, the smallest energy and the highest ripple of the PPG signal is picked up from the thickest middle finger (see
Figure 3c). Relatively good signal energy and approximately average ripple are obtained from the index finger (see
Figure 3d). The PPG signal from thumbs cannot be finally sensed due to their too-thick tissue. The signal energy from an ear lobe is higher (a lobe is thinner than a finger) but also with higher ripple and generally worse signal properties. Moreover, this realization of a PPG sensor seems not very suitable for longer precise measurement—the tested person has often a problem to rest without any movement of a head. This fact is confirmed also by comparison of HR values determined from the PPG signal and the reference BPM device in
Figure 4a,b—the greatest differences can be seen for the
ECS sensor realization.
Table 1 shows numerical comparison of the PPG signal properties together with the subsequently determined HR parameters. These partial results are in correspondence with the summary ones presented in the form of box-plots for basic statistical properties of S
RMS, En
TK, and ripple as well as HR
ZCR and HR
VAR values for all tested persons (see upper set of graphs in
Figure 5).
From analysis and comparison of PPG signals recorded with the help of the
REFS sensor follows that the best signal properties (higher energy and smaller ripple) were observed by sensing from the thumbs. It is documented by partial values in
Table 1 for the female person AP and confirmed by a summary comparison for all tested persons in the lower set of graphs in
Figure 5. The differences in stability and precision between HR values determined from the PPG and the BPM are relatively small and aligned excluding the middle finger PPG signal—see bar-graphs in
Figure 4c,d. As the
REFS sensor picks up the appropriate PPG signal from all five fingers with signal properties similar to those for the
FRS type, we prefer this type of sensors in our next experiments. We also tried to sense the PPG signal from a wrist on left and right hands with the help of the
REFS sensor, but the obtained PPG much depends on the accurate placement of the source LED and PHD element relative to the vein (see
Figure 6). The best signal quality was observed for the sensor placed directly on the vein. When the detector is placed on the border of the vein, the ripple is too high giving much modulated PPG waves. For the sensor placement outside the vein, the signal is disturbed and has lower amplitude. For this reason, the expensive commercial fitness bracelets measuring also HR values from the wrist have two or three pieces of LED sources arranged around the larger PHD element.
5. Conclusions
The comparison of two realizations of the PPG sensors working on the transmission principle shows that the PPG wave taken from the finger ring type is more stable and cleaner than that from the ear lobe type. The detailed analysis of the PPG signals picked up from four fingers yielded dependence of the signal energy and ripple on the finger tissue volume without relevant differences between the left and right hand. Worse PPG signal properties are probably the result of a small number of weak capillaries in an ear lobe which causes weaker blood flow detection. In the case of the PPG sensor working on the reflection principle, the dependence on the tissue volume was not observed, but the dependence on the size of a finger surface. As regards the accuracy and stability of the HR determined from the PPG signal in comparison with the discrete BPM values, essential differences were detected according to the used finger and the type of the PPG sensor but not to the type of the hand (left/right) or the gender (male/female) of the tested person.
In the next research, we will test the REFS PPG sensor in more detail. While the transmission sensors usually consist only of the optical emitter and detector, the reflection ones are integrated with an analog interface on the basic board. For proper and safe function in the low magnetic field environment with RF pulses disturbance in the scanning area of the MRI device the sensor must be shielded by the cover from a non-ferromagnetic material, e.g., aluminum.
Author Contributions
Conception and design of the study (J.P., A.P., I.F.), measurement (J.P., A.P.), data collection and processing (J.P.), writing (J.P., A.P.), English correction (A.P.), paper review and advice (I.F.). All authors have read and agreed to the published version of the manuscript.
Funding
This work was funded by the Slovak Scientific Grant Agency projects VEGA2/0003/20, 2/0125/19, and the COST Action CA16116.
Acknowledgments
We would like to thank all our colleagues and other volunteers who participated in the BPM devices evaluation experiment.
Conflicts of Interest
The authors declare no conflict of interest.
References
- Tan, E.T.; Hardy, C.J.; Shu, Y.; Guidon, A.; Huston, J.; Bernstein, M.A.; Foo, T.K.; In, M.-H. Reduced acoustic noise in diffusion tensor imaging on a compact MRI system. Magn. Reson. Med. 2017, 79, 2902–2911. [Google Scholar] [CrossRef] [PubMed]
- Simantiraki, O.; Giannakakis, G.; Pampouchidou, A.; Tsiknakis, M. Stress Detection from Speech Using Spectral Slope Measurements. In Pervasive Computing Paradigms for Mental Health; Springer: Cham, Switzerland, 2016; pp. 41–50. [Google Scholar] [CrossRef]
- Allen, J. Photoplethysmography and its application in clinical physiological measurement. Physiol. Meas. 2007, 28, R1–R39. [Google Scholar] [CrossRef] [PubMed]
- Majumder, S.; Mondal, T.; Deen, M.J. Wearable Sensors for Remote Health Monitoring. Sensors 2017, 17, 130. [Google Scholar] [CrossRef] [PubMed]
- Jarchi, D.; Salvi, D.; Tarassenko, L.; Clifton, D.A. Validation of Instantaneous Respiratory Rate Using Reflectance PPG from Different Body Positions. Sensors 2018, 18, 3705. [Google Scholar] [CrossRef] [PubMed]
- Přibil, J.; Přibilová, A.; Frollo, I. Physiological Impact of Vibration and Noise in an Open-Air Magnetic Resonance Imager: Analysis of a PPG Signal of an Examined Person. Proceedings 2019, 42, 14. [Google Scholar] [CrossRef]
- Přibil, J.; Přibilová, A.; Frollo, I. First-Step PPG Signal Analysis for Evaluation of Stress Induced during Scanning in the Open-Air MRI Device. Sensors 2020, 20, 3532. [Google Scholar] [CrossRef]
- Boudraa, A.-O.; Salzenstein, F. Teager–Kaiser energy methods for signal and image analysis: A review. Digit. Signal Process. 2018, 78, 338–375. [Google Scholar] [CrossRef]
- Abdullah, S.K. Remote Heart Rate Monitor System using NodeMcu Microcontroller and easy pulse sensor v1.1. IOP Conf. Ser. Mater. Sci. Eng. 2019, 518, 052016. [Google Scholar] [CrossRef]
- Kettler Consul Super–Art. Nr. 07954-900. User Manual. Available online: https://www.libble.eu/kettler/c457749/ (accessed on 14 July 2020).
- Pulse Sensor Amped Product (Adafruit 1093): World Famous Electronics LLC. Ecommerce Getting Starter Guide. Available online: https://pulsesensor.com/pages/code-and-guide (accessed on 16 July 2020).
| Publisher’s Note: MDPI stays neutral with regard to jurisdictional claims in published maps and institutional affiliations. |
© 2020 by the authors. Licensee MDPI, Basel, Switzerland. This article is an open access article distributed under the terms and conditions of the Creative Commons Attribution (CC BY) license (https://creativecommons.org/licenses/by/4.0/).


