Proceeding Paper

A Self-Learning and Adaptive Control Scheme for Phantom Prosthesis Control Using Combined Neuromuscular and Brain-Wave Bio-Signals †

by
Ejay Nsugbe
1,*,
Oluwarotimi Williams Samuel
2,*,
Mojisola Grace Asogbon
2 and
Guanglin Li
2
1
Independent Researcher
2
CAS Key Laboratory of Human-Machine Intelligence-Synergy Systems, Shenzhen Institutes of Advanced Technology (SIAT), Chinese Academy of Sciences (CAS), Shenzhen 518055, China
*
Authors to whom correspondence should be addressed.
Presented at the 7th Electronic Conference on Sensors and Applications, 15–30 November 2020; Available online: https://ecsa-7.sciforum.net/.
Eng. Proc. 2020, 2(1), 59; https://doi.org/10.3390/ecsa-7-08169
Published: 14 November 2020
(This article belongs to the Proceedings of 7th International Electronic Conference on Sensors and Applications)

Abstract

:
The control scheme in a myoelectric prosthesis includes a pattern recognition section whose task is to decode an input signal, produce a respective actuation signal and drive the motors in the prosthesis limb towards the completion of the user’s intended gesture motion. The pattern recognition architecture works with a classifier which is typically trained and calibrated offline with a supervised learning framework. This method involves the training of classifiers which form part of the pattern recognition scheme, but also induces additional and often undesired lead time in the prosthesis design phase. In this study, a three-phase identification framework is formulated to design a control architecture capable of self-learning patterns from bio-signal inputs from electromyography (neuromuscular) and electroencephalography (brain wave) biosensors, for a transhumeral amputee case study. The results show that the designed self-learning framework can help reduce lead time in prosthesis control interface customisation, and can also be extended as an adaptive control scheme to minimise the performance degradation of the prosthesis controller.

1. Introduction

Bionic prosthesis arms, also known as a myoelectric prosthesis, are a kind of functional-based prosthesis arm which has been seen to be the closest alternative to a biological limb [1]. The myoelectric prosthesis works with a control system whose role is, given a physiological signal acquired by a biosensor, to decode a user motion intent, and from this, apply an actuation signal to make the myoelectric limb perform a selected gesture motion [1]. As per Fougner et al. [2], a number of control schemes have been trialled for the control of the myoelectric limb, and the pattern recognition scheme has been viewed as the favoured control method due to the level of intuitiveness which it affords its users. An artificial intelligence classifier is typically employed as part of this exercise and is usually calibrated using the favoured supervised learning framework, which is based on an iterative optimisation sequence where an algorithm learns the best internal model configuration that allows it to best identify labelled examples of the dataset for which it is being calibrated [3]. The shortcomings of the supervised learning framework include the lag-time induced by the reliance on an ‘expert in loop’ for tasks such as labelling of the training set, which requires more expert knowledge depending on the format and size of the training data, in addition to associated computational training times [3].
As part of efforts towards overcoming this limitation posed by the classifier learning framework, in this study, we propose an automated three-phase identification method which is used towards the design of a self-learning prosthesis controller. Another key issue faced by myoelectric prosthesis users is the classifier degradation, and thus, inaccurate gesture intent decoding due to a range of factors such as electrode shifts, changes in stump, sensor-skin impedance variation and sensor drifts [4]. This issue forms part of what has caused myoelectric prosthesis users to begin to abandon their prosthesis limbs as per reported surveys [4]. It is foreseen that the self-learning control framework, if applied at various intervals, can be used to recalibrate the prosthesis controller when necessary, and help form an adaptive prosthesis controller, thereby mitigating the classifier degradation problem. Thus, in this study, we investigate the design of a multi-stage self-learning prosthesis controller capable of functioning in an automated fashion and reducing downtime associated with the calibration of the controller while serving as an adaptive strategy to retune the classifier within the controller to minimise classifier degradation.

2. Materials and Methods

This paper utilises the dataset acquired by Li et al. [5] using electromyography (EMG) and electroencephalography (EEG) sensors. This section gives a brief overview of the bio-sensors used, and the data collection procedure, followed by the designed prosthesis controller framework [5].

2.1. Biosensors

2.1.1. Electromyography (EMG)

EMG signals are superimposed electrical signal representations of action potentials from motor neurons which are dependent on the physiological and anatomical properties of an individual [3,5]. Using dipole theory, an EMG signal can be mathematically modelled as a continuous extracellular action potential from a multiple-source dipole, as seen in equation 1 [6]:
ϕ e ( t ) = a 2 . σ i 4. σ e . + I A P ( x , t ) x . a x . x ( 1 r ( x ) ) d x
where ϕ e is the time-varying extracellular potential, σ e is the conductivity of the extracellular medium,   σ i is the intracellular conductivity, a is the radius of the fiber, t is time, r is the distance of the source excitation to the recording sensor, x is a point in space within the fibre element, a x is the length of the anatomical fiber and I A P x is the dipole strength at a point along the fiber axis.
-
EMG Sensors
The EMG instrumentation used for data acquisition by Li et al. [5] was the Refa 128 high-density electrodes by TMS International BV, Netherlands, with 32 electrode channels [3]. The acquisition electronics comprised a bandpass filter in the 10–500 Hz frequency range, 24-bit resolution and a sample rate of 1024 Hz [3].

2.1.2. Electroencephalography (EEG)

The passive variant of EEG which was used for data collection by Li et al. [5] is based on the recording of electrical signals emanating from the brain using surface electrodes, where the recorded EEG signals represent brain-based potential signals from various regions of activations [7]. On a closer scale, these EEG signals occur from the neuronal firing of billions of pyramid-like cells within the skull of a human being [7]. Using a combination of dipole theory, and assuming the forward EEG problem, a measured potential of an EEG signal can be formulated as follows [7]:
For a multilayer head model with concentric spheres L whose radius spans 0 < r1 < r2… < rL with anisotropic conductivities σ 1 , . σ L , the electric potential u measured at point x can be expressed as Equation (2) [7]:
u( r s ,q,x )= | | q | | 4π σ L r L 2 = n=1 2n+1 n ( r s r L ) n1 f n [ ncos P n ( cosγ )+cosβsin P n 1 ( cosγ ) ]
where s is the dipole source located within a proximity of sphere of radius rs of moment q; the boundary sphere is rL; σ L is the anisotropic conductivity within the boundary sub-domain of L; f n is the EEG measurement for the nth element in the infinite set; is the angle between the point S and measurement point x; γ is the angle between two planar vectors pairs of S and q, and S and x; and P n and P n 1 represent the Legendre polynomial coefficients of the series.
-
EEG Sensors
Li et al. [5] used the 64-sensor EEG channel EasyCap, Herrsching, Germany, with the Al-AgCl electrodes and Neuroscan system version 4.3. The EEG signals were band-passed using filters designed with the frequency range of 0.05–100 Hz and acquired at a sampling rate of 1024 Hz [5].

2.2. Data Collection and Demographic Information

The dataset acquired by Li et al. [5] involved a simultaneous acquisition of EMG and EEG from amputated subjects whom had lost their limb due to trauma. A single amputee’s data set has been used for the work presented as part of this paper. The transhumeral amputee subject was 49 years old with a left-side amputation, three years post-amputation due to trauma, and a stump length (measured from shoulder blade downwards) of 20 cm. Ethical approval was granted for the study by the Institutional Review Board of Shenzhen Institutes of Advanced Technology, with a unique reference number of SIAT-IRB-150515-H0077.
The Hand Open (HO), Hand Close (HC) gestures, which represent two of the key gesture sets relevant for a functional prosthesis, are the gestures used for part of the prosthesis control exercises presented in this work [5]. A total of 32 EMG electrode channels were distributed around the stump and deltoid of the subject, while the EEG cap comprising 64 electrodes was worn on his head. A sum of 10 repetitions was done for each gesture set with a break between acquisition runs to minimise the effect of fatigue on the data collection process; an image of the acquisition setup can be seen in Figure 1.

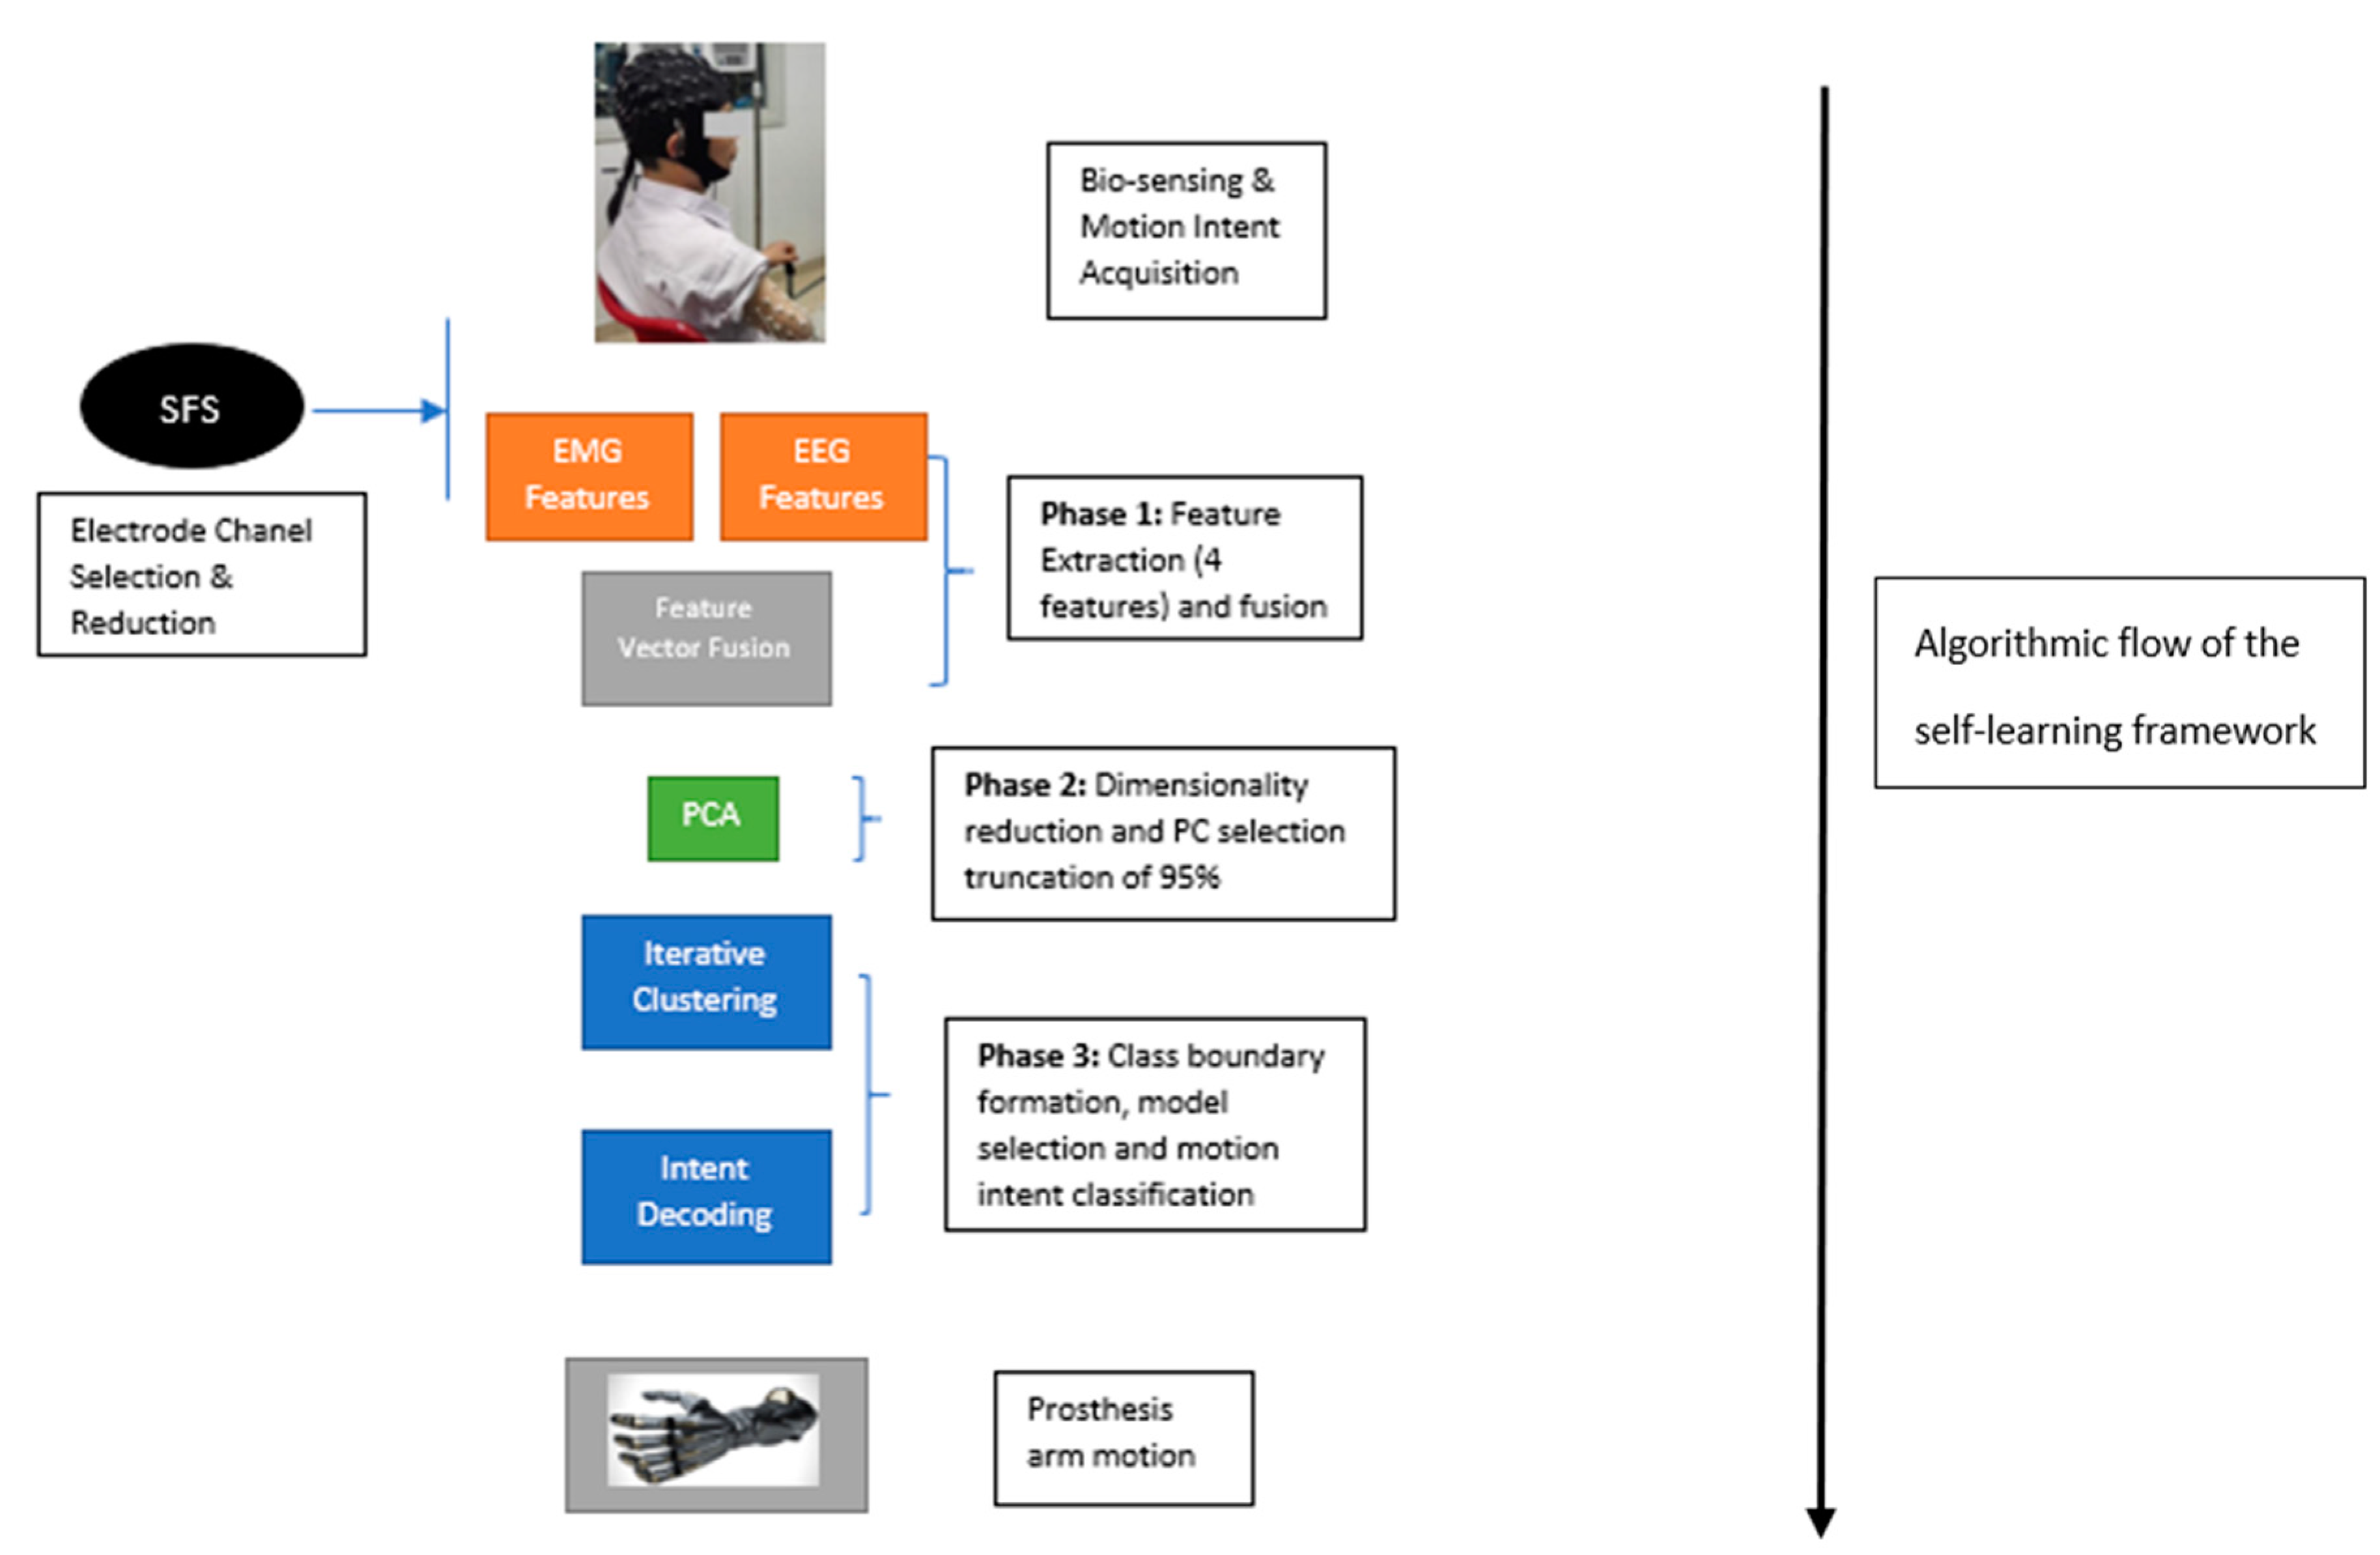
2.3. Self-Learning Controller Framework

This section describes the steps and architecture of the self-learning controller which, after the acquisition of a biosignal, includes separate electrode channel selection, and the automated learning consisting of Feature Extraction, Signal Fusion, Dimensionality Reduction, Labelling and Motion Intent Classification.
-
Electrode Channel Selection: The electrode channel selection was carried out separately as part of the framework being described in this paper. This aspect was done by Li et al. [5], and involved the use of the Sequential Forward Selection (SFS) algorithm which is a variant of a greedy search algorithm, as can be seen in Equation (3):
Acc ( S k + x * )   = argmax   Acc ( S k + x j * ) ,   k { 1 , 2 , . n }  
where Acc represents classification accuracy, S k is a selected electrode,   x j * is an electrode channel and jth element in the set k. Using this framework, the 10 electrodes from both the EMG and EEG biosensors were identified by Li et al. [5]. These electrodes formed the signal channels used for the signal processing stage and represent a first-stage dimensionality reduction process.

2.3.1. Feature Extraction and Feature Vector Fusion

A total of four time-domain features were extracted from the signals of both the EMG and EEG as proposed by Li et al., as described in Equations (4)–(7) [3,5]:
Mean   absolute   value   ( MAV ) = 1 N n = 1 N | x n |
where N = number of samples and x n is the nth sample of the EMG signal.
Waveform   Length   ( WL ) = n = 2 N | x n x n 1 |
Zero   Crossing   ( ZC ) = n = 1 N s g n ( x i x i + 1 ) S g n ( x ) = { 1 ,   x > 0 0 ,   o t h e r w i s e
Number   of   slope   sign   changes   ( SSC ) = n = 2 N f [ [ ( x n x n 1 ) . ( x n x n + 1 ) ] ] S g n ( x ) = { 1 ,   x > 0 0 ,   o t h e r w i s e
A threshold of 0.1 mV was used for the calculations of the ZC and SSC features, and following the extraction of the features, respective feature vectors were formed for both the EMG and EEG, and then fused together to construct an EMG-EEG feature vector. The 10 repetitions from 10 SFS electrodes for the two gestures performed, followed by the four features extracted, amounted to a total of 800 data points used for the classification process in the case of the EMG/EEG only, and 1600 for the fused EMG-EEG biosensing modules.

2.3.2. Dimensionality Reduction

Dimensionality reduction is a useful approach that involves the reduction of the size of the feature vector, which in turn, helps minimise the computation time and remove noise and redundancies from the dataset [8]. Principal component analysis (PCA) is a linear dimensionality reduction technique used to reduce the dimension of data while preserving its structure and minimising loss of information, predominantly by creating new variables that maximise variance [8]. This approach obtains a number of principal components (PCs) by solving an eigenvector and eigenvalue problem without the requirement of prior information or class labels, thus making it an unsupervised data analysis method [9].
Using the computationally efficient covariance method, the PCA can be calculated as follows, assuming a data vector X   = x 1 , x 2 .. x N :
-
Mean centring of the data to produce a standardised vector B
-
Calculation of the covariance matrix C = 1 n 1 B B
where C is the covariance matrix, * is the conjugate transpose operator, and n 1 is used in this case due to Bessel’s correction factor used to negate the effect of bias on sample variance.
-
Calculation of the eigenvalues and eigenvectors of the covariance matrix which produces a diagonal of the covariance matrix C , which can be formulated as V 1 C V = D , where D represents the eigenvalues of the covariance matrix and V is the matrix of the right-side eigenvalues.
-
Arrange eigenvalues and eigenvectors in descending order and calculate the energy E j = k = 1 N D k k for all columns in the feature vector.
-
Truncate the eigenvectors whilst ensuring that 90% of the cumulative energy is preserved, and project the feature vector in a new basis G = B W , where the columns in G represent PC’s 1 ,   2 , . n .
In this work, the first two PC’s were selected as they accounted for 95% of the information in the data, thus allowing a dimensionality reduction from 4 × 200 to 2 × 200 for the EMG-Only and EEG-Only, while most notably dropping the dimension from 8 × 200 to 2 × 200 for the case of the signal fusion of EMG-EEG.

2.3.3. Iterative Clustering and Motion Intent Classification

The final stage involves the labelling and forming of clusters as a means of distinguishing between various phantom motion intent signals used to actuate respective hand gestures in the prosthesis limb. For this section, two unsupervised classification methods were used as follows:
-
K-means: Is a form of iterative clustering algorithm where the data are segmented into K different classes using a centroid mean and Euclidean distance metric. During iterations, the algorithm aims to maximise the distance between classes, and sorts data points into their respective classes by their proximity to assigned clusters within Euclidean space [10]. This approach uses the expectation-maximisation (E-M) framework assuming a random initialisation: The E step involves the assignments of clusters using i = 1 m k = 1 K a r g m i n j | | x i μ k | | 2 , where x i is a data point and μ k is the centroid mean; while the M step involves the recalculation of the class centroid using the expression μ k = i = 1 m w i k x i i = 1 m w i k , where w i k is a binary metric used to indicate whether or not a data point belongs in a certain class [10]. Due to the random cluster centroid initialisation, running the K-means algorithm at different times could yield different results; thus, a model selection phase has been included where the model selected was that which produced the lowest error for the performance index J defined in equation 8 after five separate runs of the algorithm. The number of clusters was defined a priori from the number of gesture motions performed.
J = | ( N u m b e r   o f   m o t i o n   r e p e t i t i o n s   p e r f o r m e d * N u m b e r   o f   e l e c t r o d e   c h a n n e l s ) i = 1 m x k i |
where x k i is a data point assigned to a specific class k
-
Gaussian mixture model (GMM): Working with a Gaussian assumption, the GMM is a probabilistic framework which is an extension of the K-means algorithm, with the GMM providing flexibility between a hard clustering option which sorts the data into a solitary class, while the soft clustering allows for data to belong to more than one class [11]. The GMM model can be described and parametrised as containing a mixture proportion, mean and covariance. A multidimensional model of the GMM framework can be seen in Equations (9) and (10):
p ( x ) = i = 1 K π i N ( x | µ i ,   i )
N ( x | µ i ,   i ) = 1 ( 2 π ) K |   i | exp ( 1 2 ( x µ i ) T   i 1 ( x µ i ) )  
i = 1 K π i = 1    
where x is a datapoint,   µ i is the mean,   i is the covariance, N symbolises a Gaussian distribution, k is the number of mixture components, and π i are the various component weights with a normalisation constraint as shown in equation 11 to ensure the total probability sums up to 1. The learning model for the GMM is also based on the E-M framework where the model parameters are estimated iteratively with the maximum likelihood estimation approach [11]. The hard clustering option was utilised in this work and, as with the K-means algorithm, the number of clusters and mixture components were defined a priori, and included a model selection phase as mentioned with the performance index defined in equation 8 used for the selection process. The algorithm was run with a full covariance option and converged within 15 iterations on average.
A diagrammatic flow of the self-learning control framework can be seen in Figure 2.

3. Results

3.1. Intent Decoding

As a way of testing the intent decoding capability of models, a separate unseen dataset of the feature vector after the PCA transformation was put aside, used to test the models and referred to as the Hold-Out dataset. The results of the various cluster assignment runs from the Hold-Out can be seen in Table 1, where the accuracy has been computed as the Classification Accuracy =   N u m b e r   o f   c o r r e c t l y   c l u s t e r e d   s a m p l e s   T o t a l   n u m b e r   o f   s a m p l e s expressed as a percentage.
From the results in Table 1, it can be seen that the designed self-learning framework is capable of automatedly learning the patterns in the data, and thus, the necessary intent decoding task was achieved with high accuracy. From the results, it can be seen that the best accuracy for the Hold-Out testing was jointly between the EMG-Only and EMG-EEG. For the case of the EEG, there was a reduction in the test accuracy by a factor of 10% for the GMM and 20% for the K-means. This is thought to be due to EEG being a biosensor which requires a high number of electrode channels when compared with EMG, and due to this, provided a slightly lower test accuracy. In the case of the signal fusion of EMG-EEG, the test accuracy provided an identical result for both classifiers, as was seen in the EMG only, although it is expected that the fused biosignals would be more robust to uncertainties that could cause misclassification of motion intent signals. Observing the results from both classifiers, it can be seen that GMM outperforms the K-means for every configuration of the bio-signal input. The reason for this is thought to be due to the K-means clustering assumption that the data are spherical, whereas these kinds of bio-signals have been seen to be nonlinear and favour nonlinear class separation. The GMM also takes into account sample covariance as part of the clustering process, as can be seen in equation 10, thereby allowing for a more informed formation of clusters – with the trade-off for this being additional computational requirements relative to K-means, which works purely with Euclidean distance.

Extension towards an Adaptive Control Framework

Due to factors mentioned in Section 1, external factors could make redundant trained class boundaries, and as a result, cause classifier degradation; this warrants the need for classifier relearning to adapt to the dynamic changes which may be causing performance degradation [4]. Researchers in this area, such as Samuel et al., Chen et al., and Asogbon et al. [12,13,14], have proposed extensions to various classifier architectures to allow online adaptation of classifier decision boundaries, as necessary [4]. Here, we propose an extension of the presented self-learning control framework as a means of an adaptive framework for cluster decision cluster reformation with real-time data from current anatomical and acquisition electronic states. As a means of controller adaptation, the self-learning process can be prompted either as an interval-based adaptive solution defined by a user-defined timeframe where the self-learning process is initiated to adapt the control architecture, or after a sequence of misclassifications occurs. Further research is required to investigate and formalise this notion.

4. Conclusions

In this paper, a self-learning controller framework capable of learning patterns from input data in an automated fashion and decoding phantom motion intents has been proposed. The framework comprises a pre-processing stage involving the SFS followed by a three-phase self-learning which includes feature extraction, dimensionality reduction and iterative clustering. The benefits of this can reduce the lag-time associated with the favoured supervised learning method used in current myoelectric prosthesis control architectures, and add a further layer of autonomy to the prosthesis limb. This framework can also be expanded to help mitigate classifier degradation by being a user-prompted relearning framework capable of relearning the class boundary variations in the data resulting from physiological changes and drifts in the acquisition electronics in the prosthesis arm. Subsequent work is now required to validate this approach on a broader number of transhumeral amputees, followed by an optimisation exercise to observe how many unique motion intents can form part of the framework while maintaining an acceptable intent decoding accuracy.

Author Contributions

E.N. and O.W.S. carried out the conceptualization, data analysis and crafting of the manuscript. M.G.A. provided feedback on the manuscript while G.L. acquired the funding. All authors have read and agreed to the published version of the manuscript.

Acknowledgments

The research work was supported in part by the National Natural Science Foundation of China under Grants (#U1613222, #81850410557), the Shenzhen Science and Technology Program (#SGLH20180625142402055), and CAS President’s International Fellowship Initiative Grant (#2019PB0036). Mojisola G. Asogbon Samuel sincerely appreciates the support of the Chinese Government Scholarship in the pursuit of a PhD degree at the University of Chinese Academy of Sciences, Beijing. We would like to thank Brian Kerr from Kerr Editing for proofreading the manuscript and Li Xiangxin for the assistance in the data acquisition process.

Conflicts of Interest

The authors declare no conflict of interest.

References

  1. Fumero, R.; Costantino, M.L. Organi artificiali. In Storia della Bioingegneria; Patron: Bologna, Italy, 2001; pp. 341–365. [Google Scholar]
  2. Fougner, A.; Stavdahl, O.; Kyberd, P.J.; Losier, Y.G.; Parker, P.A. Control of upper limb prostheses: Terminology and proportional myoelectric control—A review. IEEE Trans. Neural Syst. Rehabil. Eng. 2012, 20, 663–677. [Google Scholar] [CrossRef] [PubMed]
  3. Nsugbe, E.; Phillips, C.; Fraser, M.; McIntosh, J. Gesture Recognition for Trans-humeral Prosthesis Control Using EMG and NIR. IET Cyber-Syst. Robot. 2020, 2, 122–131. [Google Scholar] [CrossRef]
  4. Huang, Q.; Yang, D.; Jiang, L.; Zhang, H.; Liu, H.; Kotani, K. A Novel Unsupervised Adaptive Learning Method for Long-Term Electromyography (EMG) Pattern Recognition. Sensors (Basel) 2017, 17, 1370. [Google Scholar] [CrossRef] [PubMed]
  5. Li, X.; Samuel, O.W.; Zhang, X.; Wang, H.; Fang, P.; Li, G. A motion-classification strategy based on sEMG-EEG signal combination for upper-limb amputees. J. NeuroEng. Rehabil. 2017, 14, 2. [Google Scholar] [CrossRef] [PubMed]
  6. Rodriguez-Falces, J.; Navallas, J.; Malanda, A. EMG Modeling. In Computational Intelligence in Electromyography Analysis-A Perspective on Current Applications and Future Challenges; Naik, G.R., Ed.; InTech: London, UK, 2012. [Google Scholar] [CrossRef]
  7. Darbas, M.; Lohrengel, S. Review on Mathematical Modelling of Electroencephalography (EEG). Jahresber. Dtsch. Math. Ver. 2019, 121, 3–39. [Google Scholar] [CrossRef]
  8. Towards Data Science. Available online: https://towardsdatascience.com/dimensionality-reduction-for-machine-learning-80a46c2ebb7e (accessed on 12 September 2020).
  9. Jolliffe, I.T.; Cadima, J. Principal component analysis: A review and recent developments. Philos. T. R. Soc. A 2016, 374. [Google Scholar] [CrossRef] [PubMed]
  10. Towards Data Science. Available online: https://towardsdatascience.com/k-means-clustering-algorithm-applications-evaluation-methods-and-drawbacks-aa03e644b48a (accessed on 12 September 2020).
  11. Towards Data Science. Available online: https://towardsdatascience.com/gaussian-mixture-models-explained-6986aaf5a95 (accessed on 12 September 2020).
  12. Samuel, O.W.; Zhou, H.; Li, X.; Wang, H.; Zhang, H.; Sangaiah, A.K.; Li, G. Pattern recognition of electromyography signals based on novel time domain features for amputees’ limb motion classification. Comput. Electr. Eng. 2018, 67, 646–655. [Google Scholar] [CrossRef]
  13. Chen, X.; Zhang, D.; Zhu, X. Application of a self-enhancing classification method to electromyography pattern recognition for multifunctional prosthesis control. J. Neuroeng. Rehabil. 2013, 10, 1–13. [Google Scholar] [CrossRef] [PubMed]
  14. Asogbon, M.G.; Samuel, O.W.; Geng, Y.; Oluwagbemi, O.; Ning, J.; Chen, S.; Ganesh, N.; Feng, P.; Li, G. Towards resolving the co-existing impacts of multiple dynamic factors on the performance of EMG-pattern recognition based prostheses. Comp. Meth. Prog. Biol. 2020, 184, 105278. [Google Scholar] [CrossRef] [PubMed]
Figure 1. A picture showing the subject during the data collection session [5].
Engproc 02 00059 g001
Figure 2. A flow diagram showing the various aspects of the 3-phase self-learning prosthesis control procedure, and mapping-out procedure of going from motion intent (raw bio-signal) to decision (arm motion) [5].
Engproc 02 00059 g002
Table 1. Results of the cluster assignment exercises and model accuracy validation using a Hold-Out test set (where highlighted figures represent the selected models on which the Hold-Out test was validated).
GMM-EMG OnlyK-Means-EMG OnlyGMM-EEG OnlyK-Means-EEG OnlyGMM-EMG-EEGK-Means- EMG-EEG
Cluster Model 1 Accuracy83%81%64%63%68%83%
Cluster Model 2 Accuracy99%81%64%58%98%83%
Cluster Model 3 Accuracy99%81%64%58%98%83%
Cluster Model 4 Accuracy99%81%64%58%98%83%
Clustering Model 5 Accuracy99%81%64%58%70%83%
Hold-Out Test Accuracy100%80%90%60%100%80%
Publisher’s Note: MDPI stays neutral with regard to jurisdictional claims in published maps and institutional affiliations.

