1. Introduction
In applications where crucial system components are frequently or constantly in contact with corrosive substances, such as in the oil and gas industry, usage of engineering plastics and composite materials has grown exponentially, due to the low weight-to-strength ratio and high corrosion resistance inherent to these materials. Metallic pipelines, for example, are being replaced by adhesive-bonded fiber-reinforced plastic (FRP) pipelines, generating a demand for FRPs inspection techniques. Several NDT techniques have been adapted or developed to meet this demand, including thermography, ultrasonography, radiography, holography, and computed tomography [
1]. In previous publications, we explored the use of a robust speckle pattern shearing interferometry technique, shearography, with success for assessing the health of bonded joints in FRP pipelines [
2,
3,
4]. The downside of these techniques is that access to the inspection site and components to be inspected is often difficult, as is for pipelines that are buried or installed in confined spaces on oil platforms. Furthermore, specialized equipment and trained personnel need to be flown to offshore platforms, which can incur in non-trivial inspection costs and reduce monitoring uptime.
Fiber-optic sensors, and in particular fiber Bragg gratings (FBGs), are increasingly popular for structural health monitoring applications due to advantageous characteristics that are inherent to fiber sensors, such as reduced size (typical fiber diameter of 125 µm), immunity to electromagnetic interference, and high multiplexing capability [
5]. While embedding sensors in plastics and composite materials has been a highly active field of study in recent years, the use of these techniques applied to tubular bonded joints is a very recent topic and remains a significant technical challenge. [
6,
7,
8].
In this work, we explore the use of FBGs embedded into the adhesive layer of tubular adhesive-bonded joints for long-term structural health monitoring and defect detection throughout the entire lifecycle of the pipeline. This was achieved by embedding several sensing fibers in bonded joints between industrial chlorinated polyvinylchloride (CPVC) pipes to measure axial strain inside the adhesive and looking for anomalies in the strain fields that indicate the presence of defects.
2. Materials and Methods
2.1. Instrumentation Setup
The standard FBG sensor consists of a short section of optical fiber with a periodically modulated refractive index. When broadband light is launched into the fiber, the FBG structure couples the forward-propagating light to a backwards core mode, creating a narrowband reflection response. The peak wavelength of the reflected signal,
(Bragg wavelength) is sensitive to mechanical strain and temperature experienced by the fiber, as shown in Equation (1), where
is the mechanical strain along the axis of the fiber,
is the temperature, and
and
are the strain and temperature sensitivity, respectively (typically
= 0.769 and
= 7.64 × 10
−6 K
−1). Thus, the FBG can be used as a strain sensor by monitoring the shift of
in response to mechanical loads [
6,
7].
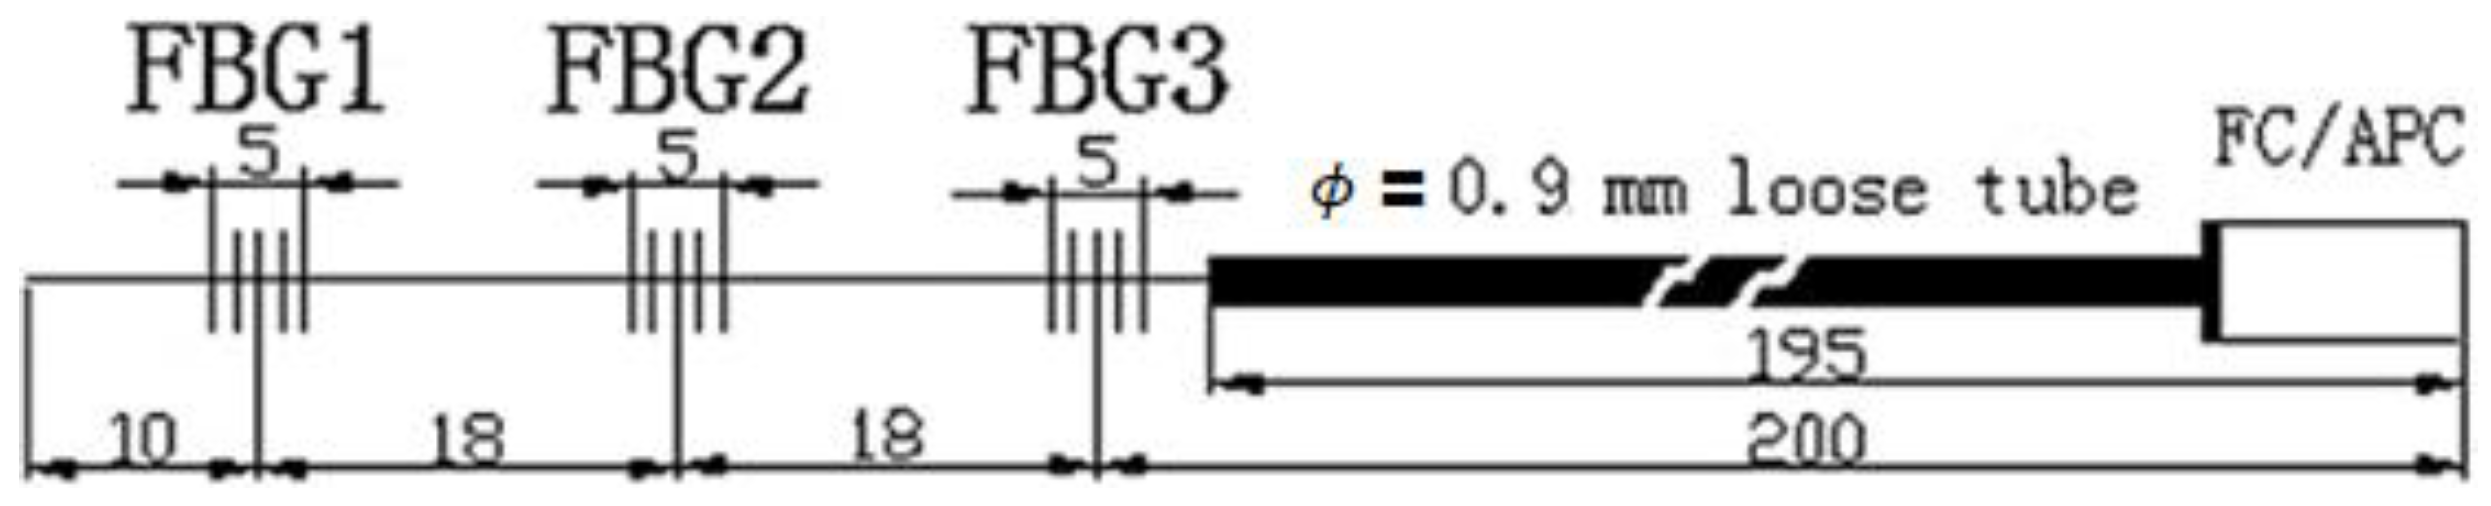
In this work, we have employed sensing fibers with 3 FBG strain sensors along their length. Precautions in the form of a polyimide protective coating and a 0.9 mm diameter Teflon loose tube were used to prevent fiber breakage during handling, embedding, and testing. A schematic drawing of the used sensing fibers can be seen in
Figure 1.
Distinct nominals were used for each FBG, along with sufficient spectral spacing (≥5 nm) to easily distinguish between sensors and avoid signal overlapping from an uneven loading. Furthermore, each embedded fiber has a unique combination of nominal wavelengths, so each sensing location along the perimeter of a bonded joint is uniquely and readily identifiable.
2.2. Assembly of Test Specimens
The test specimens were assembled with a 4” (100 mm) nominal diameter schedule 80 CPVC pipe and fittings. One end of the specimen is sealed with an endcap, while the opposing end is fitted with a heavy-duty CPVC flange and sealed with a 1040 steel blind flange with a central 1/4” NPT thread. Both the endcap and CPVC flange were solvent-welded to straight pipe sections, which were then adhesive-bonded to a sleeve using bi-component methyl-methacrylate adhesive.
To accommodate the sensing fibers and allow for bonding the straight pipe sections to the sleeve, the length of pipe to be inserted into the sleeve (~58 mm) was machined to reduce its diameter by 3 mm.
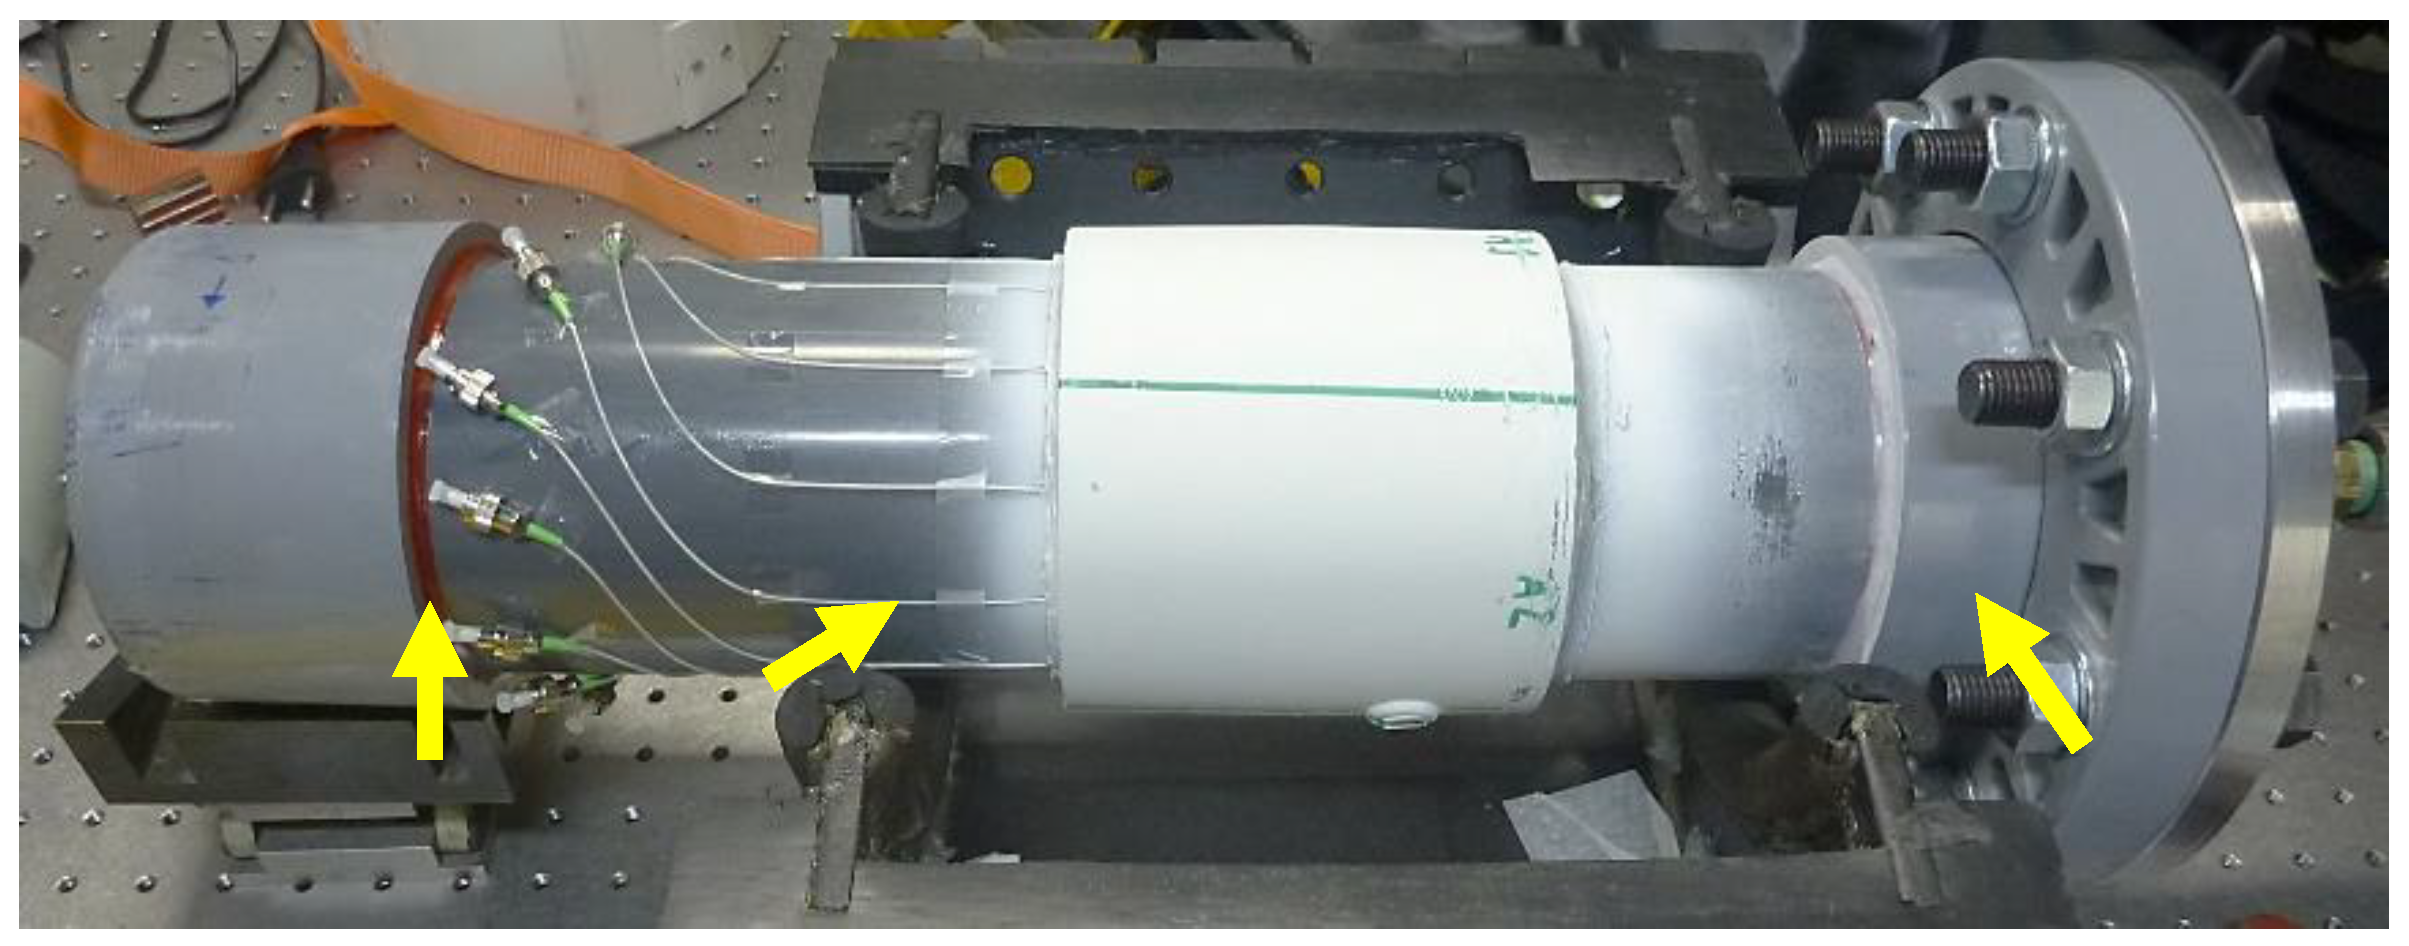
Figure 2 is a picture of a fully assembled test specimen with embedded sensors. Note that in this configuration, FBG1 (
Figure 1) will be positioned the deepest into the sleeve, while FBG3 will be positioned closer to the outer edge of the sleeve (where the fiber exits the adhesive layer), with FBG 2 in between.
Breakage of the sensing fibers while assembling the bonded joints was avoided by first pre-positioning the fiber with adhesive tape (applied to the loose tube), securing the tip of the fiber to the wall of pipe with a droplet of cyanoacrylate adhesive, and then applying a uniform layer of the methyl-methacrylate bi-component adhesive directly along the length of the fiber before applying it to the machined pipe section and inner wall of the sleeve. Finally, the instrumented pipe section and sleeve were carefully brought together, avoiding rotation along their long axis as to not misalign the fibers. Three test specimens, that will be referred as S1, S2, and S3, were assembled. Specimens S2 and S3 are instrumented with 12 sensing fibers in the adhesive layer (~43.6 mm of circumferential separation between fibers) aligned with the pipe’s long axis, providing 36 strain sensing points, whereas S1 has 11 fibers (~47.6 mm circumferential spacing) due to a defective fiber.
3. Results and Discussion
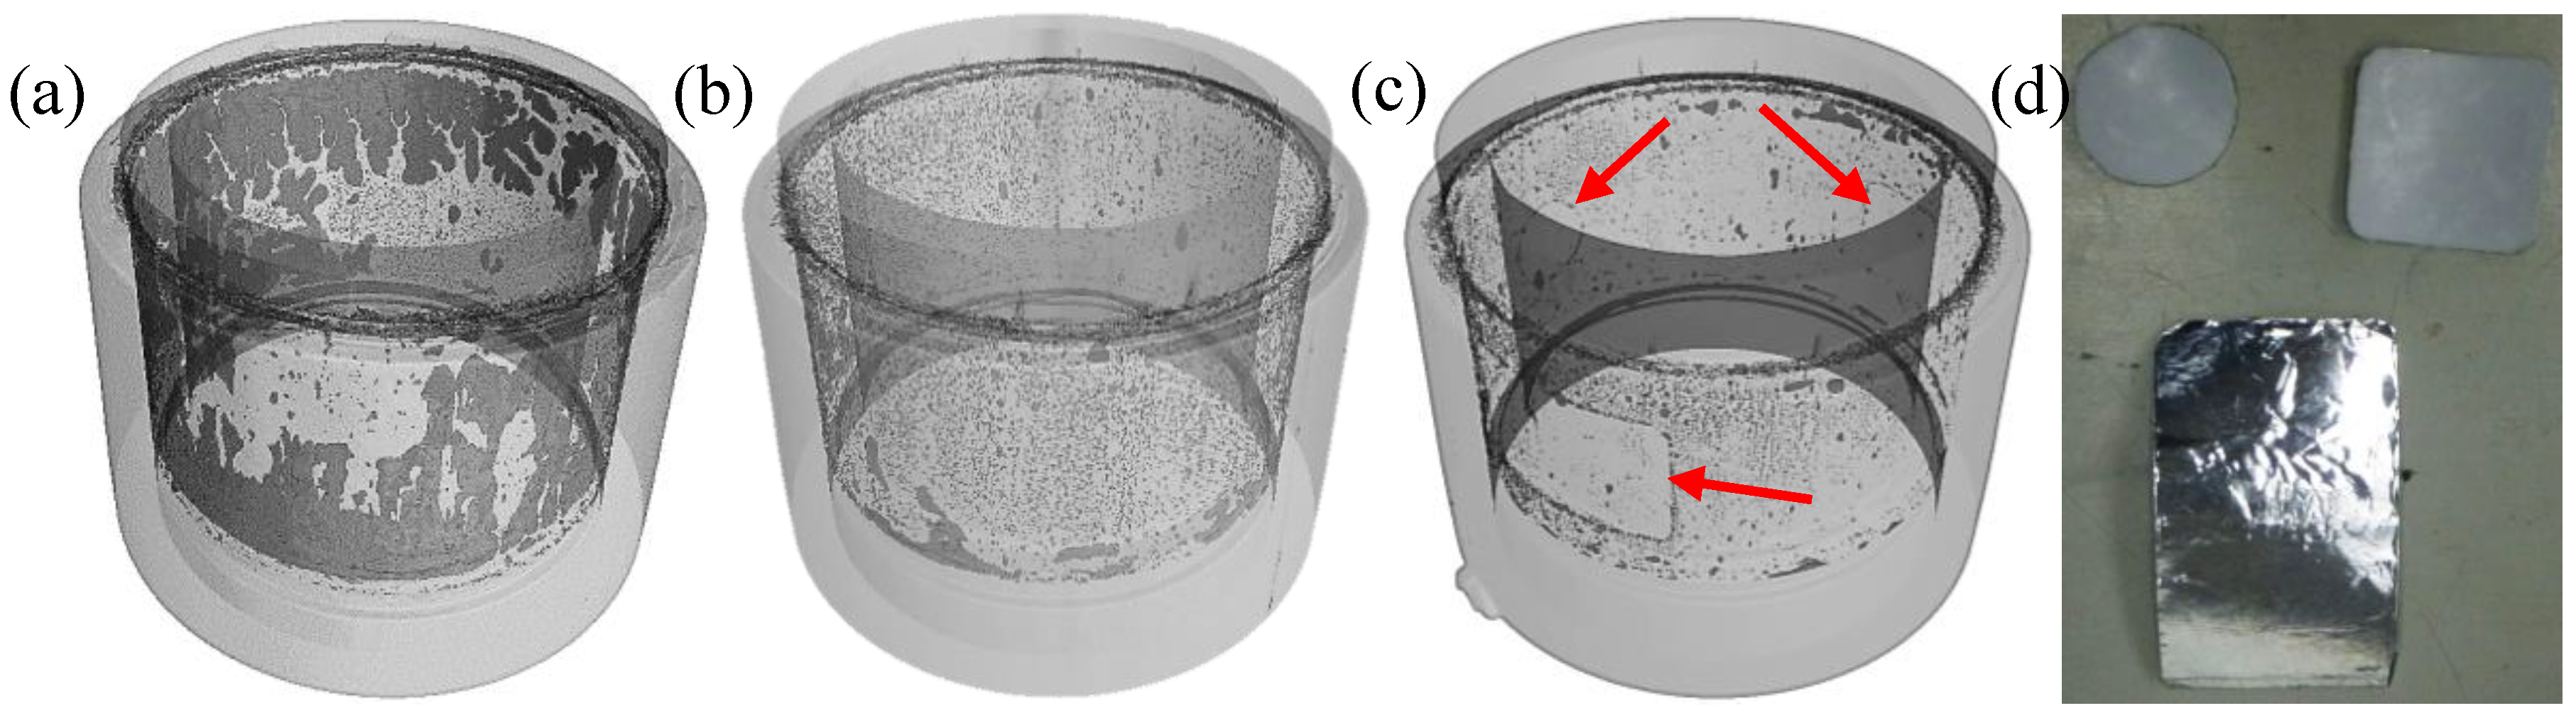
Specimen S1 was assembled with a significant lack of adhesive to create numerous large voids, while S2 was prepared to be as structurally sound as possible. S3 contains planned defects created by embedding pieces of Teflon sheet with aluminum tape (to increase detectability by tomography). The instrumented joints were then submitted to a computed tomography scan for control purposes, and the results are depicted in
Figure 3 along with a picture of the Teflon pieces embedded into S3.
From
Figure 3a, an extensive lack of adhesive defects (darker areas) can be seen in S1, some porosity without major voids in S2 (
Figure 3b), and some porosity along the planned defects (indicated by the red arrows) in S3 (
Figure 3c). The embedded defects shown in
Figure 3d have the approximate dimensions of a 20 mm diameter for the circle, 20 mm sides for the square, and 20 by 70 mm for the rectangular Teflon sheet. For a more complete evaluation of the instrumentation setup defect detection capacity, the circle and large rectangle were positioned on top of FBG sensors, while the square was placed in the spacing between fibers. Three experiments were conducted with the embedded FBG sensors to assess their suitability for monitoring the health of the bonded joints during all stages of the pipeline lifecycle: (a) adhesive curing strain test (joint assembly), (b) flexural strain detection test (pipeline assembly), and (c) hydrostatic test (operation).
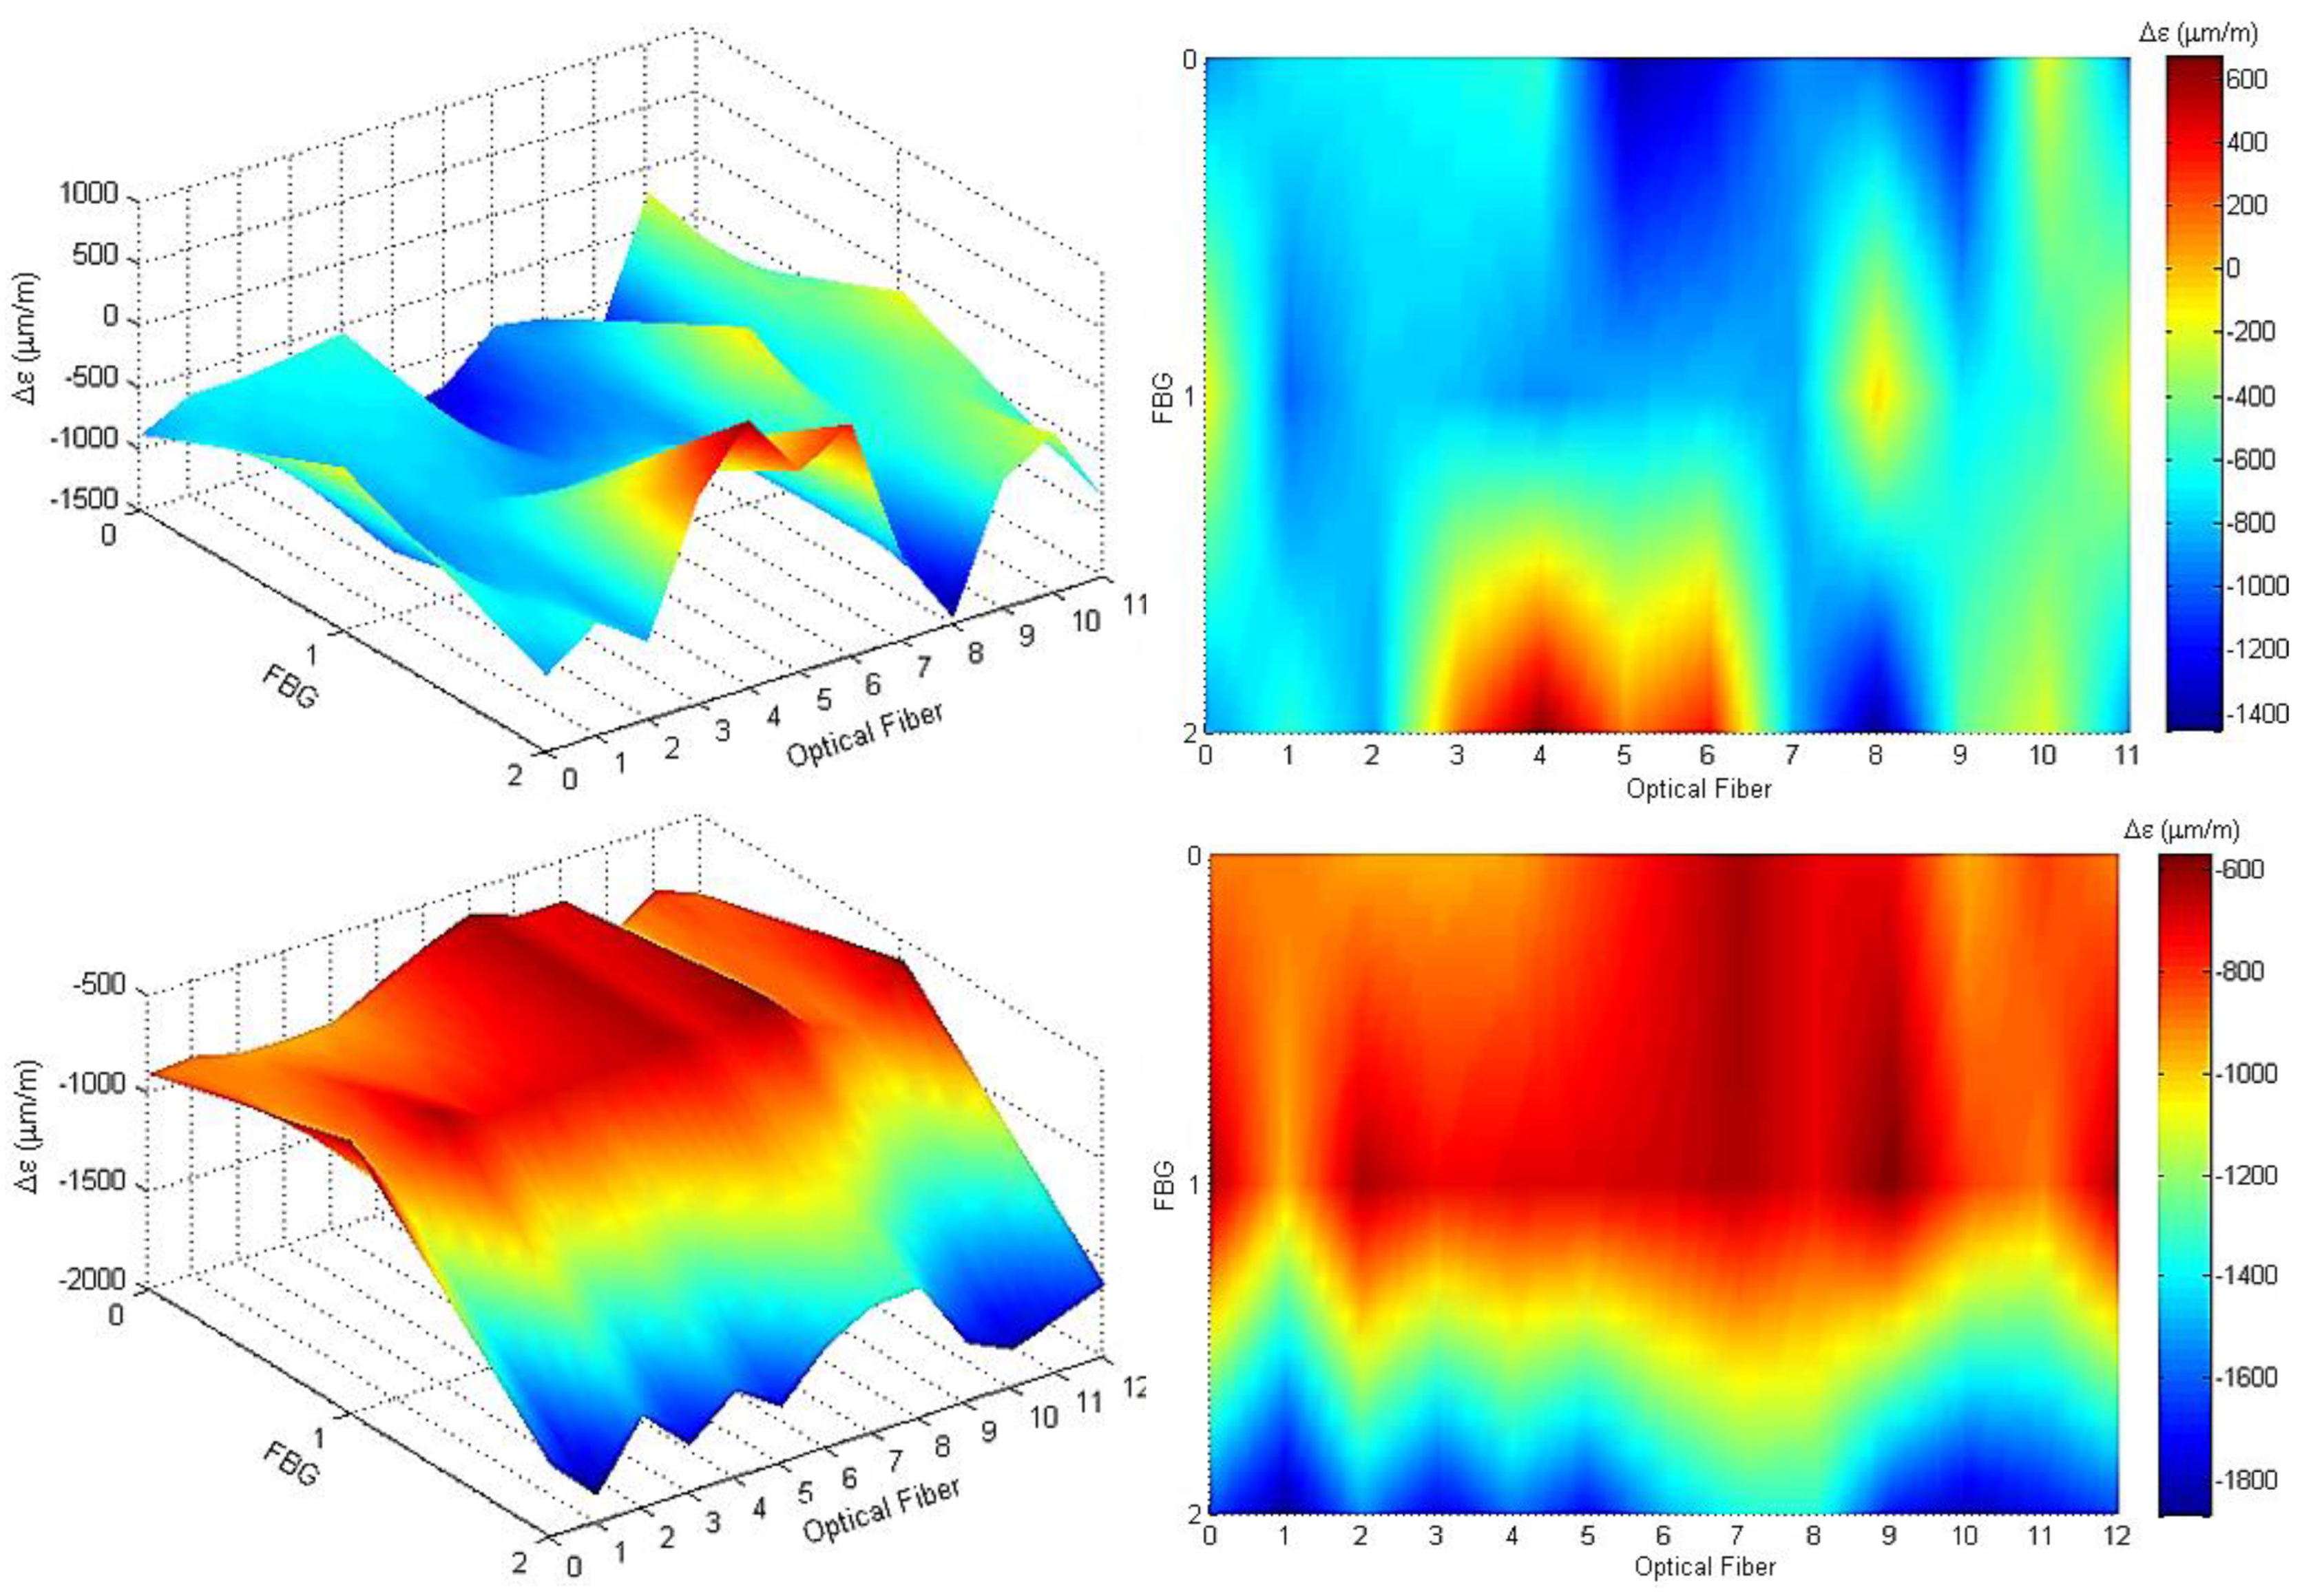
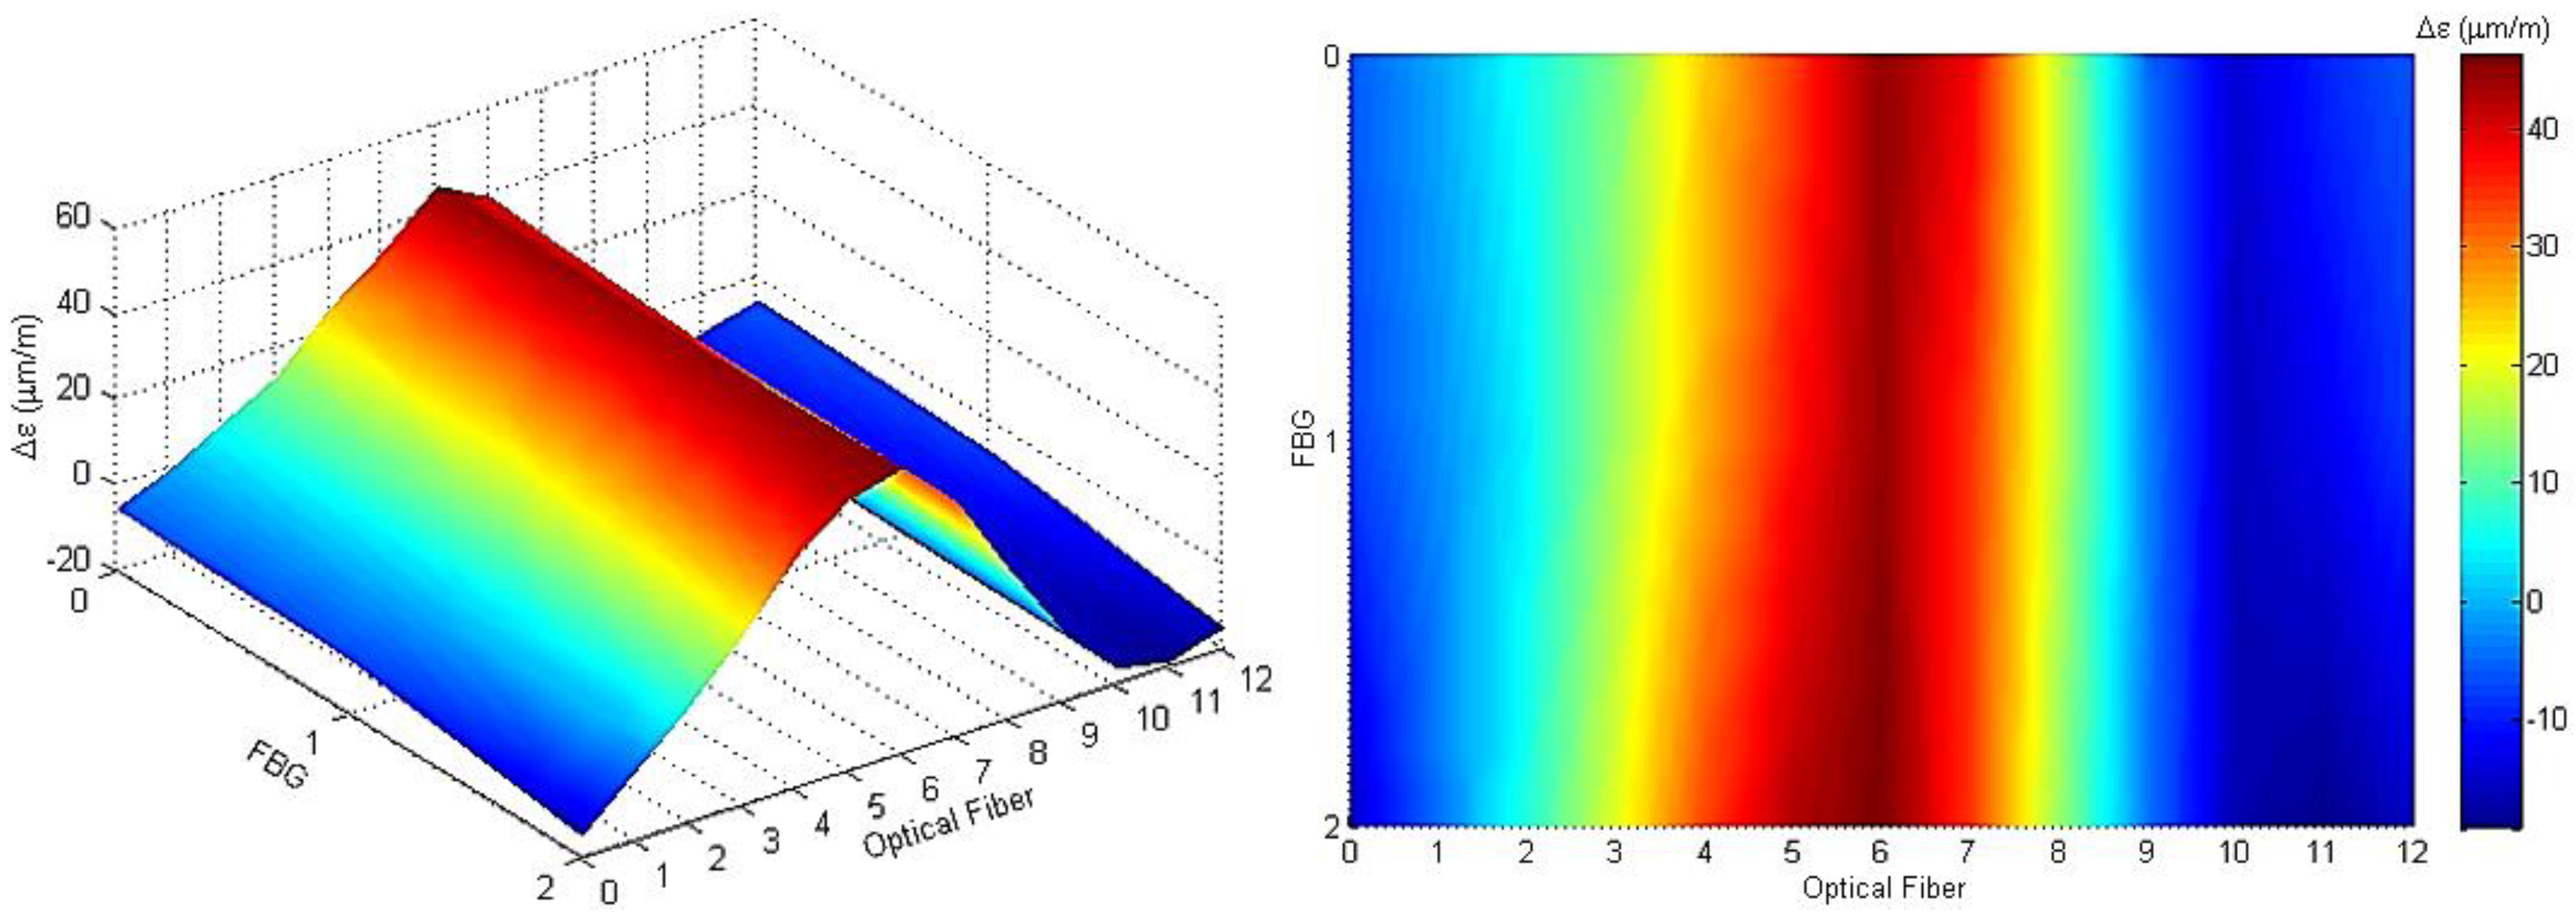
The adhesive curing strain test was realized by interrogating (sm125 Optical Sensing Interrogator, 1 pm resolution—Micron Optics) all FBGs before and after assembling the bonded joints and computing the strain difference (
) between datasets.
Figure 4 contains the
maps (surface and color maps with bilinear interpolation; note that in the graphics, the axis start at zero and as such FBG 0 in the graph = FBG1 in
Figure 1 and so on) of the adhesive cure strain for S1 and S2. In a structurally sound joint, the strain map is expected to be entirely negative (compressive strain) as the adhesive shrinks when cured [
9]. This is visible in the
maps for S2, along with great circumferential symmetry (optical fiber axis) and a higher strain magnitude towards the outer edge of the sleeve. On the other hand, S1 exhibits significant strain fluctuations due to the severe lack of adhesive, no circumferential symmetry, and FBGs under tensile strain. Therefore, it is evident that the embedded sensors can differentiate between a sound joint and one with a moderate to severe lack of adhesive.
When assembling pipelines, forcefully compensating for misalignments between pipe sections to be joined can introduce axial and flexural loads, leading to premature failures due to increased strain levels. As indicated by the yellow arrows in
Figure 2, when ready for hydrostatic testing, the test specimens are supported at three points: the endcap and two points near the sleeve. The two-point support at both sides of the sleeve results in a slight flexural load with a maximum at the midpoint of the sleeve. In this configuration, by comparing strain maps obtained before and after rotating the test specimen along the long axis, the load redistribution among the sensing fiber simulates the effect of introducing a slight flexural load. The strain difference (
) map for a “virtual” load, obtained by rotating S2 by 90°, is shown in
Figure 5. As can be seen, the strain distribution is consistent with uniaxial flexural loading, and the FBGs are also shown to be very sensitive, being able to detect very slight flexural loads, undoubtedly adequate for monitoring the pipeline assembly process.
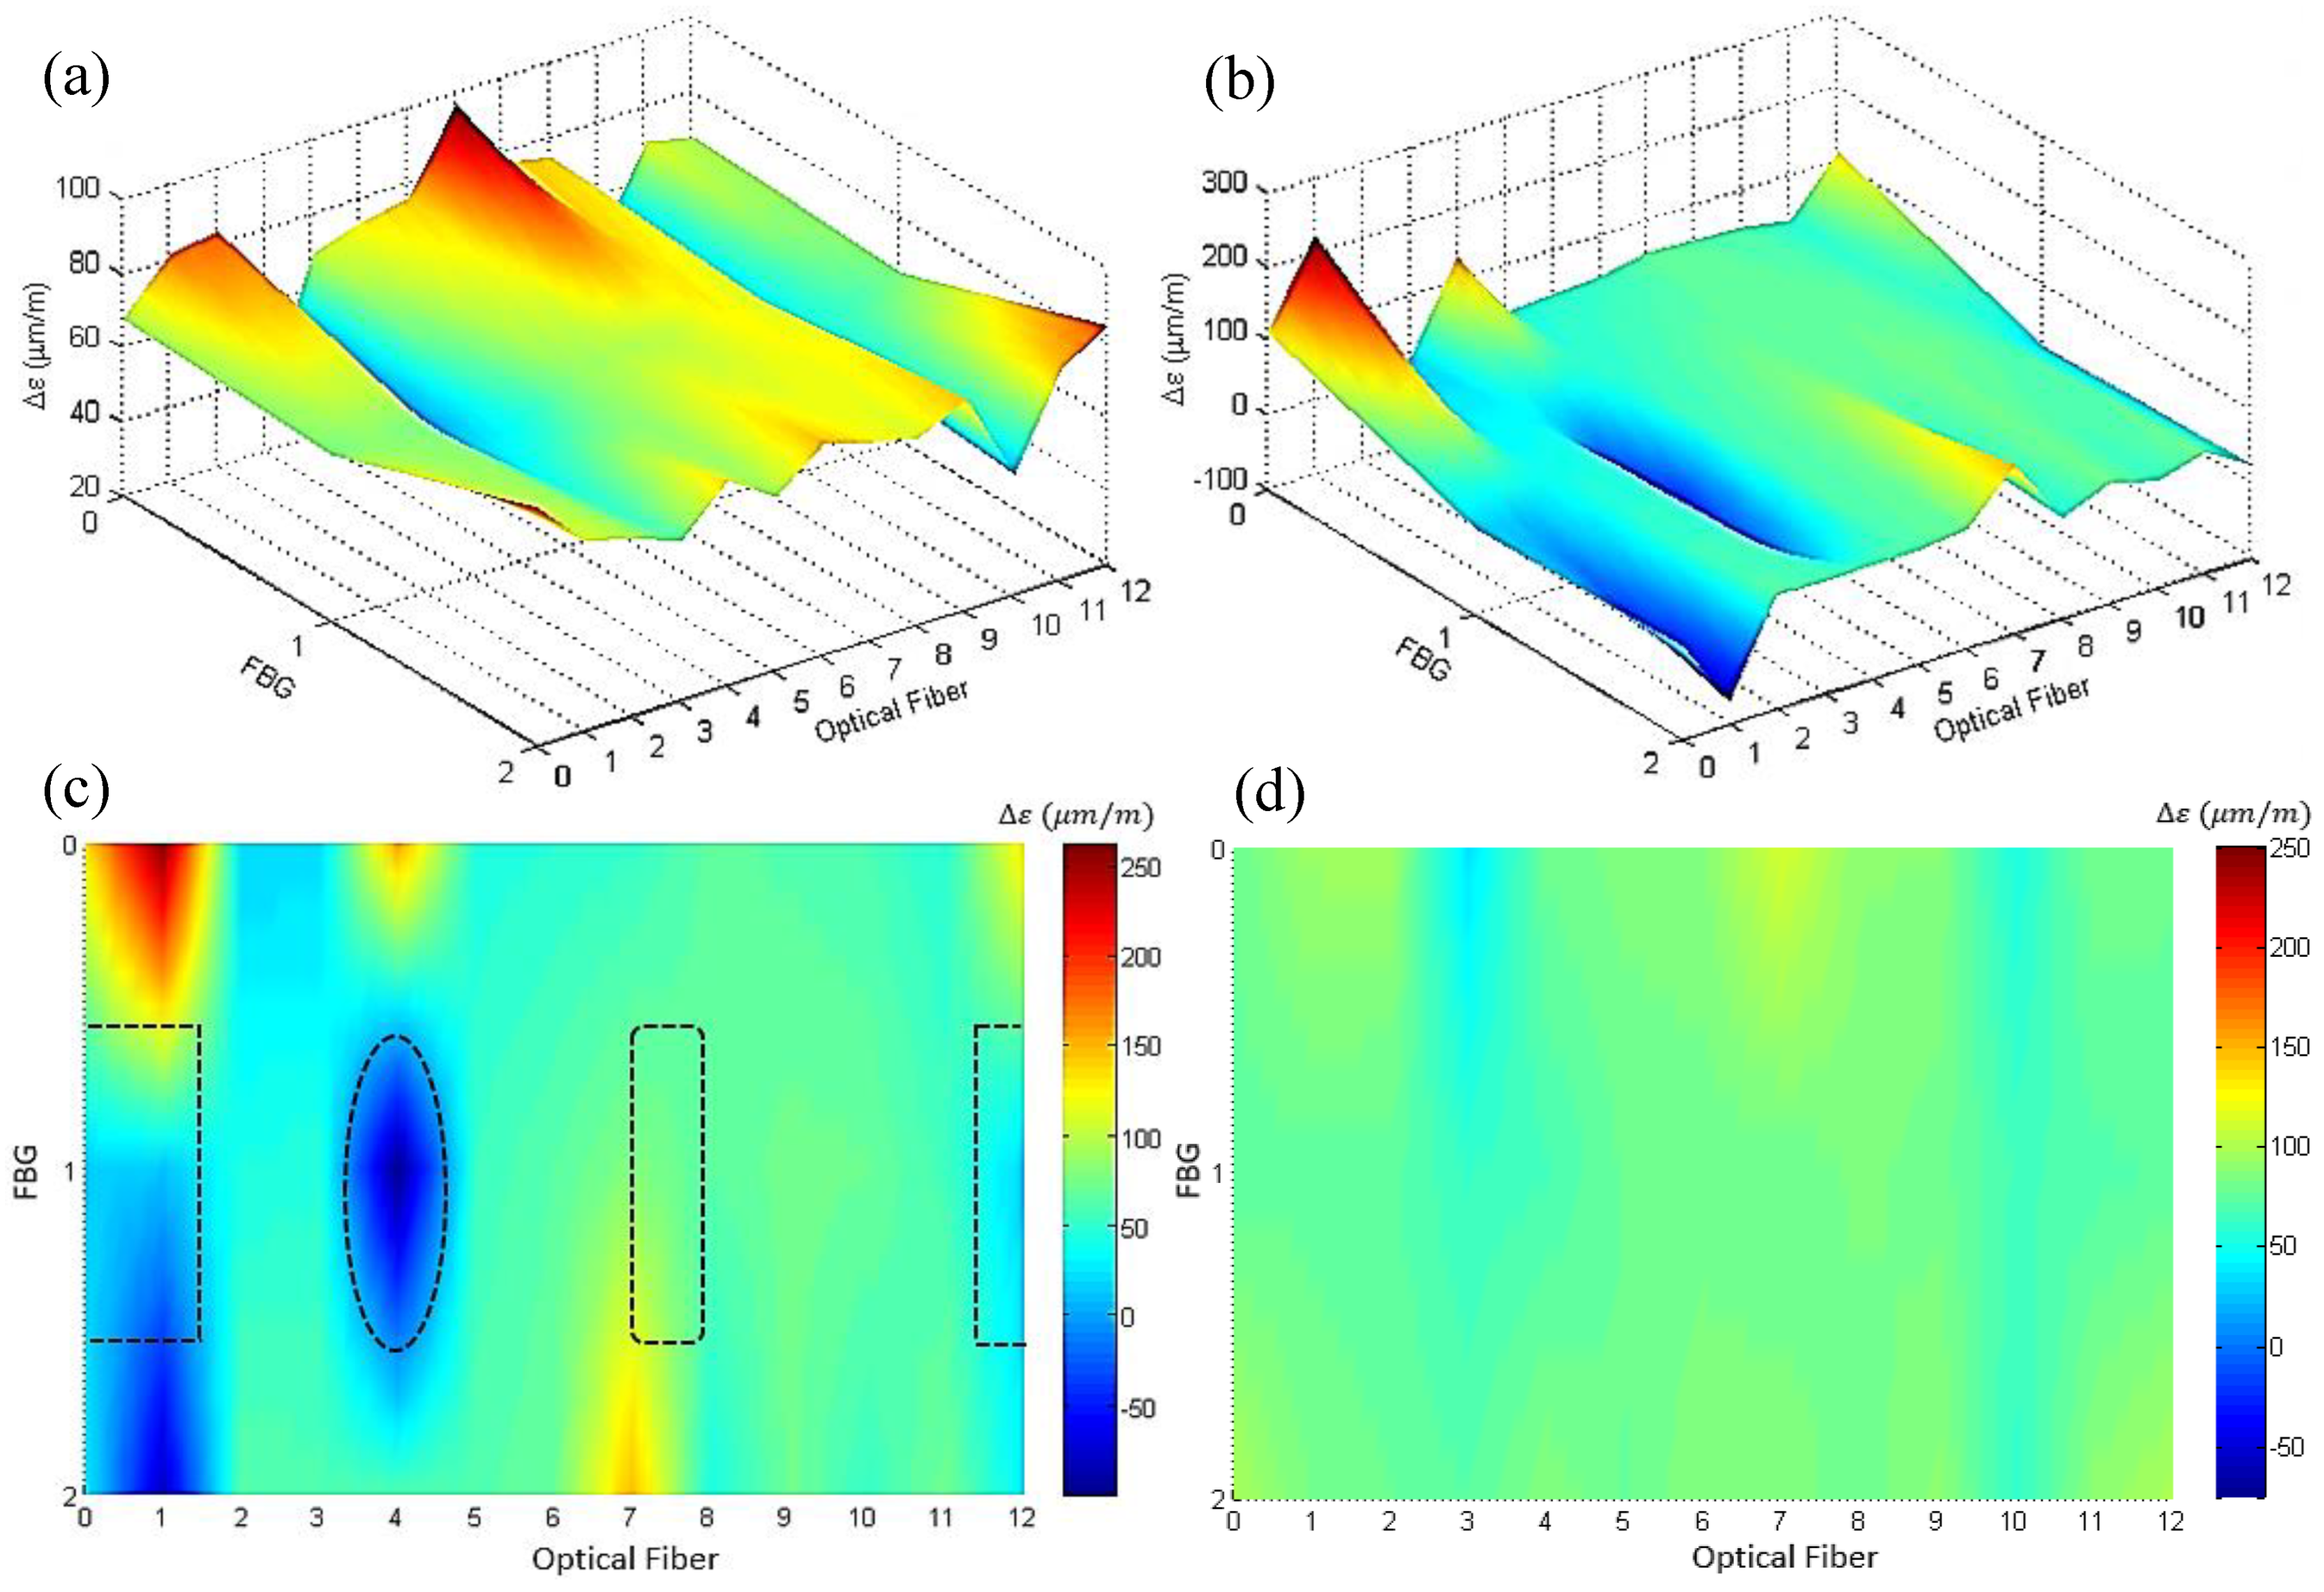
Finally, hydrostatic testing was conducted to evaluate the defect detection and monitoring effectiveness of the embedded sensors when the pipeline is pressurized during operation. The test specimens were pressurized up to 7 bar (0.7 MPa) manometric pressure using a hydraulic hand pump.
Figure 6 contains strain maps obtained by computing the strain difference (
) detected by all FBG sensors at the 7 bar internal pressure in relation to the unpressurized (zero manometric pressure) reference strain values. As expected for this type of test, the
map for S2 (
Figure 6a) shows purely tensile strain, as the sealed pipe is forced to elongate due to the internal pressure load. It is noteworthy that strain levels are reasonably uniform (mean strain = 79.5
, standard deviation = 13.4
), with the fluctuations most likely caused by porosity (observed in
Figure 3b) near the FBGs.
The strain map for S3 in its turn (
Figure 6b,c) shows very distinct anomalies: a dip into negative strain levels is observed coinciding with the position of the circular embedded defect (elongated in
Figure 6c due to the map aspect ratio), and a noticeable strain redistribution is observed in the region containing the larger rectangular defect. The smaller square defect, which was purposefully positioned away from the FBG sensors, unfortunately is not observable as it did not cause a large enough disturbance in the strain field to be detected by surrounding FBGs. If the color bar for the strain map of S2 is rescaled to match that of S3 (
Figure 6d), the difference between the strain map of a sound bonded joint and one with embedded defects becomes very evident. When compared to the strain concentration and redistribution (including areas under compression) caused by the presence of defects (
Figure 6c), the strain fluctuations observed before in
Figure 6a are very small, rendering the rescaled strain color map extremely smooth. This comparison clearly shows that the embedded sensors can detect and monitor the presence of defects during the pipeline operation.

