Proceeding Paper

Human Periodontal Ligament Characterization by Means of Vibrational Spectroscopy and Electron Microscopy †

1
CNR-SPIN, Istituto Superconduttori, Materiali Innovativi e Dispositivi, via Campi Flegrei 34, Pozzuoli 80078, Italy
2
Dip. Multidisciplinare di Specialità Medico-Chirurgiche e Odontoiatriche, Università degli Studi della Campania “Luigi Vanvitelli”, via L. De Crecchio 6, Napoli 80138, Italy
3
Dipartimento di Medicina Sperimentale, Università degli Studi della Campania “Luigi Vanvitelli”, via S. Maria di Costantinopoli 16, Napoli 80138, Italy
*
Author to whom correspondence should be addressed.
Presented at the 7th International Electronic Conference on Sensors and Applications, 15–30 November 2020; Available online: https://ecsa-7.sciforum.net/.
Eng. Proc. 2020, 2(1), 35; https://doi.org/10.3390/ecsa-7-08176
Published: 14 November 2020
(This article belongs to the Proceedings of 7th International Electronic Conference on Sensors and Applications)

Abstract

:
Human periodontal ligament (PDL) is a membrane-like connective tissue interposed between the tooth root and the alveolar bone, the main component of which is represented by collagen fibers. During the early stage of application of orthodontic forces, different changes occur in PDL. For this reason, its characterization with conventional and non-conventional techniques can be extremely interesting. We investigated samples of PDL of orthodontic patients, aged between 13 and 21 years, using different experimental techniques. Morphological characterization of PDL samples was carried out by using a scanning electron microscope. Fourier-Transform Infrared (μ-FT-IR) and Raman (μ-RS) microspectroscopies were used for biochemical characterization of PDL samples. A biochemical characterization of PDL tissues with clear evidence of contributions from collagen, lipid and other protein was obtained. The analysis of Amide I and Amide III components was also performed, giving an indication of the protein secondary structure.

1. Introduction

The periodontal ligament (PDL) is the structure interposed between the tooth root and the alveolar bone, occupying an area of 0.25 to 0.5 mm2. It is a connective tissue whose main component is represented by a set of collagen elastic fibers, parallel to each other, which are inserted on one side in the cementum and on the other in the lamina dura of the alveolar bone (Sharpey’s fibers). The oblique direction of these support fibers in their attack on the tooth surface allows the tooth to possess an elasticity enough to distribute the masticatory forces over a large surface of the alveolar process, allowing the tooth to oppose a greater resistance to forces exerted during normal chewing. Two other important components of the periodontal ligament are: cellular elements, consisting of undifferentiated mesenchymal cells and their lines of differentiation in fibroblasts and osteoblasts, together with the neural elements, and vascular tissue fluid from the circulatory system. The periodontal ligament has vessels and cells of the blood system, despite the poor vascularization and innervation characterized by amyelinic nerves appointed to nociceptive perception, and receptors associated with proprioception, responsible for the perception of the position of the tooth into alveolus and the spatial relationship between the jaws during mastication [1,2]. PDL plays a relevant role during orthodontic treatment, and, for this reason, it is interesting to characterize its structure and components. In the present manuscript, samples of PDL obtained before any orthodontic treatment have been examined by using different experimental techniques that can offer complementary information on PDL properties. Scanning electron microscopy has been used for investigating PDL structures, while Fourier-Transform Infrared microspectroscopy (μ-FT-IR) and Raman microspectroscopy (μ- RS) allowed us to characterize PDL from a biochemical point of view.

2. Materials and Methods

2.1. Sample Preparation

Samples of periodontal ligaments (PDL) of orthodontic patients, aged between 13 and 21 years and treated with the extraction of upper and/or lower premolars, have been selected. Informed consent was obtained from each minor patient’s parents or adult patients after providing them with detailed information about the clinical trial. The PDL was scarified from radicular surface of the extracted premolars using a one-way lancet. Each sample has dimensions of the order of few mm3. The PDL samples were fixed in 4% paraformaldehyde (PFH) for at least 3 h. PFH was removed by centrifugation (2000 rpm for 2 min). To fix samples graded series of ethanol solutions (50%–70%–80%–95%) were used. Samples were left in each ethanol’s solution for 1 h at room temperature starting from 50% solution to 95% and then they were stored in ethanol 100% until analysis.

2.2. Experimental Techniques

2.2.1. Scanning Electron Microscopy (SEM)

Collected PDL samples were washed in a phosphate-buffered saline (PBS) solution, fixed in 4% paraformaldehyde in PBS and then dehydrated with increasing ethanol percentage (30–90% in water for 5 min, twice 100% for 15 min). After drying in Critical Point Dryer (EMITECH K850), samples were sputter coated with platinum-palladium (Denton Vacuum DESKV, 77 mAmps e 120 S.) and observed with a Supra 40 Zeiss Field-emission scanning electron microscope (EHT = 5.00 kV, WD = 22 mm, detector in lens).

2.2.2. FT-IR Microspectroscopy

FT-IR spectra were obtained using a Perkin Elmer Spectrum One spectrometer in a transmission geometry using KBr pellets. Initially, 0.1 g of a PDL sample was mixed with 5 mL water and sonicated on ice for 5 min by using a Soniprep 150 Plus Utrasonic Disgregator. The homogenate was stored at −20 °C for 24 h. After this, the sample was lyophilized (24 h), using a Lio-5P Freeze Dryer. KBr pellets were prepared by mixing a small quantity of PDL sample with KBr (at the ratio of 1/100). For every sample, two KBr pellets were prepared. All spectra were obtained using 64 scans in the range from 4000 to 450 cm−1with a 4 cm−1 spectral resolution. The spectra were preliminarily analyzed using the application routines provided by the software package (“Spectrum” Perkin Elmer Inc., Hopkinton, MA, USA) controlling the whole data acquisition system. The spectra were further analyzed in terms of convoluted peak functions to determine the basic vibrational modes that contribute to the FT-IR signal by using a best-fit peak fitting routine of GRAMS software based on the Levenberg–Marquardt nonlinear least square method. Lorentzian–Gaussian curves were used. Peaks constituting the spectrum were manually selected to define the starting conditions for the best-fit procedure. The bestfit was then performed to determine the optimized intensity, position, and width of the peaks. The performance of the procedure was evaluated by means of the χ2 parameter [3].

2.2.3. Raman Microspectroscopy

Samples were excited by the light of a He-Ne laser operating at a wavelength λ = 633 nm, with a maximum nominal power of 17 mW. The signal was collected by a Jobin-Yvon TriAx 180 monochromator, equipped with a liquid N2 cooled charge-coupled device (CCD) and a grating of 1800 grooves/mm, allowing for a spectral resolution of 4 cm−1. The laser light was focused on the sample surface by means of a 100× (n.a. = 0.90) optical objective on an excitation area of about 10 μm of size. The spectra were obtained using accumulation times ranging in 60–300 s. The spectra were analyzed using the same approach previously described for FT-IR spectra (also see [4]). For Raman spectra, the Lorentzian peak shape was used. The band of amide I (located in the 1550- to 1750-cm−1 wave number region) was detailly analyzed for obtaining significant information about protein configuration.

3. Results and Discussion

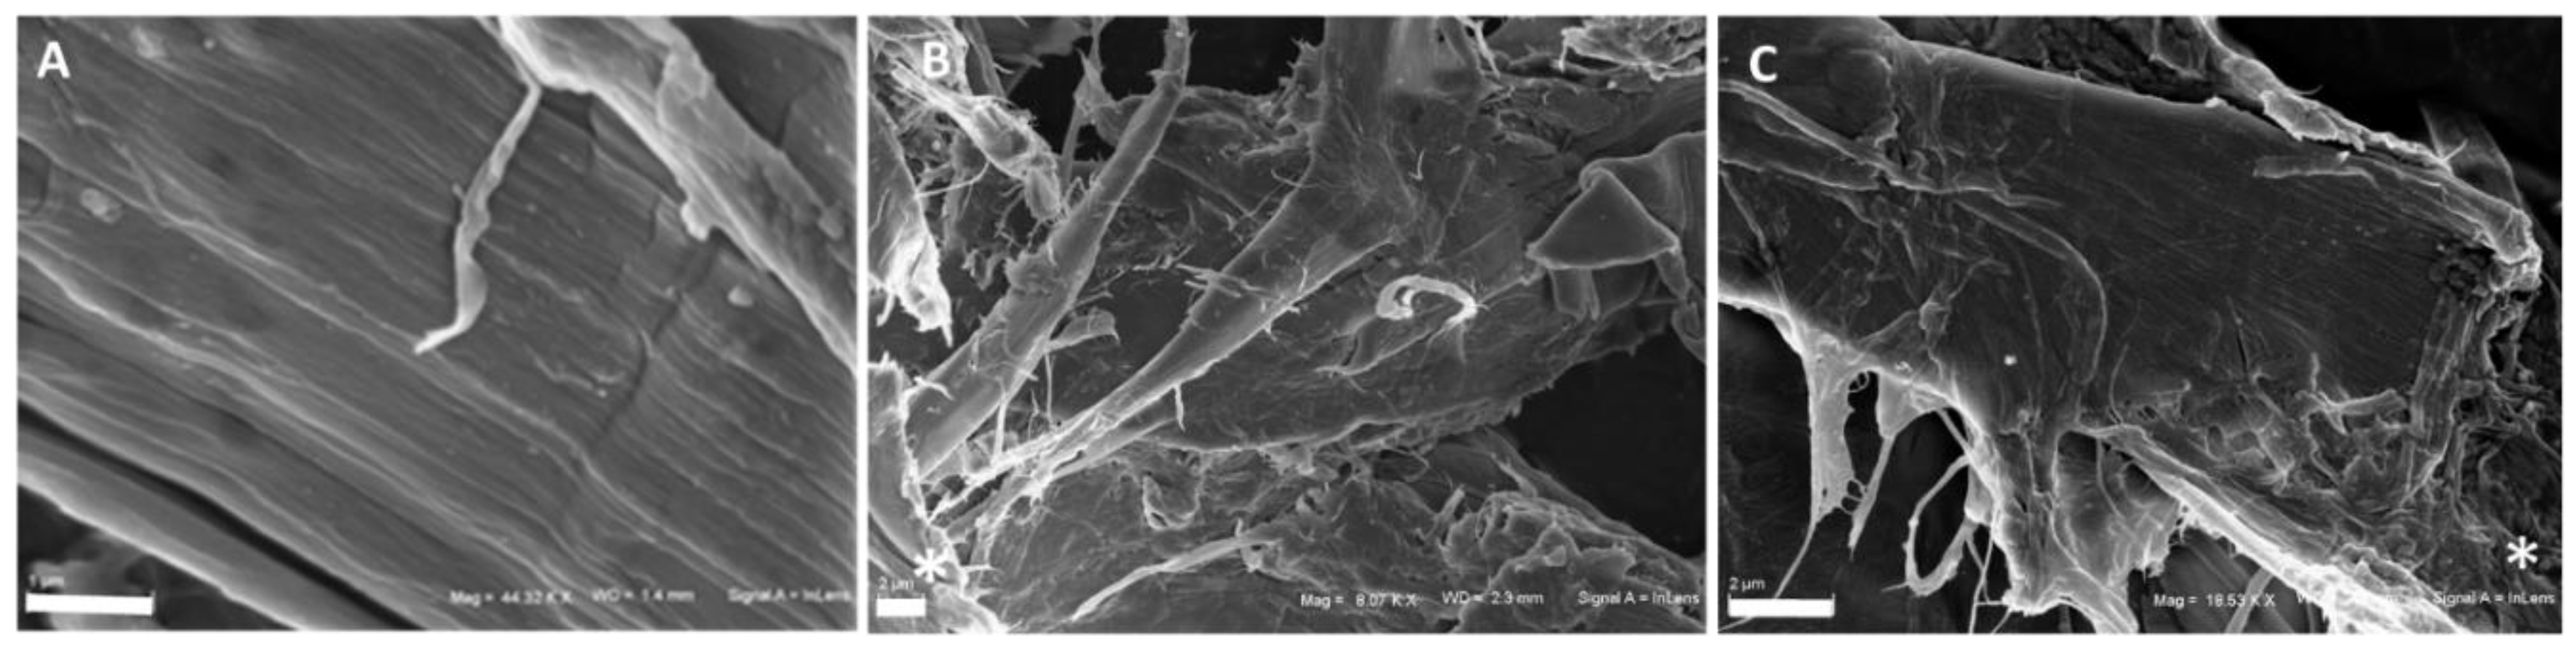
3.1. SEM Observations
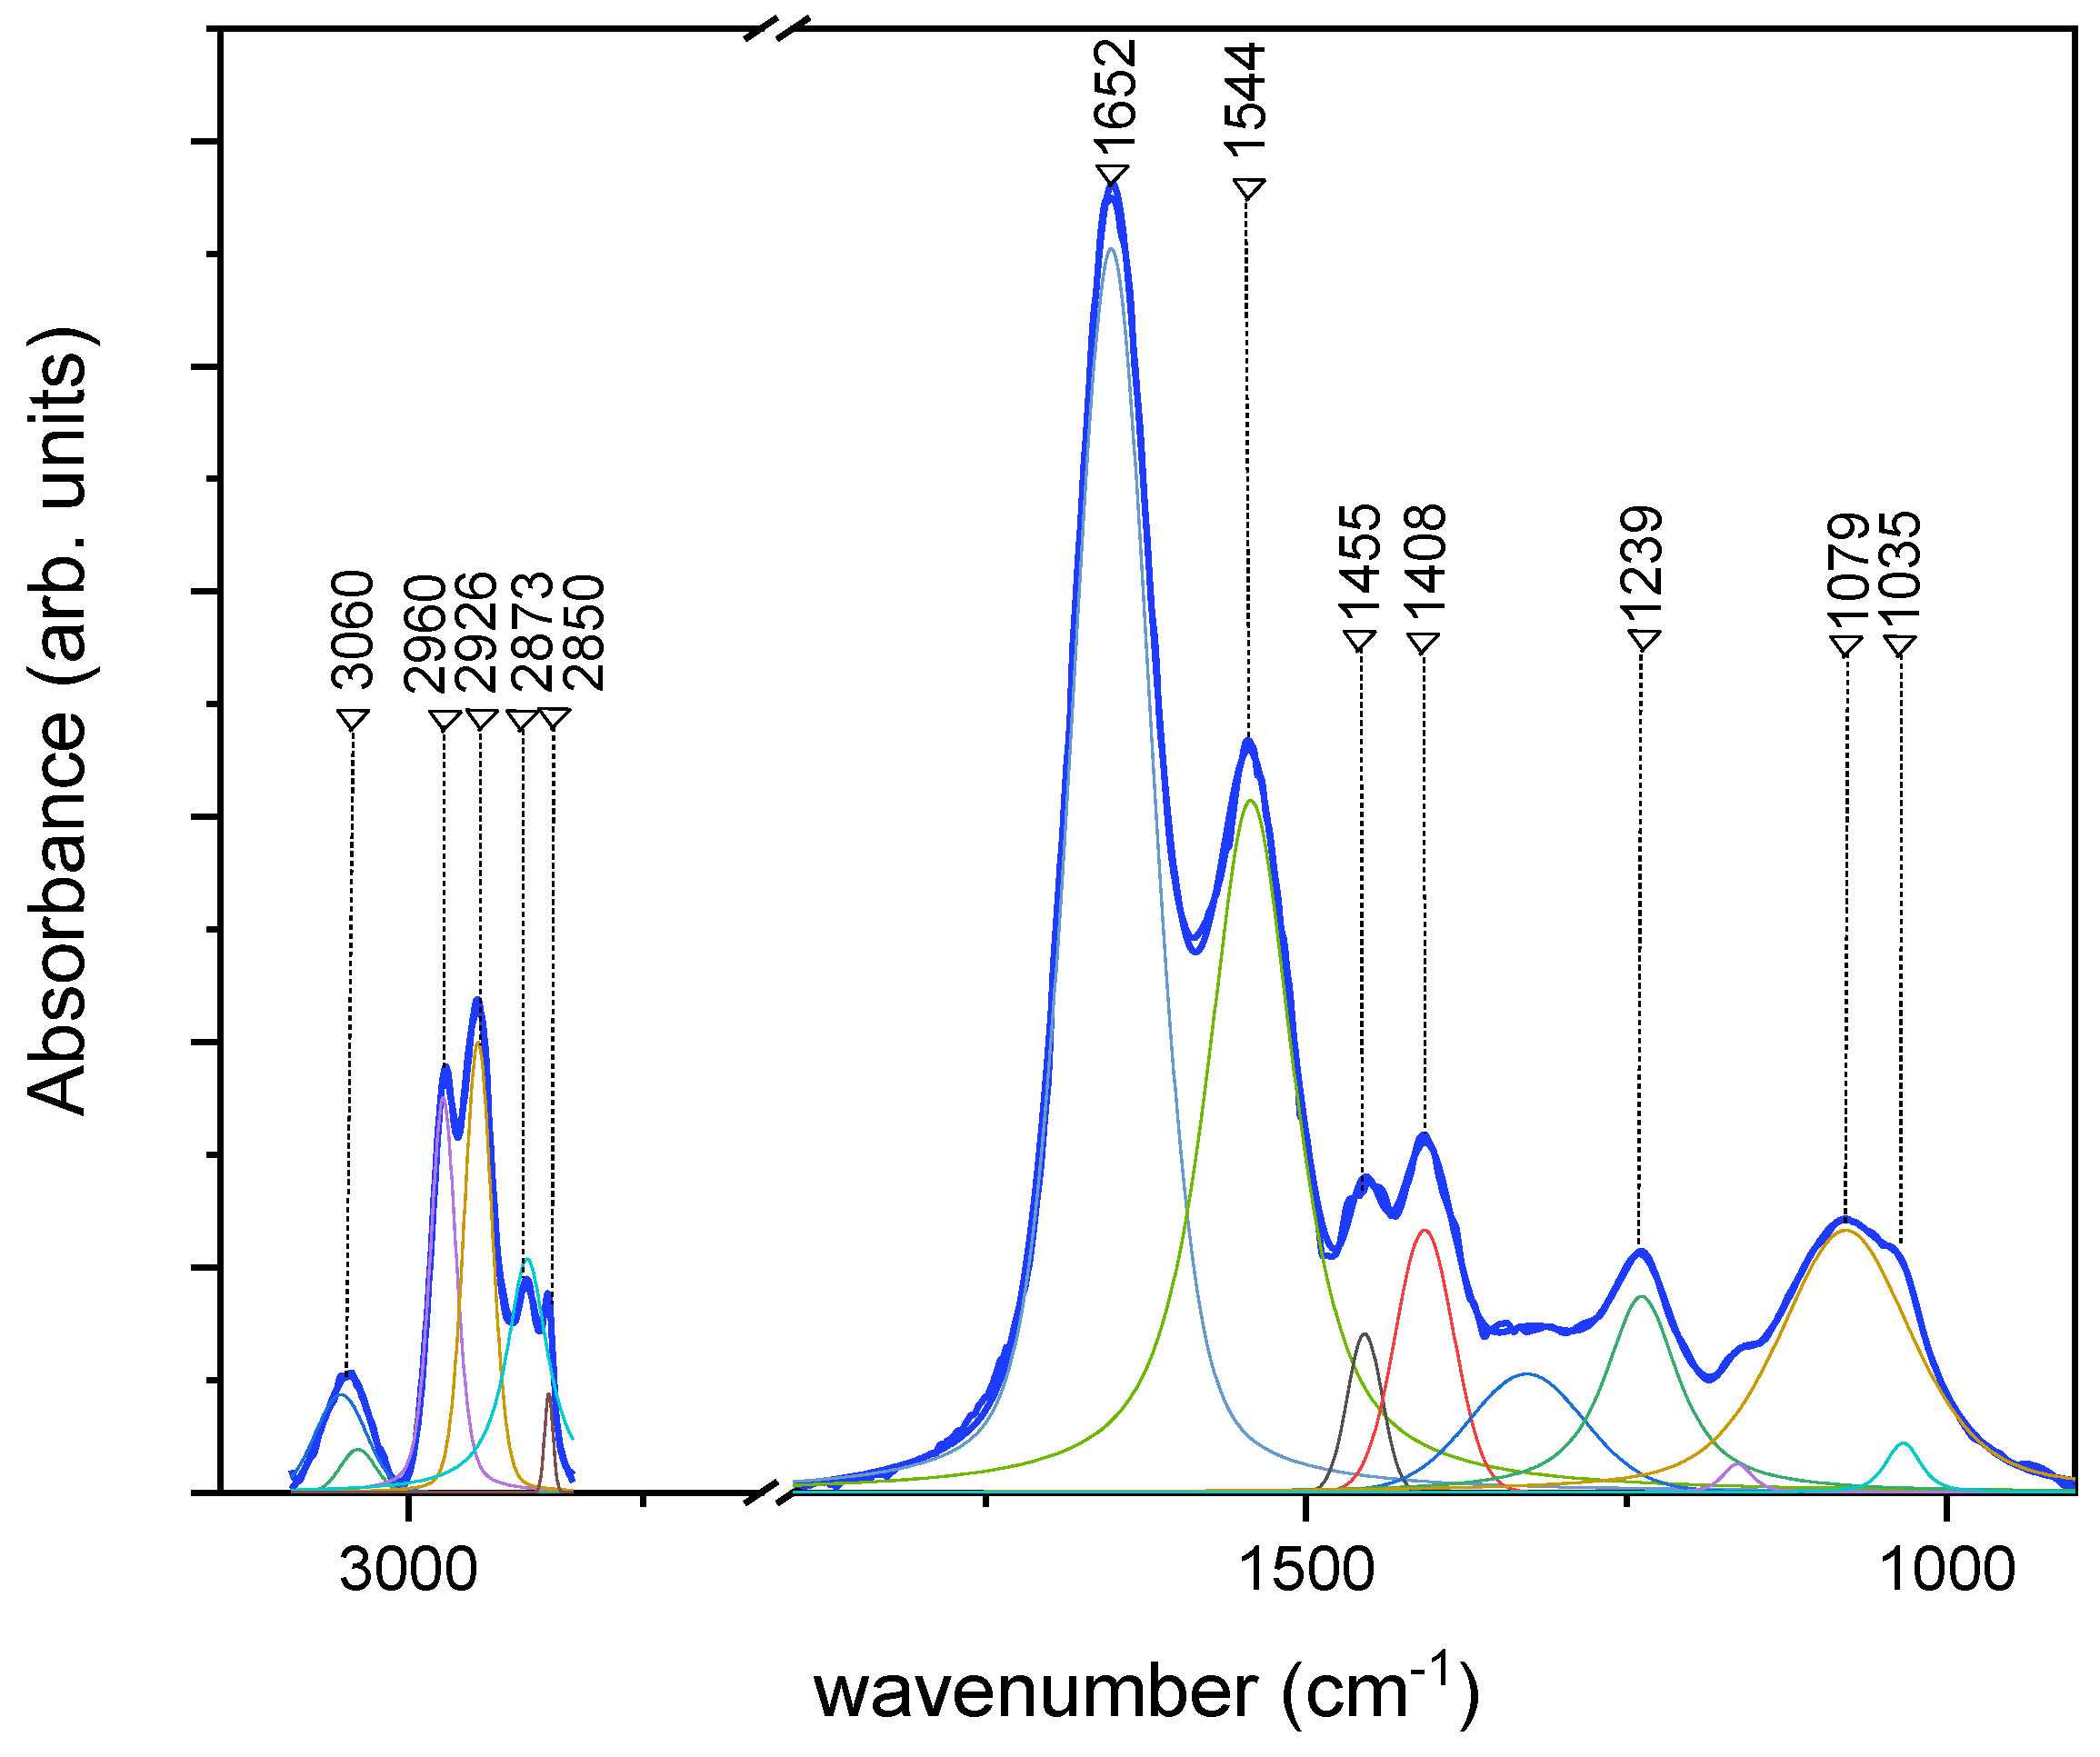
Numerous collagen fibres thickened in bundles are clearly visible at scanning electron microscopy observation as shown in Figure 1A. Figure 2B,C shows in two different area and at different magnification the connection between collagen fibers of periodontal ligament and bone matrix fibres (white asterisk).

3.2. FT-IR Results

In Figure 2, a representative infrared spectrum of PDL is reported together with the results of the deconvolution procedure performed by using Lorentzian–Gaussian curves. The main contribution to the spectrum and the related assignments are reported in Table 1. The region related to C-H bonds in the region 3100–2800 cm−1 can be related to collagen contribution evidenced by SEM micrographs and to a lesser extent to lipid content. In the 1750–1000 cm−1 region, the band at 1656 cm−1 is due to the C=O stretching of Amide I. For other peaks, see Table 1. Interesting information about the secondary structure of protein content could be obtained by considering the subcomponents of Amide I and Amide III regions. The deconvolution of the Amide I region (1750–1580 cm−1) indicates the presence of different subcomponents that are related to the protein secondary structure. The contributions at 1673 cm−1 are ascribed to the β-turn subcomponent, the ones at 1661 and 1650 cm−1 are related to the α-helix subcomponent, and the features at 1639 and 1631 cm−1 are due to the β-sheets subcomponent.
Figure 2. Representative Fourier-Transform Infrared (FT-IR) spectrum of periodontal ligament (PDL) in the 3100–1000 cm−1 with the deconvolution analysis of peaks with Gaussian–Lorentzian curves (blue line: experimental curve).
Engproc 02 00035 g002

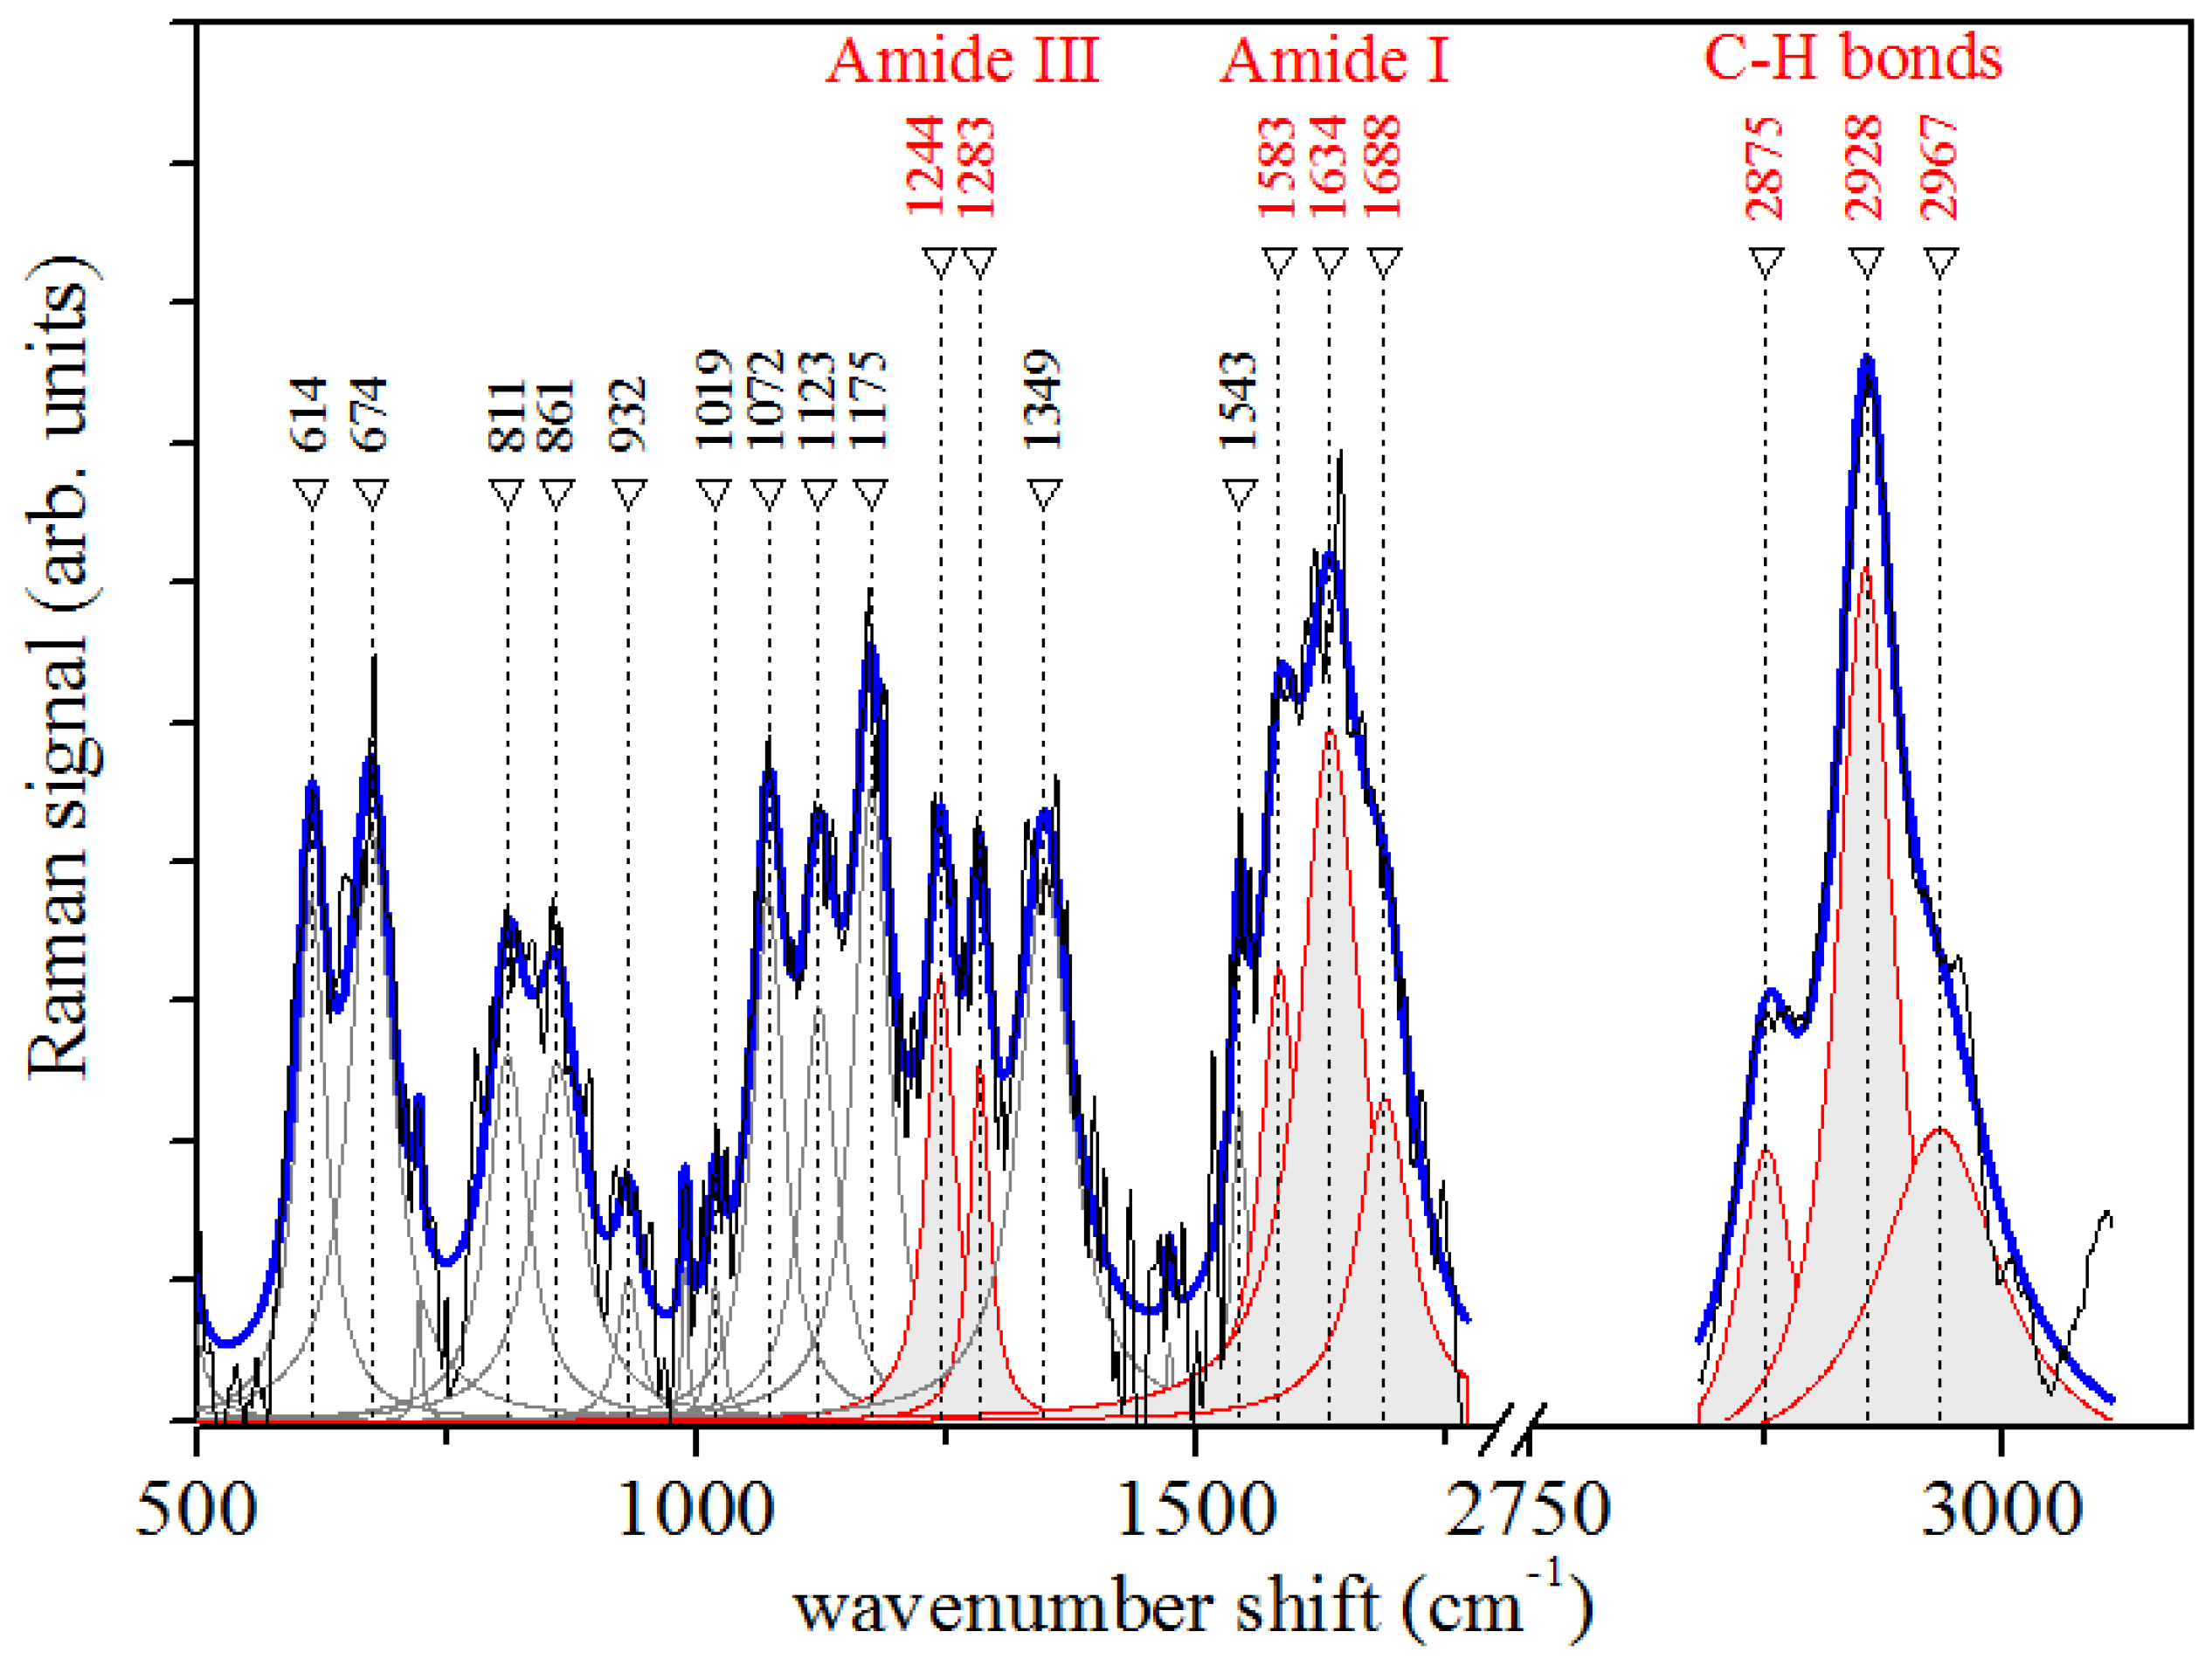
3.3. Raman Microspectroscopy Results

In Figure 3, a representative Raman spectrum of PDL is reported. As is evident, the main contribution due to Amide I and Amide III are evident together with the contributions due to the C-H bonds. These features are related to collagen structure, and the bands in the CH3/CH2 region could also be associated with tissue lipid components. See [5] and Table 2 for other assignments and details.
Also in the case of Raman microspectroscopy, the analysis of subcomponents of Amide I and Amide III has allowed us information about the secondary structures of PDL protein content [5,6]. As said before, the Amide I band consisted of major components that are related to the secondary structure of the protein. This band allowed us to obtain information on collagen which is the main PDL component. In particular, the contributions of α-helix, β-sheet, collagen 310-helix and β-turn subcomponent were centered at about 1642, 1647, 1617 and 1668 cm−1, respectively.

4. Conclusions

The reported results highlight the great potential of the techniques used for characterizing human PDL samples from different points of view. In particular, SEM investigation evidences the PDL structure, while μ-FT-IR and μ-RS offer complementary information about the biochemical composition of this kind of tissue that plays a very peculiar role during orthodontic treatments when the application of forces can cause structural and biochemical changes.

Author Contributions

Conceptualization, M.L., L.P., and F.D.; methodology, C.C., M.P. and M.C.; software, C.C., M.P. and M.C.; investigation, C.C., M.P., F.D., M.C. and S.E.; writing—original draft preparation, M.L., C.C. and M.P.; writing—review and editing, M.L., C.C., and M.P. All authors have read and agreed to the published version of the manuscript.

Funding

This research received no external funding.

Conflicts of Interest

The authors declare no conflict of interest.

References

  1. Anastasi, G.; Cordasco, G.; Matarese, G.; Rizzo, G.; Nucera, R.; Mazza, M.; Militi, A.; Portelli, M.; Cutroneo, G.; Favaloro, A. An immunohistochemical, histological, and electron-microscopic study of the human periodontal ligament during orthodontic treatment. J. Mol. Med. 2008, 21, 545–554. [Google Scholar] [CrossRef]
  2. d’Apuzzo, F.; Cappabianca, S.; Ciavarella, D.; Monsurrò, A.; Silvestrini-Biavati, A.; Perillo, L. Biomarkers of Periodontal tissue remodeling during orthodontic tooth movement in mice and men: Overview and clinical relevance. Sci. World J. 2013, 2013, 105873. [Google Scholar]
  3. Portaccio, M.; d’Apuzzo, F.; Perillo, L.; Grassia, V.; Errico, S.; Lepore, M. Infrared microspectroscopy characterization of gingival crevicular fluid during orthodontic treatment. J. Mol. Struct. 2019, 1176, 847–854. [Google Scholar] [CrossRef]
  4. Delfino, I.; Perna, G.; Lasalvia, M.; Capozzi, V.; Manti, L.; Camerlingo, C.; Lepore, M. Visible micro-Raman spectroscopy of single human mammary epithelial cells exposed to X-ray radiation. J. Biomed. Opt. 2015, 20, 035003. [Google Scholar] [CrossRef] [PubMed]
  5. Perillo, L.; D’Apuzzo, F.; Illario, M.; Laino, L.; Di Spigna, G.; Lepore, M.; Camerlingo, C. Monitoring Biochemical and structural changes in human periodontal ligaments during orthodontic treatment by means of micro-Raman spectroscopy. Sensors 2020, 20, 497. [Google Scholar] [CrossRef] [PubMed]
  6. Camerlingo, C.; d’Apuzzo, F.; Grassia, V.; Perillo, L.; Lepore, M. Micro-Raman spectroscopy for monitoring changes in periodontal ligaments and gingival crevicular fluid. Sensor 2008, 14, 22552–22563. [Google Scholar] [CrossRef] [PubMed]
Figure 1. Scanning Electron Microscopy (SEM) micrographs of periodontal ligaments. Collagen fibers and bone matrix. Scale Bar = 1 µm in (A), 2 µm in (B) and (C).
Engproc 02 00035 g001
Figure 3. Representative Raman spectrum of PDL. The blue curve is the convolution of the Lorentzian components estimated by fitting the experimental data.
Engproc 02 00035 g003
Table 1. Assignments of the main modes of FT-IR spectra of PDL according to references reported in [3,4].
FT-IR Mode
ν (cm−1)
Assignments
3279Amide A (-N-H ν)
2960CH3 as. ν
2926CH2 as. ν
2873CH3 s. ν
2850CH2 s. ν
1652Amide I (C=O ν,
C-N ν)
1544Amide II (C-N ν,
C-NH δ, α-helix)
1455CH3 as. δ, CH2 s.
1408COO s. ν
1239PO2 as. ν
C-O-P ν
1079PO2 s. ν
C-O-P ν
1035C-O ν
Table 2. Assignments of the main modes of Raman spectra of PDL according to references reported in [3,4].
Raman Mode
ν (cm−1)
Assignments
614phosphate δ
811CC skeleton
861proline
932phosphate
1019C-N proline
1072C-N proline
1123C-N
1175C-O ν
1244random coil—Amide III
1283α-helix—Amide III
1349CH2 Glycine—Amide III
1543N-H δ—Amide II
1583β-sheet—Amide I
1634α-helix—Amide I
1688β-turn—Amide I
2875CH2 as. ν
2928CH3 s. ν
Publisher’s Note: MDPI stays neutral with regard to jurisdictional claims in published maps and institutional affiliations.

