Proceeding Paper

Real Application For A Data Acquisition System From Sensors Based On Embedded Systems †

by
Jaiber Camacho-Olarte
* and
Diego Alexander Tibaduiza Burgos
Departamento de Ingeniería Eléctrica y Electrónica, Universidad Nacional de Colombia, Cra 45 No. 26-85, Bogotá 111321, Colombia
*
Author to whom correspondence should be addressed.
Presented at the 7th International Electronic Conference on Sensors and Applications, 15–30 November 2020; Available online: https://ecsa-7.sciforum.net/.
Eng. Proc. 2020, 2(1), 25; https://doi.org/10.3390/ecsa-7-08275
Published: 14 November 2020
(This article belongs to the Proceedings of 7th International Electronic Conference on Sensors and Applications)

Abstract

:
Data acquisition systems are one of the main components for sensors and remote monitoring strategies required in a real process. Normally, data acquisition is performed through commercial solutions that are adaptable to a specific solution, and expansion capabilities are associated with the products (HW/SW) of the same company, which results in limited possibilities of expansion. As a contribution to solving this problem, a hardware development project with embedded systems and focused on the Internet of Things was designed. A data acquisition system was proposed and validated through a real application using the prototype built, monitoring variables in a photovoltaic system such as voltage and current to analyze the behavior of the solar panels. Testing and evaluation of the prototype were carried out in several experiments, where the most common failures of a photovoltaic plant were emulated, finding that the recorded data provide the necessary information to identify the moments in which the system being monitored presents problems. In this way, it was found that the developed system can be used as a remote monitoring system since the information that the device takes through the current and voltage sensors can be sent to a server through an Internet connection for data processing, graph generation, or statistical analysis according to the requirements. These features allow a friendly presentation of the data to an end-user.

1. Introduction

Data acquisition is one of the most important parts of the process of online monitoring. To achieve this task, multiple solutions are commercially available; however, most of these devices are custom made solutions and future expansions are bounded to the manufacturer. As a contribution to solving this problem, a monitoring device manufactured with free software and hardware tools [1] is presented in this work. This device allows capturing information from sensors and then storing it in a database on a virtual server, using a wireless connection through a WiFi network. To carry out the validation of the device, series of tests with a solar power plant were performed. For this, the most common faults that occur in this type of assembly were explored; for the plant, polycrystalline panels were used as an element of the first generation, according to the division presented by Sharma [2]. In addition, taking as reference the failures shown in the work of Raja Paul [3], some behaviors such as the open circuit due to disconnection and partial shadows in one of the panels were emulated. On the other hand, given the possibility of Internet connection offered by the device and due to the marked trend towards IoT (Internet of Things), both in applications and in research [4,5,6], connection tests were carried out that allowed knowing the behavior of the messages sent to the system database. Some commercial solutions that can offer similar functionalities are the devices from companies such as Acellent [7], Mageba [8], and Digitexx [9], which are specific hardware products that allow taking information from sensors and performing subsequent processing using proprietary software tools that each company develops, which is why additional costs may be generated due to the licenses that must be acquired [10]. Continuing with this aspect, currently, there are large communities dedicated to expanding knowledge through free software projects, which have made it possible to reach final products with great benefits, becoming similar or better than their proprietary counterparts [11].
The organization of this work begins with this Introduction and then goes through the materials and methods (Section 2), where the developed device and elements required for the application and validations are presented. After that, tests that were carried out for validation are presented in Section 3. Finally, conclusions are discussed in Section 4.

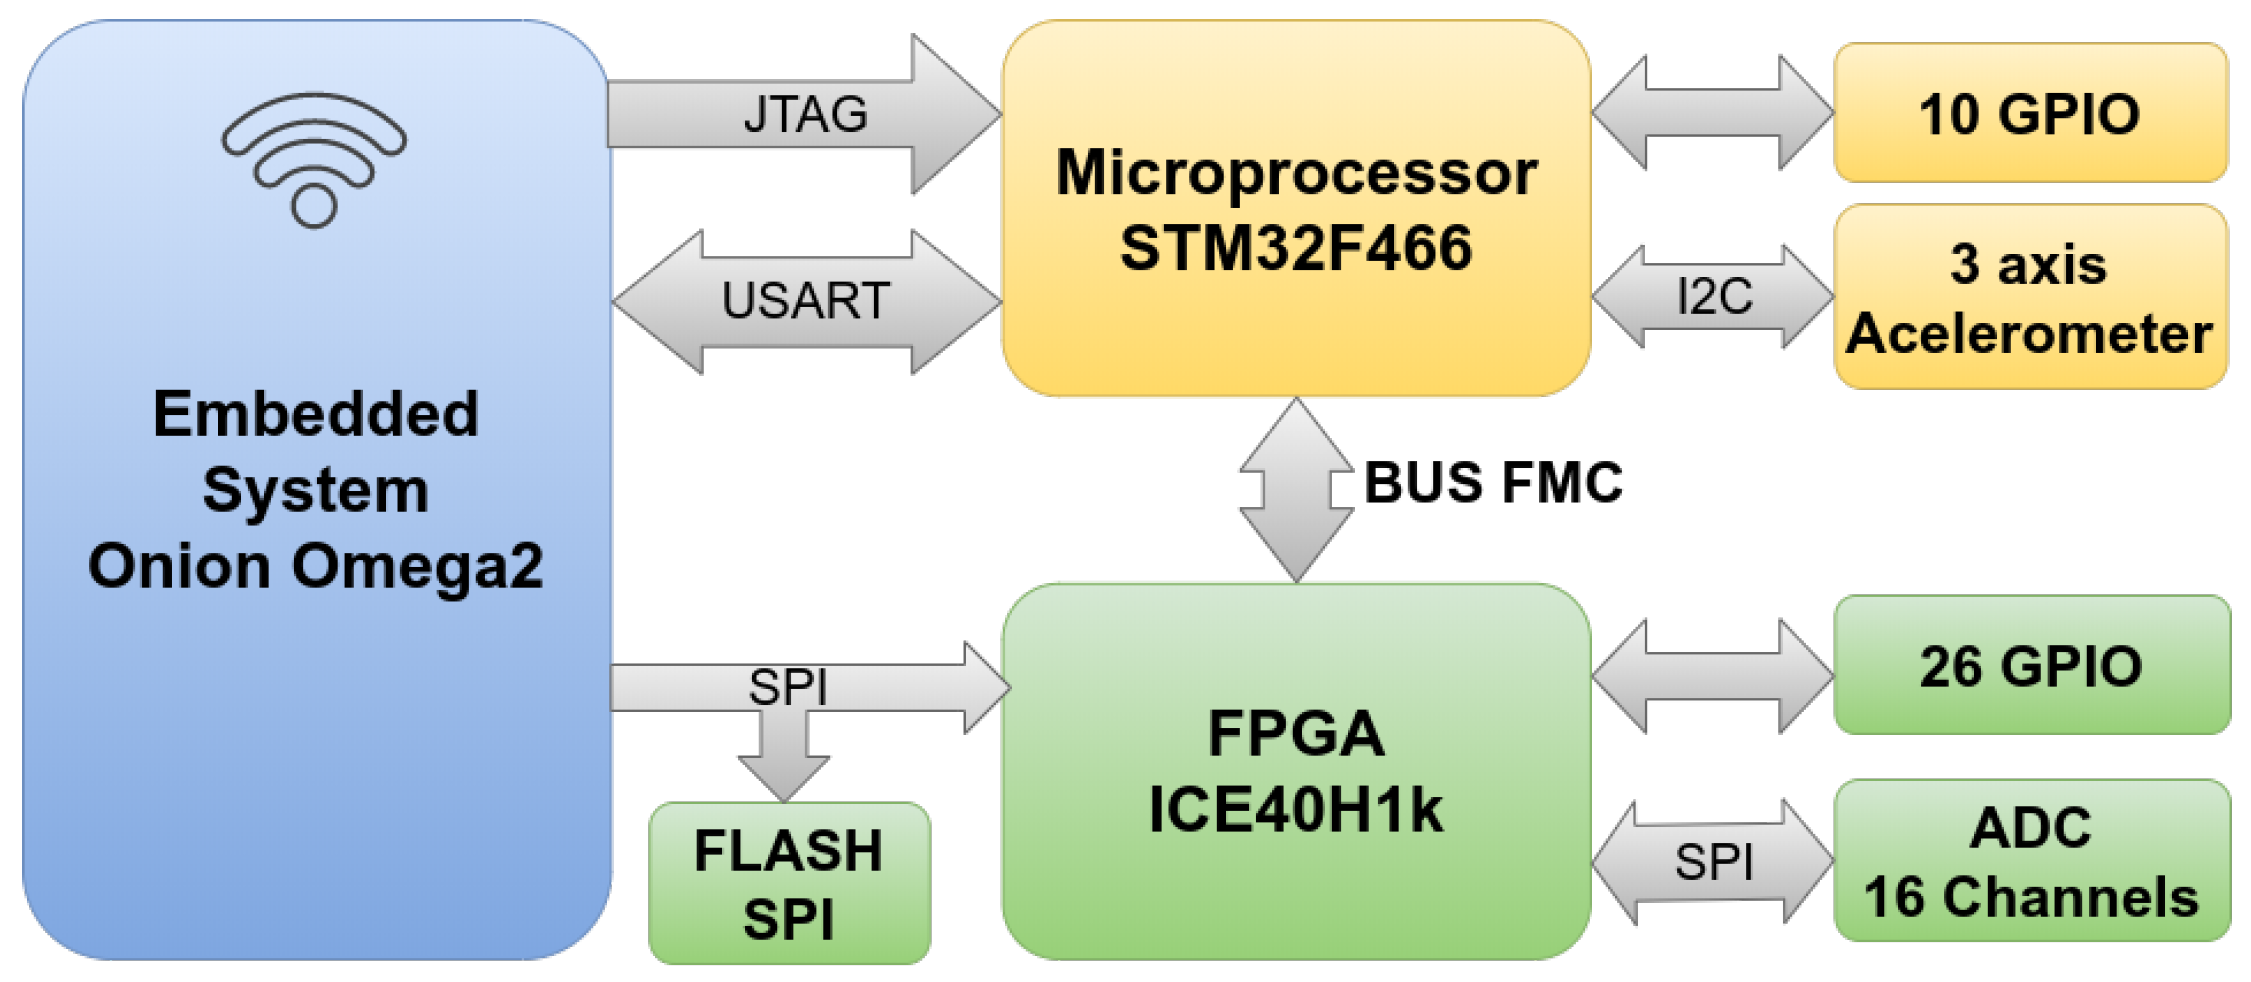
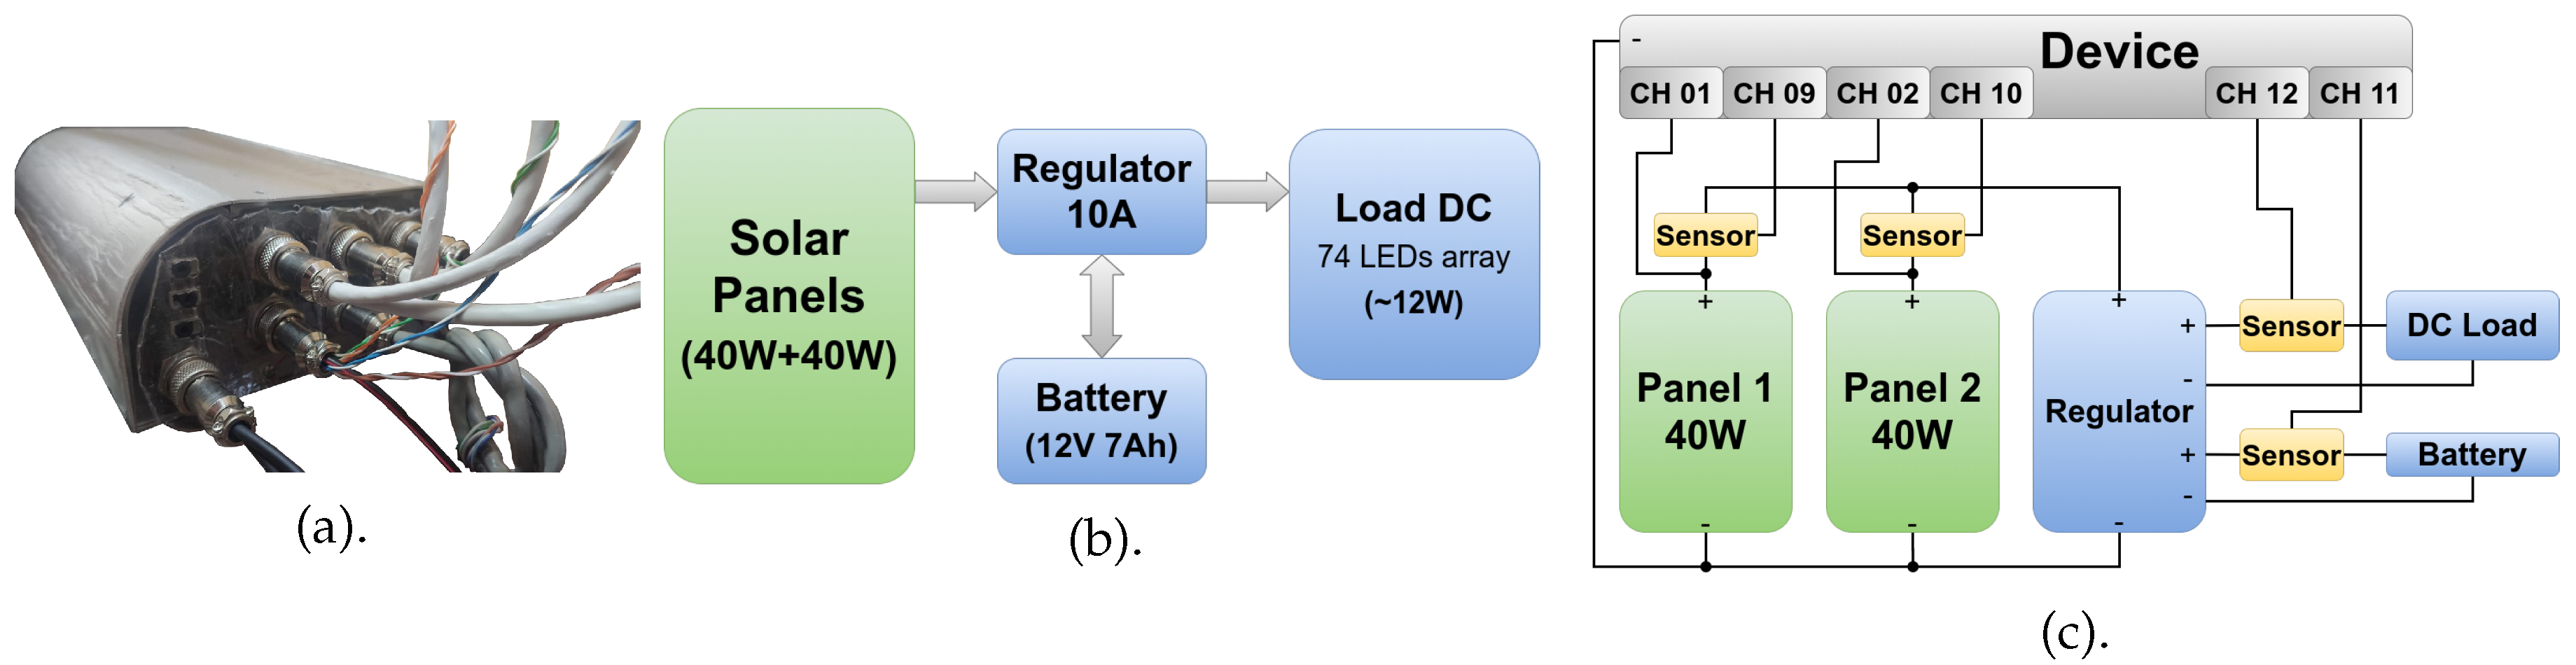
2. Materials and Methods

The device developed is represented by the block diagram in Figure 1 where three principal blocks are shown: an embedded system, an FPGA, and a microprocessor. In this architecture, the embedded system is in charge of configuring the FPGA through an SPI communication managed by a program developed for this project and called iceSPIprog, which takes the binary file generated by the project’s toolchain IceStrom [12,13] and sends it to SPI flash memory. As for the initial programming of the microprocessor, it is carried out using the JTAG protocol with the help of the free software tool OpenOCD [14]. On the other hand, when the device is operating, the embedded system must connect to the Internet and send information to the database on the virtual server.
Figure 2a shows the developed device which has 16 analog channels with a resolution of 12 bits and a voltage range of 0–5 [V], reaching sample rates of up to 200 kSPS (thousand samples per second). Additionally, there is access to 36 general-purpose pins managed by a microprocessor and an FPGA, which allows great versatility for handling different types of sensors and actuators. Besides, given the WiFi connectivity and the use of a database, the system allows access to the information collected anytime and from anywhere [1]. On the other hand, with the 16 channels for analog sensors, it is possible to monitor the current and voltage behaviors of a solar panel system, which constitutes the real application with which the device performance tests were carried out. The diagram in Figure 2b was used for validation. This diagram represents a typical connection of a photovoltaic system for DC loads, where it has the energy transformation phase with the solar panels, a second storage phase in a battery employing a charge regulator, and finally the consumption phase with a DC load of 74 LEDs, which represent an approximate consumption of 12 W. In Figure 2c, the connection diagram implemented between the device and the photovoltaic energy plant is shown, where the monitoring of the voltages of Panels 1 and 2 on Channels 1 and 2 of the device developed, in addition Channels 9–11, were used for measuring the currents of the panels, the battery charge, and the consumption in the load.

2.1. Tests Performed

Regarding the tests carried out, four types of experiments were proposed to verify the behavior of the equipment in real situations, initially analyzing the connection and sending of information from the equipment to the database, to determine the number of messages that are lost and then emulating failures of a photovoltaic system by making partial disconnections and obstructions in one of the solar panels. The following subsections describe the experiments performed.

2.1.1. Number of Messages Sent in 24 h

In this test, the transmission of messages on the device was configured to send 57 messages every 10 min, which indicates a total of 8208 daily messages. Besides, the experiment was carried out for 14 days to determine the behavior in terms of connectivity between the device and the database on the virtual server.

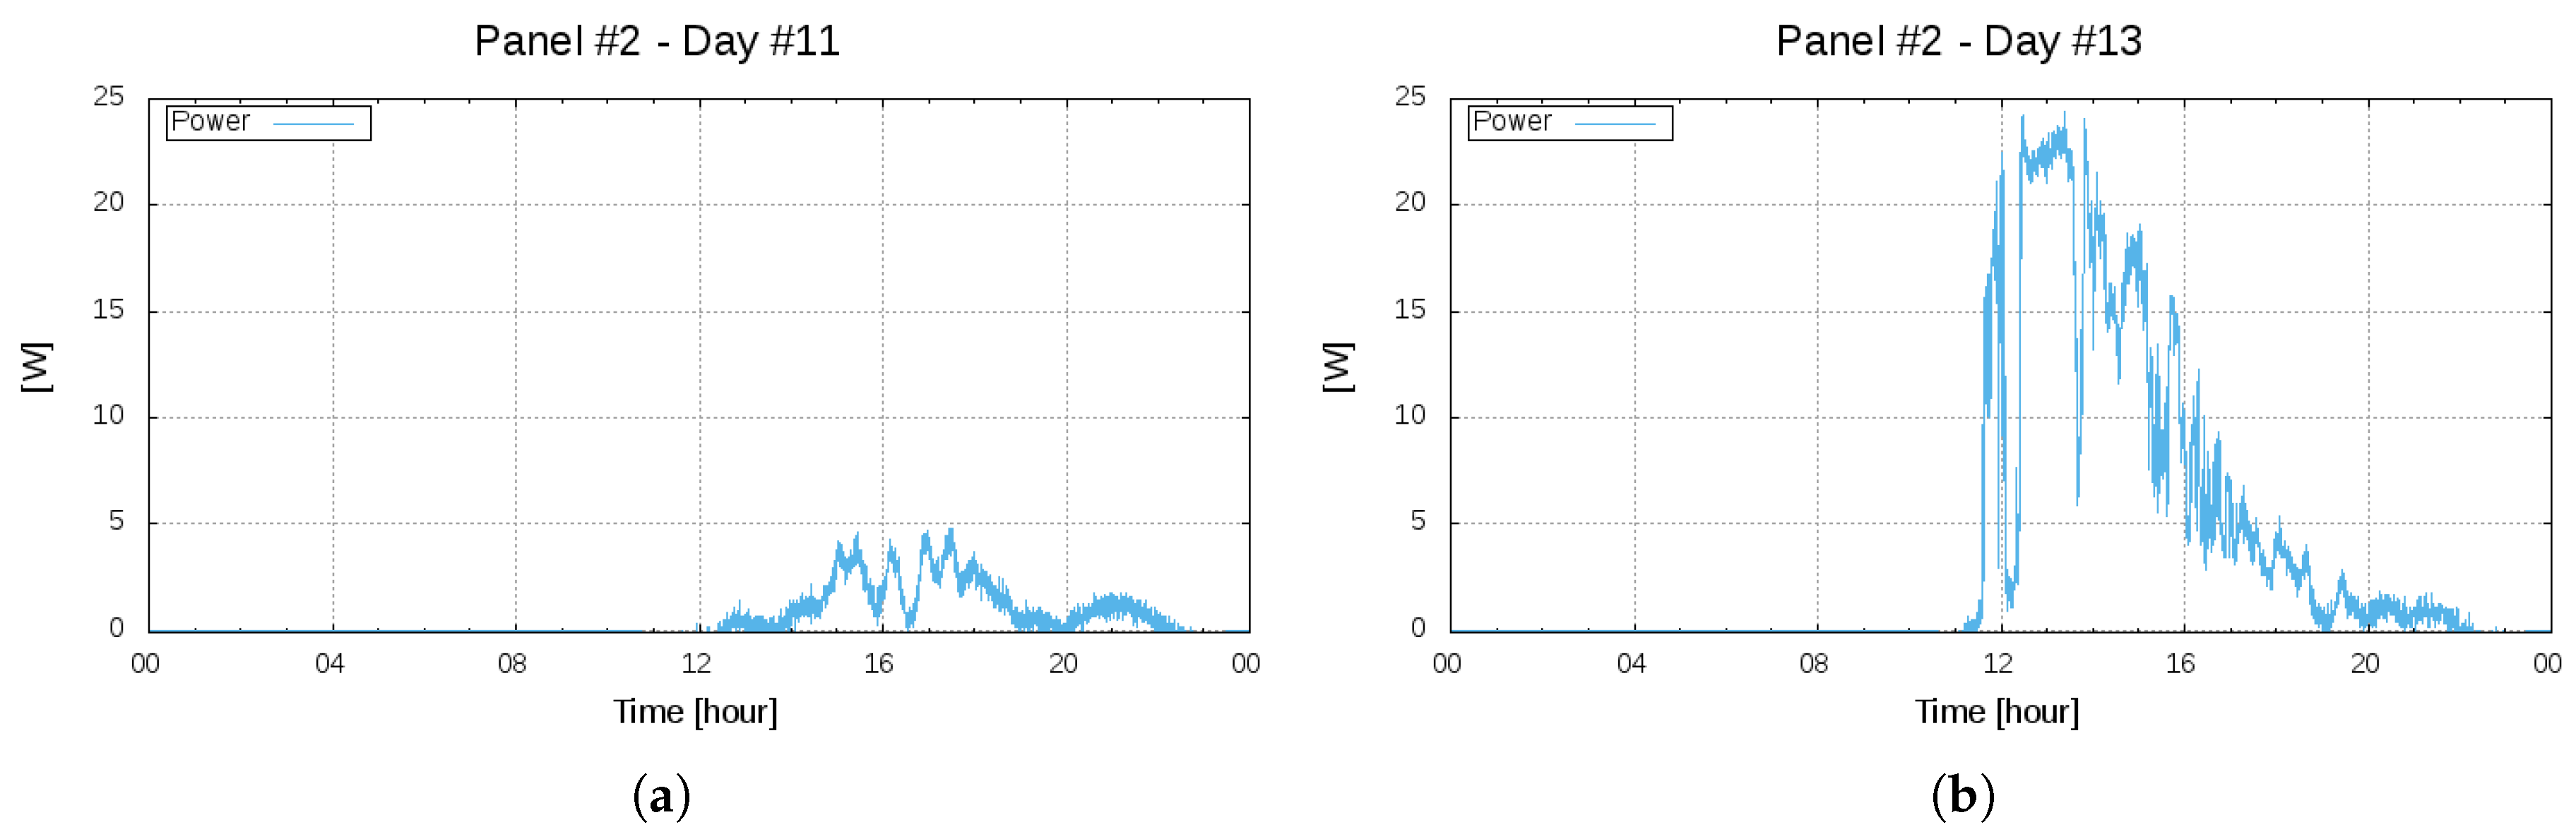
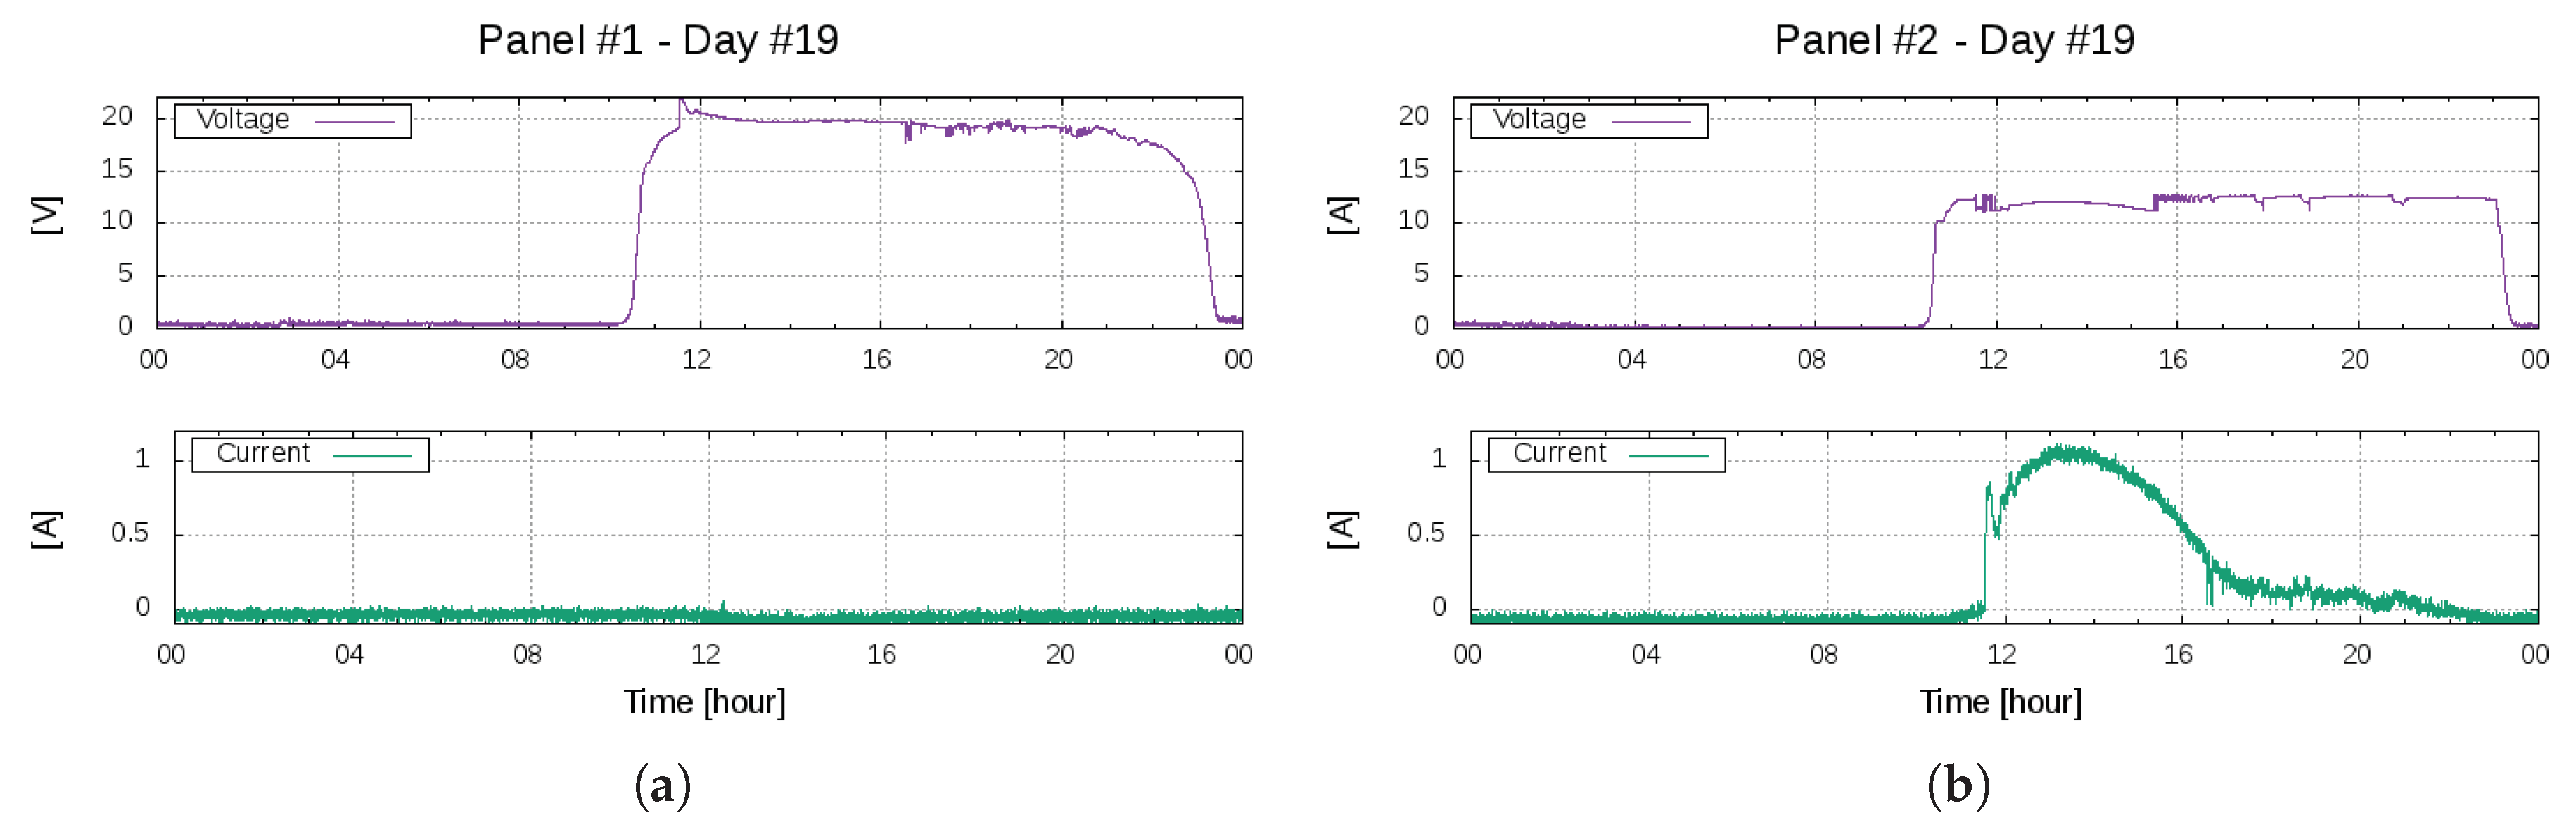
2.1.2. Difference between Cloudy Day and Sunny Day

To evaluate the behavior of the equipment in terms of different meteorological situations, a comparative analysis of the data was carried out between a sunny day and a cloudy day, with a 20-day experiment that allowed information to be recorded for different types of days.

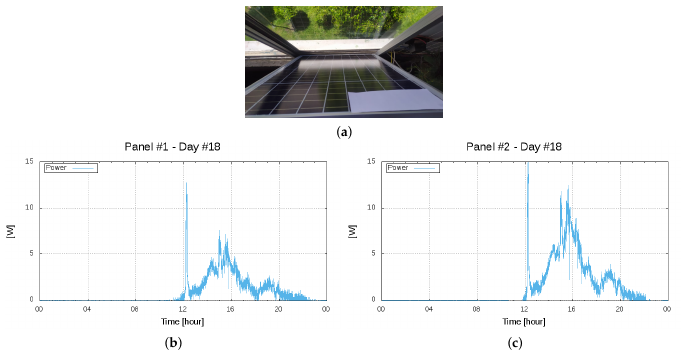
2.1.3. Partial Covering of Panel 1

To emulate common situations of a photovoltaic system, such as the appearance of shadows, obstacles, and possible damage in only one part of the panel, three different experiments were carried out where a partial obstruction of one of the panels was carried out, generating in the first and second experiments an obstruction of 50% of the surface of the panel vertically and horizontally and in the third test an obstacle on 10% of the solar panel surface. In this way, it was determined whether the device can detect when there are obstruction failures.

2.1.4. Emulating an Open Circuit

The last test consisted of emulating a fault situation when an open circuit occurs in the connections of the solar panels, for which the cable to the regulator of the first panel was disconnected to make a comparison between a panel in normal operation and one that was offline.

3. Results

This section presents the main results found after performing the four experiments indicated in the materials and methods section.

3.1. Amount of Messages Sent in 24 h

Some of the results obtained by this 14-day experiment are shown in Table 1; it was found that the team sends an average of 99.68% of the messages, which indicates good behavior as very little information is lost. On the other hand, on Day 9, a power failure was emulated, leaving the device out of operation for around 20 min, which verified the autonomy of the device, since, once the power was restored, it continued to send information to the database without any kind of external intervention.

3.2. Difference between Cloudy Day and Sunny Day

By making the daily graphs of the energy generated by the solar panels, it was possible to determine those days on which more energy was generated and that coincide with different meteorological situations. This behavior is shown in Figure 3, where on the left side is the graph generated for a cloudy day and on the right the energy generated on a sunny day. It should be noted that the data are stored in the virtual server according to Greenwich Mean Time, which is why there is a time lag due to the time zone (GMT-5) for Colombia. Another aspect to take into account is that the solar panels were located towards the east at an angle of 90 , thus only solar energy for the morning hours is used because, when the sun is at the zenith, there is no longer direct radiation incident on the solar panels.

3.3. Partial Covering of Panel 1

With this experiment, it was possible to find that having an obstacle on 50% of a panel will not generate energy since the obstructed photovoltaic cells cannot conduct the electrons since they behave as an open circuit. However, in the third experiment, where obstruction of 10% of the surface was carried out on one of the panels, it was found that it generated approximately 60% of the energy generated by the panel without obstructions. Figure 4 shows the obstruction generated and the comparison of the graph of energy generated by the two panels.
This experiment shows that solar panels are highly susceptible to shadows and obstructions that may arise, which can somehow interfere with the direct path of solar radiation and thus reduce the power generation capacity.

3.4. Emulating an Open Circuit

In Figure 5, the graphs obtained for this experiment are shown, where the current generated by the disconnected panel is zero. In addition, given the open circuit, the voltage increases to the maximum that it can deliver to the panel, resulting in higher voltage than Panel 2. On the other hand, Panel 2 shows a normal operation, with which it was possible to make an appropriate comparison and determine the behavior of the data when there are failures due to disconnections or the presence of an open circuit.

4. Conclusions

Through the validation tests of the device, it was possible to obtain data and graphs that represent the behavior of a solar power plant, where there is information on the daily behavior, showing changes when there are days with different meteorological situations such as cloudy or sunny.
The results show that different types of failures can be monitored. Besides, with an analysis of the data, through graphs or statistical methods, valuable information can be extracted, which can help to detect problems in a photovoltaic plant.
Given the proven functionalities of the system, the equipment can be used to monitor any process that involves measurement of physical variables, employing both analog and digital sensors, with which there is an implementation that can be compared with technological developments of companies dedicated to the design and sale of data acquisition systems, which have proprietary developments that generate high costs due to the payment of software licenses.
Thanks to the versatility of the device, it is possible to expand the modules for adding inputs and outputs according to the needs.

Conflicts of Interest

The authors declare no conflict of interest.

References

  1. Camacho-Olarte, J. Uso de Herramientas Libres para dise nar un Sistema de Monitoreo de Variables físicas de Bajo Costo Basado en Sistemas Embebidos; Universidad Nacional de Colombia: Bogotá, Colombia, 2020; p. 149. [Google Scholar]
  2. Sharma, S.; Jain, K.K.; Sharma, A. Solar Cells: In Research and Applications—A Review. Mater. Sci. Appl. 2015, 6, 1145–1155. [Google Scholar] [CrossRef]
  3. Raja Paul, M.M.; Mahalakshmi, R.; Karuppasamypandiyan, M.; Bhuvanesh, A.; Ganesh, R.J. Classification and Detection of Faults in Grid Connected Photovoltaic System. Int. J. Sci. Eng. Res. 2016, 7, 149–154. [Google Scholar]
  4. Bedi, G.; Venayagamoorthy, G.K.; Singh, R.; Brooks, R.R.; Wang, K. Review of Internet of Things (IoT) in Electric Power and Energy Systems. IEEE Internet Things J. 2018, 5, 847–870. [Google Scholar] [CrossRef]
  5. Shafique, K.; Khawaja, B.A.; Sabir, F.; Qazi, S.; Mustaqim, M. Internet of Things (IoT) for Next-Generation Smart Systems: A Review of Current Challenges, Future Trends and Prospects for Emerging 5G-IoT Scenarios. IEEE Access 2020, 8, 23022–23040. [Google Scholar] [CrossRef]
  6. Chernyshev, M.; Baig, Z.; Bello, O.; Zeadally, S. Internet of Things (IoT): Research, Simulators, and Testbeds. IEEE Internet Things J. 2018, 5, 1637–1647. [Google Scholar] [CrossRef]
  7. Acellent. Smarter Structures, Safer World. 2018. Available online: http://www.acellent.com/en/hardware/ (accessed on 2 October 2020).
  8. Mageba. Monitoreo Estructural. 2018. Available online: https://www.mageba-group.com/sk/data/docs/en_SK/2584/PROSPECT-ROBO-CONTROL-sytems-overview-ch-en.pdf?v=1.1 (accessed on 2 October 2020).
  9. Digitexx. Digitexx Software for Structural Health Monitoring. 2017. Available online: http://digitexx.website2.me/semi-permanent-to-permanent (accessed on 2 October 2020).
  10. Anand, A.; Krishna, A.; Tiwari, R.; Sharma, R. Comparative Analysis between Proprietary Software VS. In Open-Source Software VS. Free Software. In Proceedings of the 2018 Fifth International Conference on Parallel, Distributed and Grid Computing (PDGC), Solan Himachal Pradesh, India, 20–22 December 2018; pp. 144–147. [Google Scholar]
  11. Wang, Y.J. A Summary of Research on the Linux Operating System. In Advanced Materials Research; MEMS and Mechanics; Trans Tech Publications Ltd.: Stafa-Zurich, Switzerland, 2013; Volume 705, pp. 565–568. [Google Scholar] [CrossRef]
  12. Wolf, C.; Lasser, M. Project IceStorm. 2019. Available online: http://www.clifford.at/icestorm/ (accessed on 2 October 2020).
  13. Shah, D.; Hung, E.; Wolf, C.; Bazanski, S.; Gisselquist, D.; Milanovic, M. Yosys+nextpnr: An Open Source Framework from Verilog to Bitstream for Commercial FPGAs. In Proceedings of the 2019 IEEE 27th Annual International Symposium on Field-Programmable Custom Computing Machines (FCCM), San Diego, CA, USA, 28 April–1 May 2019; pp. 1–4. [Google Scholar] [CrossRef]
  14. Rath, D. Design and Implementation of an On-Chip Debug Solution for Embedded Target Systems Based on the ARM7 and ARM9 Family. Ph.D. Thesis, University of Applied Sciences Augsburg, Augsburg, Germany, 2005. [Google Scholar]
Figure 1. General diagram of the developed hardware.
Engproc 02 00025 g001
Figure 2. Real application for a photovoltaic plant: (a) device developed; (b) general diagram for a photovoltaic plant with DC loads; and (c) the connection between photovoltaic plant and developed device.
Engproc 02 00025 g002
Figure 3. Graphics for different weather situations: (a) cloudy day; and (b) sunny day.
Engproc 02 00025 g003
Figure 4. Ten percent obstruction on the solar panel surface: (a) panel photograph; (b) energy for covered panel; and (c) energy for uncovered panel.
Engproc 02 00025 g004
Figure 5. Graphics for open circuit: (a) unconnected panel; and (b) connected panel.
Engproc 02 00025 g005
Table 1. Number of daily messages saved in the database.
DayReceivedMissingRate
181961299.85%
382080100%
681288099.03%
9806114798.21%
148205399.96%
Publisher’s Note: MDPI stays neutral with regard to jurisdictional claims in published maps and institutional affiliations.

