Abstract
Dealing with complex engineering problems characterized by Big Data, particularly in structural engineering, has recently received considerable attention due to its high societal importance. Data-driven structural health monitoring (SHM) methods aim at assessing the structural state and detecting any adverse change caused by damage, so as to guarantee structural safety and serviceability. These methods rely on statistical pattern recognition, which provides opportunities to implement a long-term SHM strategy by processing measured vibration data. However, the successful implementation of the data-driven SHM strategies when Big Data are to be processed is still a challenging issue, since the procedures of feature extraction and/or feature classification may end up being time-consuming and complex. To enhance the current damage detection procedures, in this work we propose an unsupervised learning method based on time series analysis, deep learning and the Mahalanobis distance metric for feature extraction, dimensionality reduction and classification. The main novelty of this strategy is the simultaneous dealing with the significant issue of Big Data analytics for damage detection, and distinguishing damage states from the undamaged one in an unsupervised learning manner. Large-scale datasets relevant to a cable-stayed bridge have been handled to validate the effectiveness of the proposed data-driven approach. Results have shown that the approach is highly successful in detecting early damage, even when Big Data are to be processed.
1. Introduction
Structural health monitoring (SHM) is a necessity for today’s society, in order to preserve valuable and important civil structures and guarantee their health and integrity to avoid human and economic losses [1,2]. Due to recent advances in sensing and data acquisition systems, the processing of raw measured data by the SHM system is not a major challenge. On this basis, data-driven methods have received increasing attention among civil engineers and researchers for monitoring civil structures [3].
The central core of all these methods relies upon statistical pattern recognition, and comprises feature extraction and feature classification. The former step is a signal processing strategy, which aims at extracting meaningful information (here called damage-sensitive features) from raw measured data (e.g., acceleration time histories), while the latter is a machine learning algorithm for analyzing and classifying the extracted features for early damage detection, localization and quantification [4,5,6,7]. Time series modeling is one of the powerful feature extraction methods, which is intended to fit a parametric representation (model) to raw measured data [8,9]. Coefficient-based and residual-based algorithms are two different feature extraction methods via time series modeling. Although the outputs (features) of the residual-based algorithm are high dimensional, the relevant methodology proves to be more efficient than the coefficient-based one by avoiding order determination and parameter estimation of the measured vibrations related to the current (possibly damaged) conditions [4]. Furthermore, novelty detection based on unsupervised learning, which is to be contrasted with supervised learning [10,11], is an influential method for feature classification. Statistical distances [4,12,13,14], clustering algorithms [15] and artificial neural networks [16] are popular tools for developing novelty detectors for SHM.
Despite various effective data-driven methods, the presence of large volumes of vibration measurements (Big Data) may bring time-consuming and cumbersome algorithms for decision making into the procedure [2]. To deal with this issue, Vitola et al. [17] presented a statistical pattern recognition method based on multivariate analysis, sensor data fusion and machine learning for damage detection from a large volume of data acquired from distributed piezoelectric sensors. A machine learning algorithm featuring cross correlation and robust regression analyses was presented by Catbas and Malekzadeh [18] to detect damage and deal with the problem of Big Data collected from the mechanical components of movable bridges. Big Data analytics was performed by Kim and Queiroz [19] for the condition evaluation of highway bridges by considering roughly one million data samples. Yao et al. [20] presented an iterative spatial compressive sensing scheme for damage identification and localization by handling the Big Data problem.
Departing from the previously mentioned cited works, the main objective of this paper is to propose an unsupervised learning method for early damage detection via time series analysis for feature extraction through an AutoRegressive Moving Average (ARMA) model, a deep autoencoder neural network for dimensionality reduction and the Mahalanobis distance metric for feature classification. In this method, large volumes of the high-dimensional ARMA residuals, extracted from the vibration responses of a structure featuring either a normal or damaged condition, are fed into an autoencoder so as to extract the outputs of the bottleneck layer as representative, low-dimensional features. The Mahalanobis distance is then used to measure the dissimilarities between the training and test data sets obtained from the low-dimensional features. The effectiveness and performance of the proposed method are verified by a large-scale bridge. Obtained results demonstrate that the method is successful in detecting early damage, while still very efficiently dealing with the problem of Big Data.
2. Methodology
2.1. Feature Extraction by ARMA Modeling
Time series analysis via ARMA modeling has emerged as an effective approach to extract damage-sensitive features from structural responses to ambient vibrations [8]. ARMA, as an extension of the AR representation, is an output-only time-invariant linear model [21]. Given a vibration response y(t) at time t, the model is given by
where the first and second terms at the right-hand side respectively refer to the AR (output) and MA (error) terms of the whole model. In Equation (1): p and q are the model orders; φ1, …, φp and ψ1, …, ψq are the coefficients of the AR and MA terms; and e(t) is the residual at time t, which represents the difference between the measured and predicted responses. For SHM purposes, the AR coefficients and the model residuals are used as damage-sensitive features; more details of the process of feature extraction by ARMA modeling can be found in [8].
2.2. Dimensionality Reduction by a Deep Autoencoder
Deep learning is a relatively new method in the field of machine learning, which exploits the enhanced approximation/mimicking capabilities of deep neural networks [16]. If this technique is allowed for within an autoencoder, it shows the major feature of working in an unsupervised fashion: the neural network thus aims at learning a new representation of data by trying to reconstruct the inputs [22]. An autoencoder is comprised of two phases: encoding the input data into a lower-dimensional space; and decoding of the compressed representation back to the original space. The deep autoencoder minimizes the difference between its input and output, via a cost function L that is defined in the following form
where X∈ℝm×n denotes the input, i.e., the initial feature samples relevant to the normal structural condition as obtained from time series modeling; and ∈ℝm×n is the reconstruction of X, which is defined as the network output. As well as the input and output layers, a deep autoencoder includes several hidden layers. The central hidden layer is called the bottleneck, as it has the minimum number of neurons among all the hidden layers; this layer plays a crucial role in the problem of dimensionality reduction [23]. In this study, a deep autoencoder with seven hidden layers has been designed, to extract the outputs of the bottleneck layer as the low-dimensional system features.
In deep learning, the selection of the numbers of hidden layers and neurons is a crux. Having set for the deep autoencoder the number of hidden layers, the optimization of the number of neurons of each layer can be carried out by means of the final prediction error (FPE) function [24]. Given the neuron numbers of the hidden layers h1–h7, this function is written as follows:
In this equation: β = Nw/N, where N = n × m; Nw = ((m + h4 + 1)) + (m + h4); h4 denotes the number of neurons of the bottleneck layer; and α = E/2N is an average sum of squared errors, where the sum-squared-error E is given by:
By continuously varying the values of h1–h7, those featuring the smallest FPE results were the most appropriate, problem-dependent choice. The input matrix X is thus fed into the deep neural network to extract the low-dimensional outputs Bx∈ℝm×f of the bottleneck layer, where f≪n. The same process is repeated for the feature matrix Z∈ℝm×n for the current state, in order to extract the corresponding low-dimensional outputs Bz∈ℝm×f of the bottleneck layer.
2.3. Feature Classification by Mahalanobis Distance Metric
To finally compare the damage-sensitive features relevant to the undamaged state, namely the baseline, and to the current state, a distance metric must be introduced. The Mahalanobis distance is a statistical tool for computing the dissimilarity between two multivariate datasets, or matrices [12]. If the feature matrices X and Z are handled in the distance calculation, the procedure may result in being time-consuming and cumbersome, as they are high-dimensional features. If the low-dimensional matrices Bx and Bz are handled instead, the Mahalanobis distance can turn out to be far more efficient.
For this purpose, it is necessary to generate the training and test sets Tx and Tz from Bx and Bz in the training and inspection phases [12]. Subsequently, the mean vector (vx) and the covariance matrix (Cx) are computed for the training set Tx, so as to measure the dissimilarity of each vector (tz) of the matrix Tz from these components in the following form:
3. Performance Validation
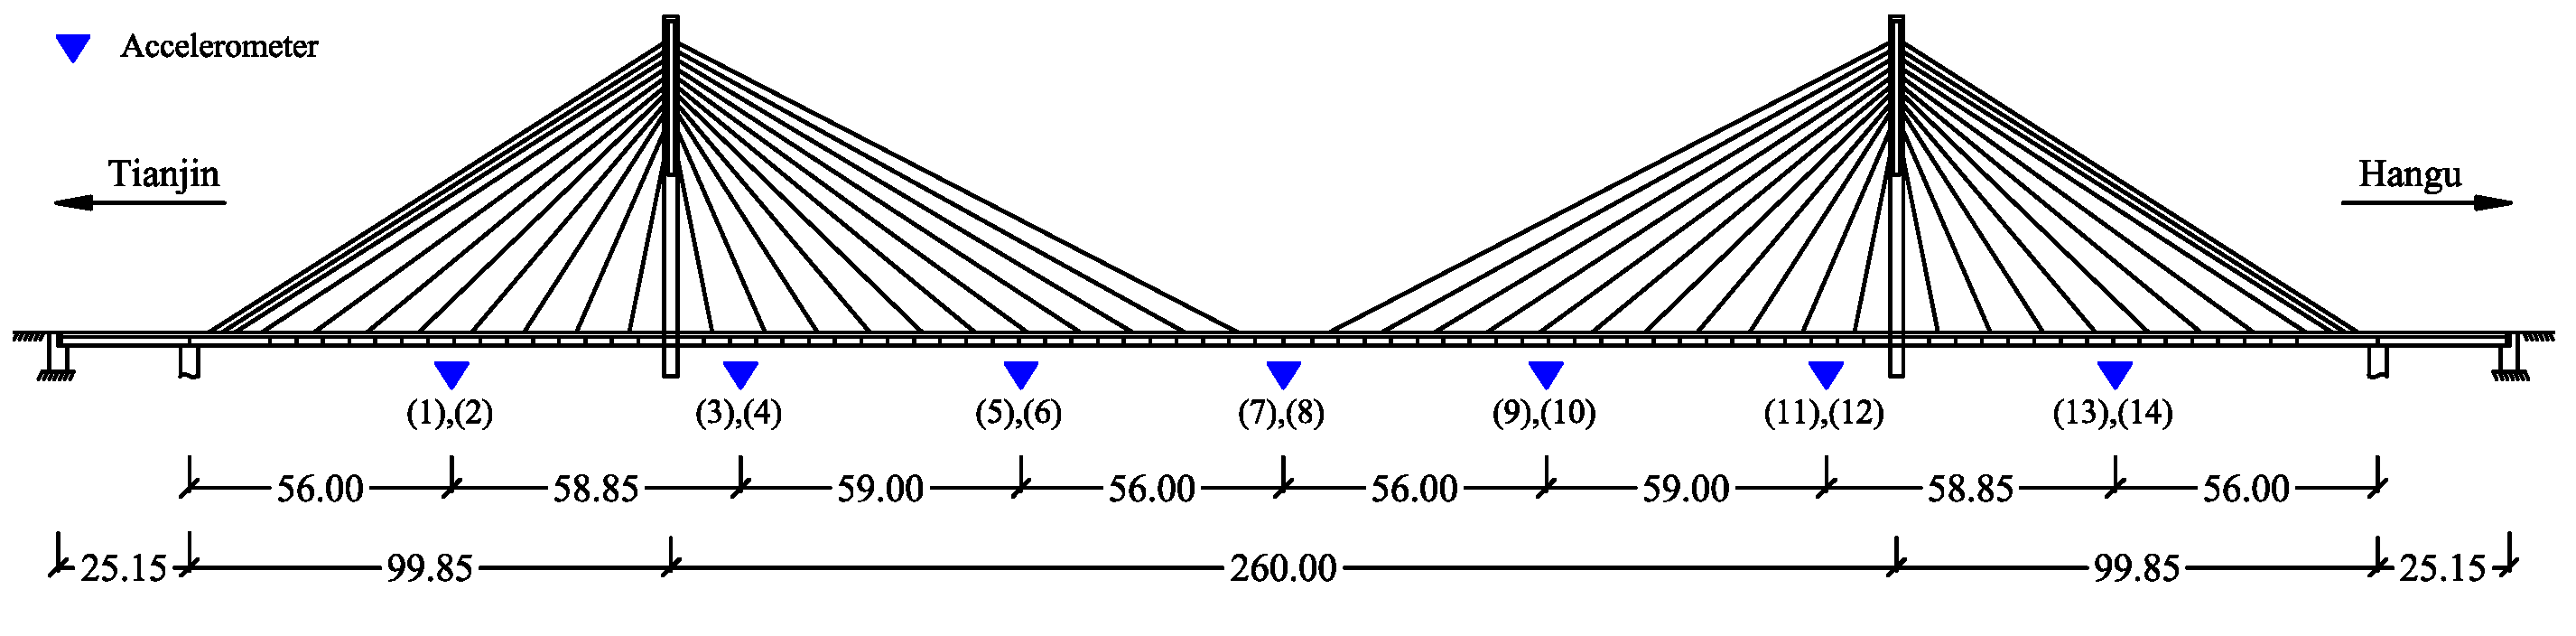
The vibration datasets of the Tianjin-Yonghe Bridge [25] have been used to assess the performance of the proposed method. This is one of the earliest cable-stayed bridges constructed in Mainland China. The bridge consists of a main span of 260 m, and two side spans of 25.15 m and 99.85 m, see Figure 1. After 19 years of operation from 1987, some cracks and corrosion in some stayed cables were discovered. An SHM system was then designed to measure and monitor the bridge vibrations after a major rehabilitation program; however, new damage patterns were found in the girders during a routine inspection in August 2008. In the meantime, acceleration time histories were measured by 14 single-axis accelerometers deployed, as shown in Figure 1, for 12 days (1 January, 17 January, 3 February, 19 March, 30 March, 9 April, 5 May, 18 May, 31 May, 7 June, 16 June and 31 July, 2008).
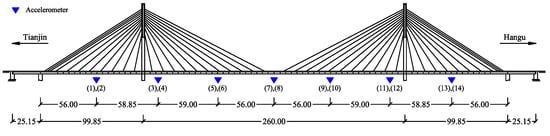
Figure 1.
Sketch of the Tianjin-Yonghe Bridge, with sensor labels and deployment.
The measured vibration data for each day consisted of 24 sets of one-hour measurements with a sampling frequency of 100 Hz, yielding 360,000 acceleration samples at each sensor location. Measurements collected by sensor #10 have been considered to provide meaningless information, while the datasets of 31 May, 7 June and 16 June have been disregarded due to the resulting weak excitations; accordingly, in this study the measurements gathered by 13 accelerometers during the first eight days and 31 July have been allowed for. In such cases, it has only been assumed that the bridge was undamaged on the first eight days, and damaged on the last [25]. Considering all the acceleration responses along the 24 test measurements, the data samples for feature extraction amount to 1,010,880,000, producing a huge volume of high-dimensional sets (Big Data). In this regard, the variable m and n are set to 312 and 360,000, where 312 = 24 × 13.
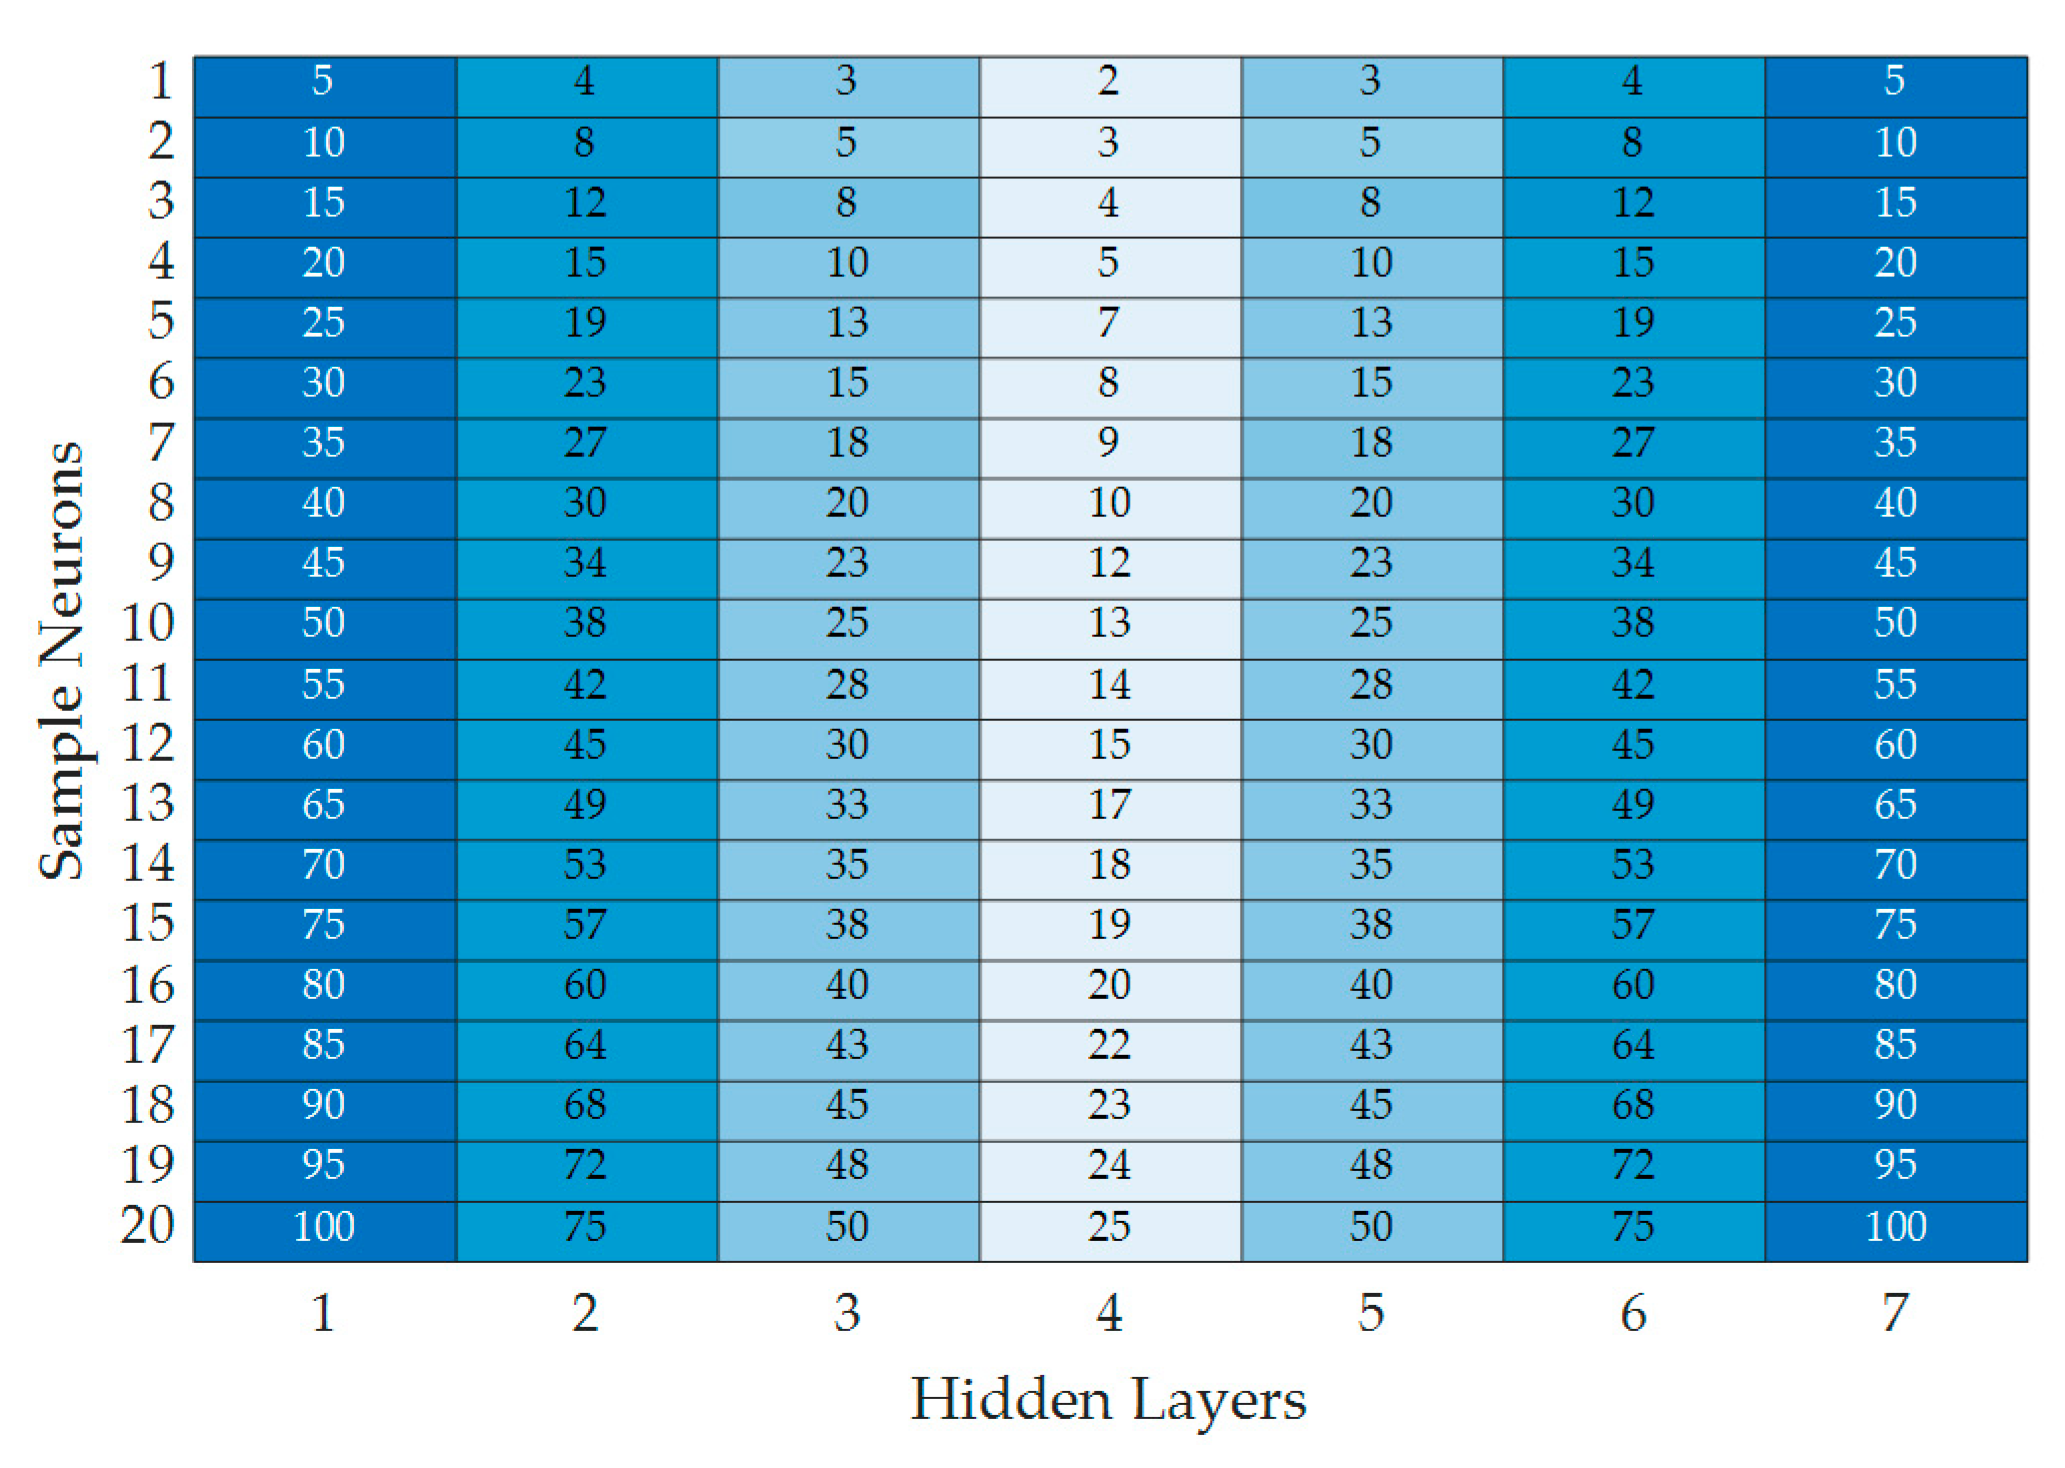
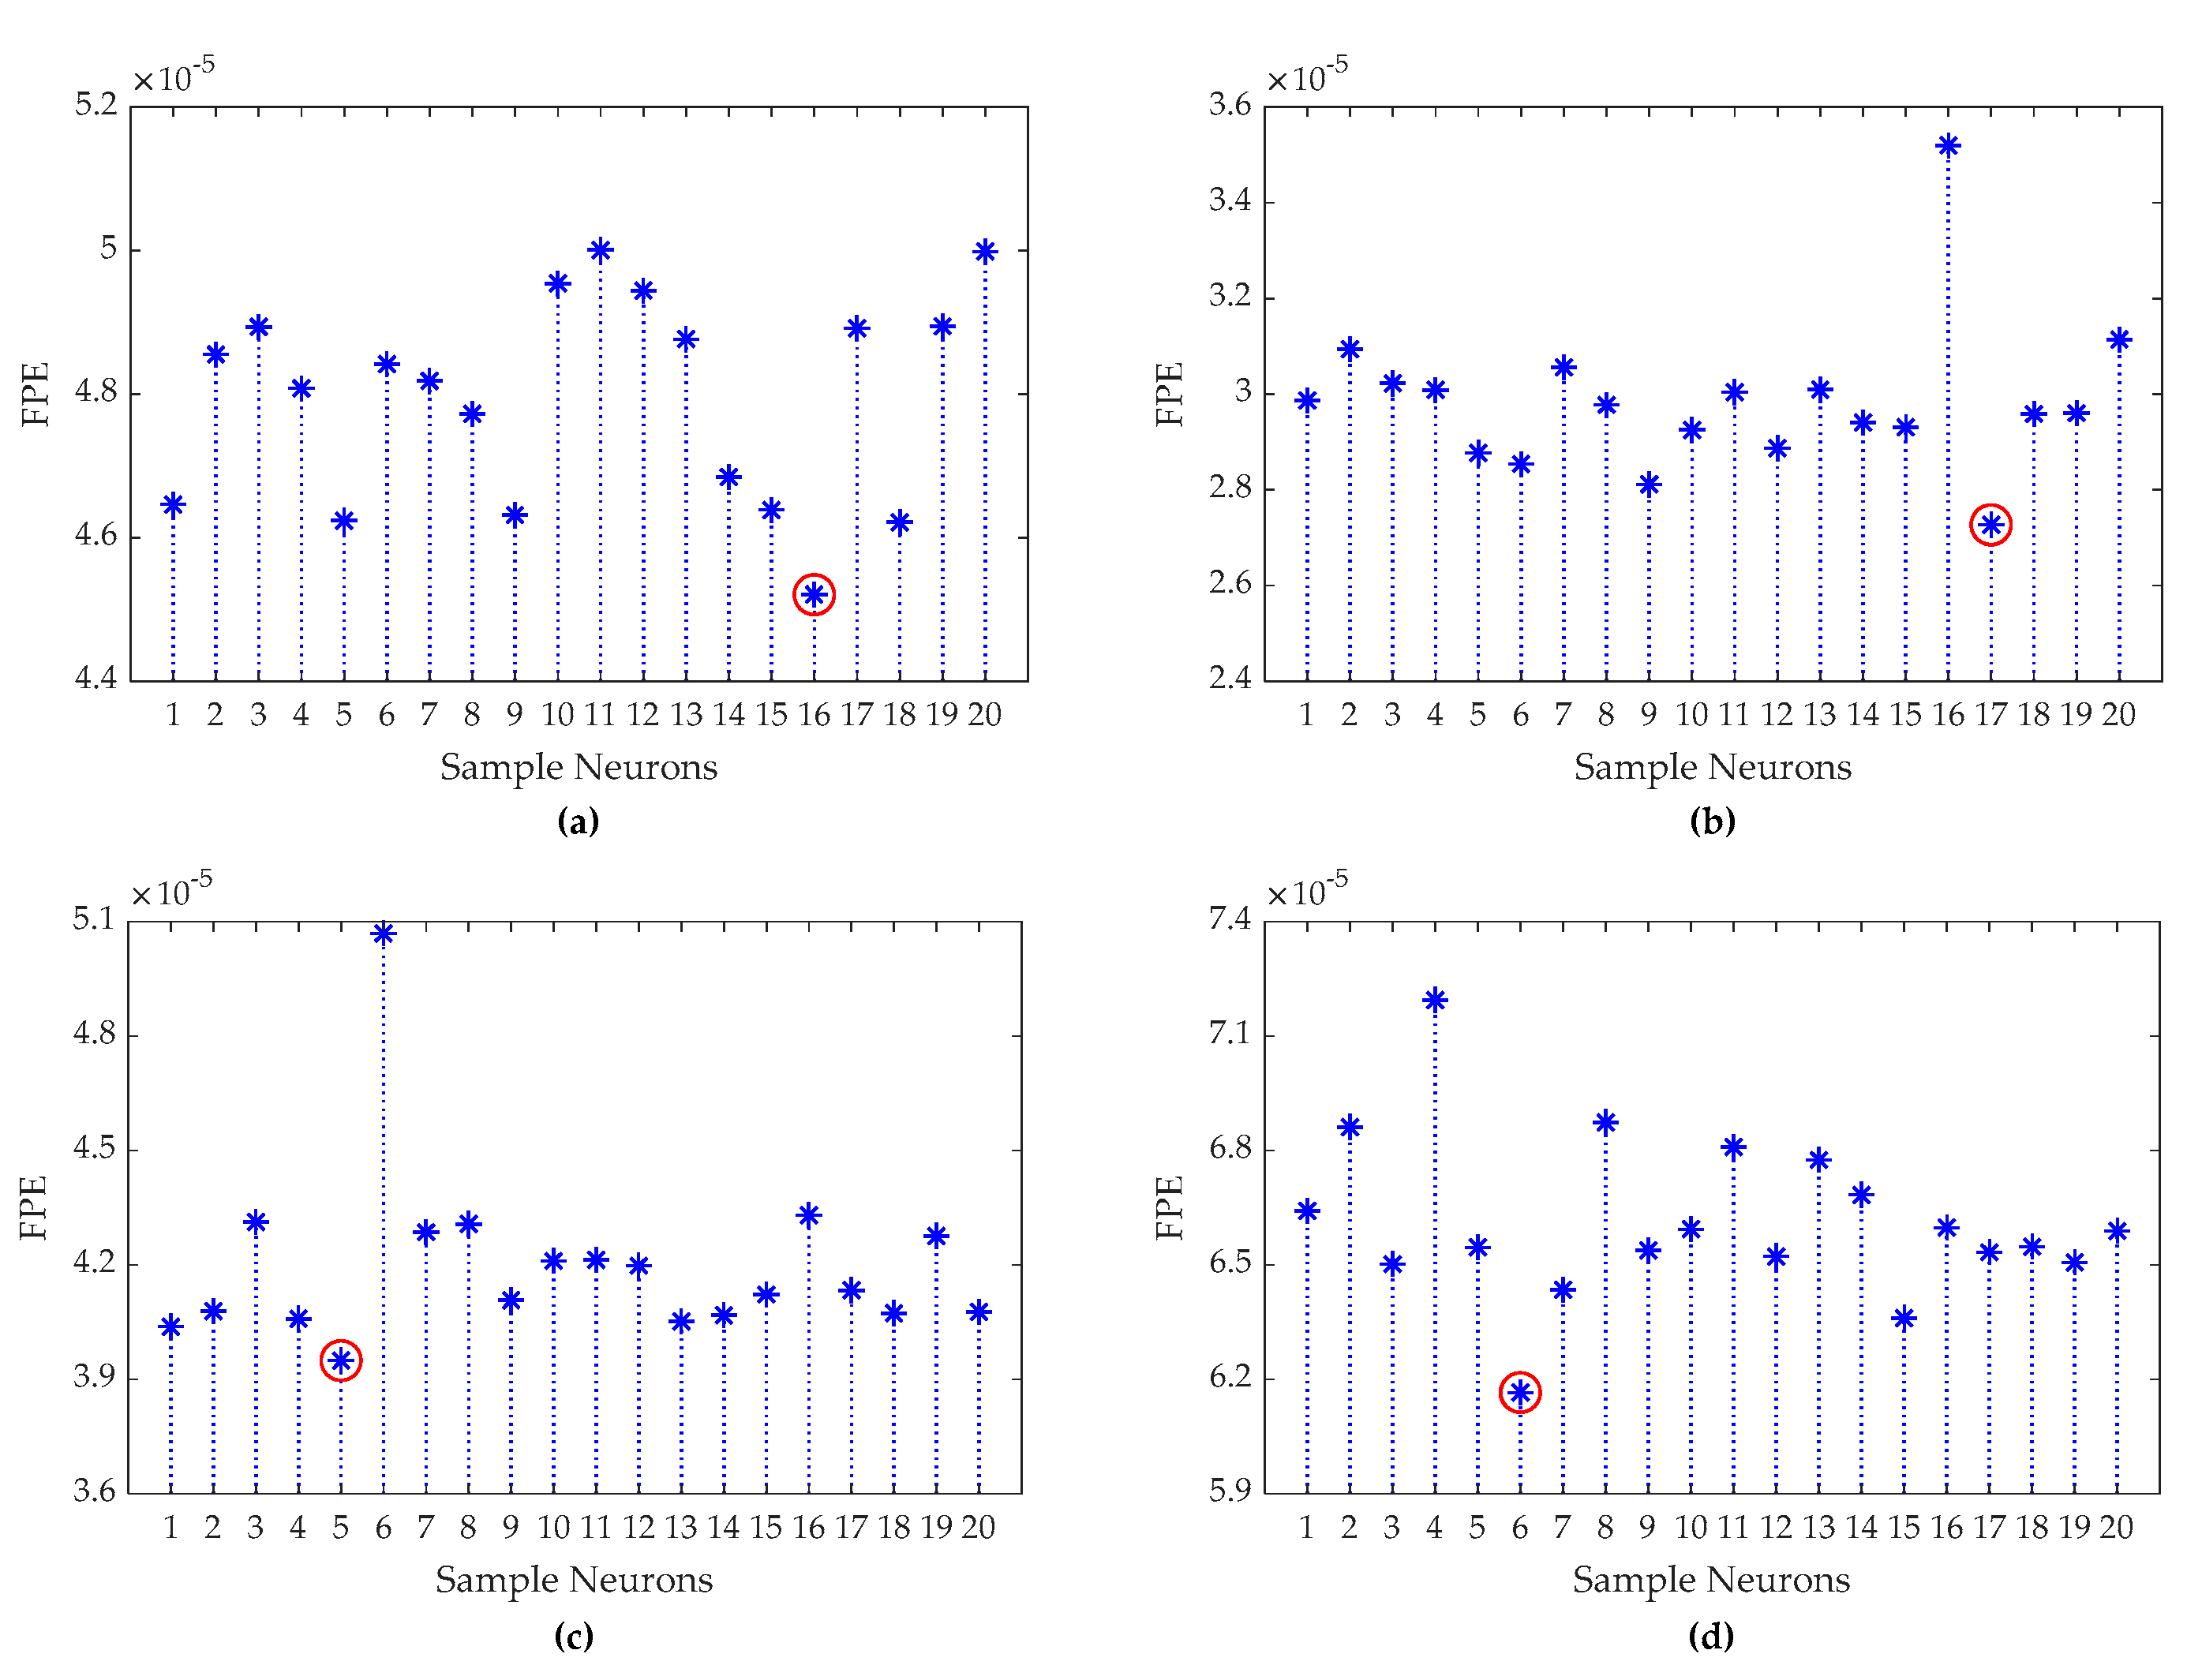
For the process of feature extraction by ARMA modeling, the model orders p and q must be defined. The orders have been obtained by using the Bayesian information criterion (BIC) [21]. Next, the coefficients of the AR and MA terms have been estimated by minimizing the model residuals. Referring to Section 2, the matrices X∈ℝ312×360,000 and Z∈ℝ312×360,000 represent the residual sets of the bridge in the normal and damaged conditions, respectively. To obtain the low-dimensional feature sets, Bx and Bz, Figure 2 provides the optimal sample neurons of the hidden layers 1–7; via the FPE function, the most appropriate neurons for each layer have been determined. Figure 3 depicts the best sample neuron for the residual matrices, which obviously varies in time even for normal conditions only. In the figure, the red circles depict the best number of neurons of the hidden layers; for example, the smallest FPE value in Figure 3a has been obtained for sample 16, which means that the proper numbers for h1–h7 turn out to be 80, 60, 40, 20, 40, 60 and 80, respectively.

Figure 2.
Sample neurons of the hidden layers of the proposed deep autoencoder.
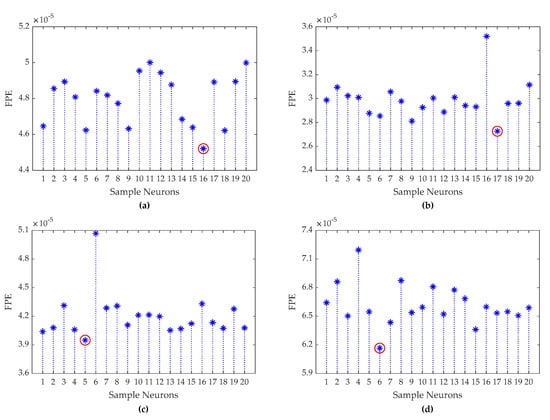
Figure 3.
Variation of the final prediction error (FPE) with the sample, to optimize the selection of the neuron size of hidden layers of the deep autoencoder on: (a) 1 January; (b) 3 February; (c) 30 March; and (d) 5 May.
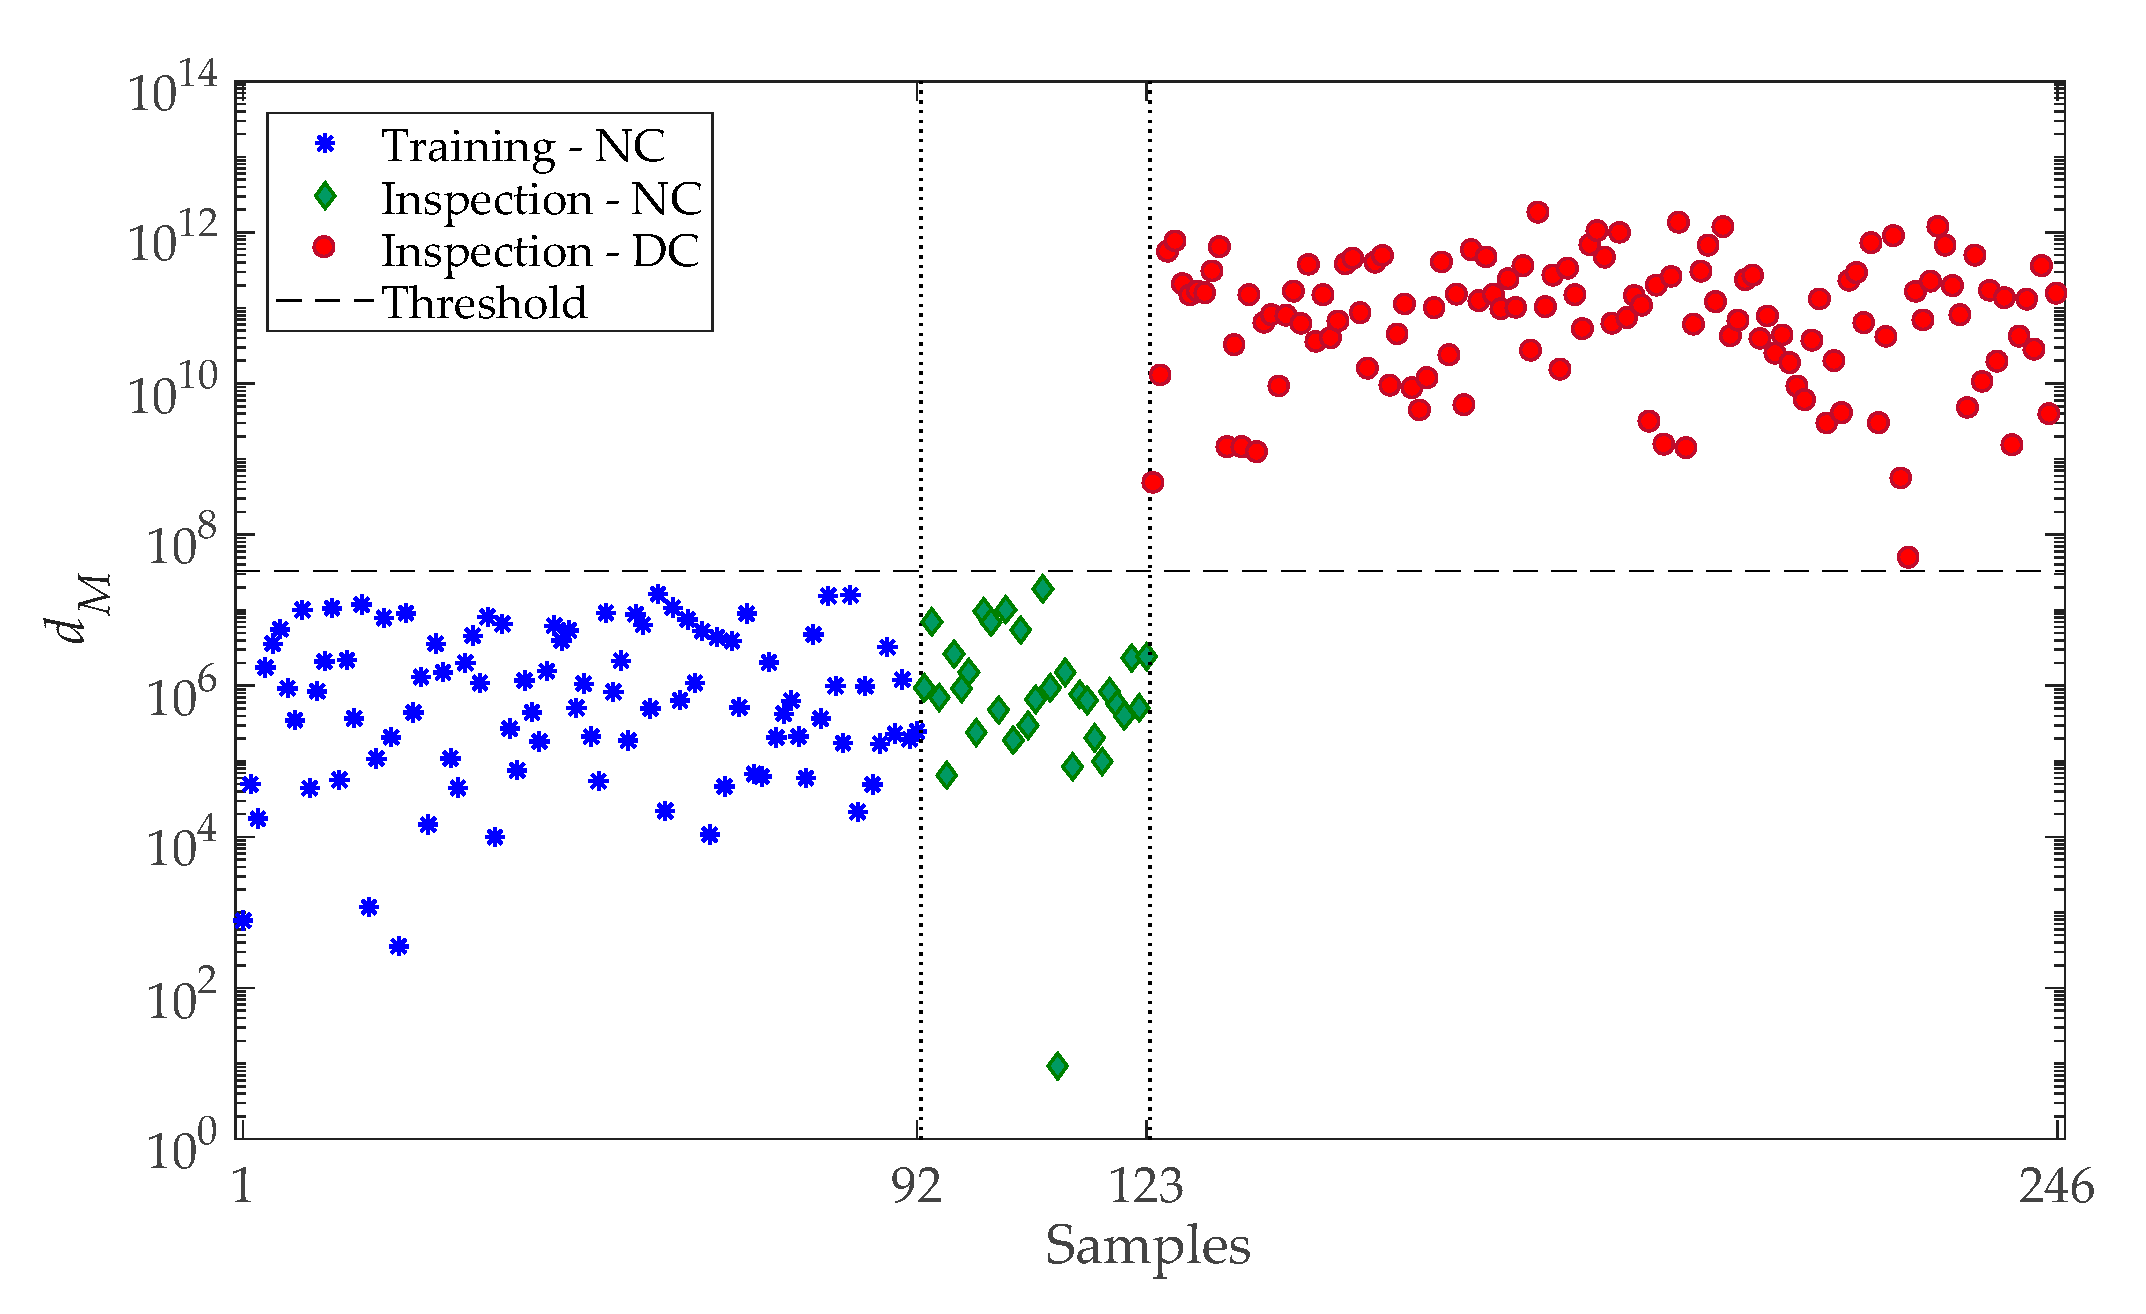
Extracting the outputs at the bottleneck layers for all the nine days of the monitoring has provided the matrices Bx∈ℝ312×123 and Bz∈ℝ312×123, which are used to generate the training and test data sets. As customarily assumed, 75% of the samples in Bx have been considered to obtain the training matrix Tx∈ℝ312×92; the remaining 25% of the samples in Bx and all the samples in Bz have instead provided the test matrix Tx∈ℝ312×154. Figure 4 illustrates the result of early damage detection via the Mahalanobis distance, where the first 123 samples are related to the normal condition of the bridge and the second 123 samples belong to the damaged state; the distance values regarding samples 1–92 pertain to normal conditions in the training phase. These results have been obtained by handling each of the vectors (tx) of the training matrix in Equation (5), to estimate the threshold value as the horizontal dashed line in Figure 4, which is based on the generalized extreme value distribution and block maxima technique [10,12]. The distance quantities relevant to samples 93–123 refer to the same normal conditions, but used as validation data.
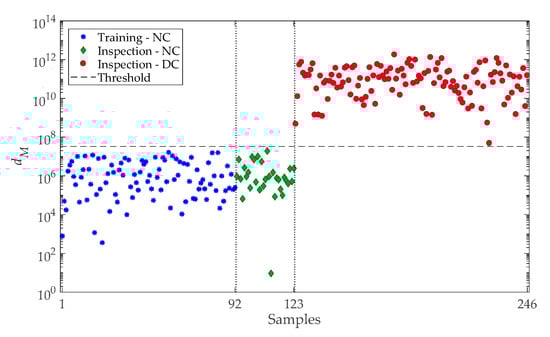
Figure 4.
Early damage detection by exploiting the low-dimensional features: variation in time of the Mahalanobis distance.
From Figure 4, it is clear that all distance values related to normal conditions, in both the training and inspection phases, fall below the threshold limit. For the other way around, all the distance values related to samples 124–246 exceed the threshold, implying an accurate detection of damage. The great advantage of the proposed method is to make a decision using only the 246 distance values, rather than the total 360,000 data points. Therefore, one can conclude that this method not only yields accurate damage detection outcomes, but also provides low-dimensional features and outputs for decision-making.
4. Conclusions
This work has proposed an unsupervised learning method based on three main steps: feature extraction by ARMA modeling; dimensionality reduction by a deep autoencoder; and feature classification via the Mahalanobis distance metric. The large volumes of vibration measurements regarding a large-scale cable-stayed bridge have been used to assess the performance of the proposed method. The results have shown that this method is able to accurately detect damage by means of the low-dimensional features obtained from the bottleneck layer of a deep autoencoder with seven hidden layers. It has been also shown that the neuron size selection via the FPE function is an appropriate tool for hyperparameter estimation in deep learning, due to the good results obtained in terms of damage detection.
References
- Ahmed, H.; La, H.M.; Gucunski, N. Review of non-destructive civil infrastructure evaluation for bridges: State-of-the-art robotic platforms, sensors and algorithms. Sensors 2020, 20, 3954. [Google Scholar] [CrossRef] [PubMed]
- Sun, L.; Shang, Z.; Xia, Y.; Bhowmick, S.; Nagarajaiah, S. Review of Bridge Structural Health Monitoring Aided by Big Data and Artificial Intelligence: From Condition Assessment to Damage Detection. J. Struct. Eng. 2020, 146, 04020073. [Google Scholar] [CrossRef]
- Burgos, D.A.T.; Vargas, R.C.G.; Pedraza, C.; Agis, D.; Pozo, F. Damage identification in structural health monitoring: A brief review from its implementation to the use of data-driven applications. Sensors 2020, 20, 733. [Google Scholar] [CrossRef] [PubMed]
- Entezami, A.; Shariatmadar, H.; Mariani, S. Fast unsupervised learning methods for structural health monitoring with large vibration data from dense sensor networks. Struct. Health Monit. 2020, 19, 1685–1710. [Google Scholar] [CrossRef]
- Entezami, A.; Shariatmadar, H. An unsupervised learning approach by novel damage indices in structural health monitoring for damage localization and quantification. Struct. Health Monit. 2017, 17, 325–345. [Google Scholar] [CrossRef]
- Entezami, A.; Shariatmadar, H.; Mariani, S. Structural Health Monitoring for Condition Assessment Using Efficient Supervised Learning Techniques. Proceedings 2020, 42, 17. [Google Scholar]
- Sarmadi, H.; Entezami, A.; Daneshvar Khorram, M. Energy-based damage localization under ambient vibration and non-stationary signals by ensemble empirical mode decomposition and Mahalanobis-squared distance. J. Vib. Control 2019, 26, 1012–1027. [Google Scholar] [CrossRef]
- Entezami, A.; Sarmadi, H.; Behkamal, B.; Mariani, S. Big Data Analytics and Structural Health Monitoring: A Statistical Pattern Recognition-Based Approach. Sensors 2020, 20, 2328. [Google Scholar] [CrossRef]
- Mei, L.; Li, H.; Zhou, Y.; Li, D.; Long, W.; Xing, F. Output-Only Damage Detection of Shear Building Structures Using an Autoregressive Model-Enhanced Optimal Subpattern Assignment Metric. Sensors 2020, 20, 2050. [Google Scholar] [CrossRef]
- Sarmadi, H.; Entezami, A. Application of supervised learning to validation of damage detection. Arch. Appl. Mech. 2020, in press. [Google Scholar] [CrossRef]
- Entezami, A.; Shariatmadar, H.; Mariani, S. Early damage assessment in large-scale structures by innovative statistical pattern recognition methods based on time series modeling and novelty detection. Adv. Eng. Softw. 2020, 150, 102923. [Google Scholar] [CrossRef]
- Sarmadi, H.; Karamodin, A. A novel anomaly detection method based on adaptive Mahalanobis-squared distance and one-class kNN rule for structural health monitoring under environmental effects. Mech. Syst. Signal Process. 2020, 140, 106495. [Google Scholar] [CrossRef]
- Entezami, A.; Shariatmadar, H. Structural health monitoring by a new hybrid feature extraction and dynamic time warping methods under ambient vibration and non-stationary signals. Measurement 2019, 134, 548–568. [Google Scholar] [CrossRef]
- Entezami, A.; Shariatmadar, H. Damage localization under ambient excitations and non-stationary vibration signals by a new hybrid algorithm for feature extraction and multivariate distance correlation methods. Struct. Health Monit. 2019, 18, 347–375. [Google Scholar] [CrossRef]
- Entezami, A.; Sarmadi, H.; Saeedi Razavi, B. An innovative hybrid strategy for structural health monitoring by modal flexibility and clustering methods. J. Civ. Struct. Health Monit. 2020, 10, 845–859. [Google Scholar] [CrossRef]
- Azimi, M.; Eslamlou, A.D.; Pekcan, G. Data-driven structural health monitoring and damage detection through deep learning: State-of-the-art review. Sensors 2020, 20, 2778. [Google Scholar] [CrossRef]
- Vitola, J.; Pozo, F.; Tibaduiza, D.A.; Anaya, M. Distributed Piezoelectric Sensor System for Damage Identification in Structures Subjected to Temperature Changes. Sensors 2017, 17, 1252. [Google Scholar] [CrossRef]
- Catbas, F.N.; Malekzadeh, M. A machine learning-based algorithm for processing massive data collected from the mechanical components of movable bridges. Autom. Constr. 2016, 72, 269–278. [Google Scholar] [CrossRef]
- Kim, Y.J.; Queiroz, L.B. Big Data for condition evaluation of constructed bridges. Eng. Struct. 2017, 141, 217–227. [Google Scholar] [CrossRef]
- Yao, R.; Pakzad, S.N.; Venkitasubramaniam, P. Compressive sensing based structural damage detection and localization using theoretical and metaheuristic statistics. Struct. Control Health Monit. 2017, 24, e1881. [Google Scholar] [CrossRef]
- Bisgaard, S.; Kulahci, M. Time Series Analysis and Forecasting by Example; John Wiley & Sons: Hoboken, NJ, USA, 2011. [Google Scholar]
- Goodfellow, I.; Bengio, Y.; Courville, A. Deep Learning; MIT Press: Cambridge, MA, USA, 2016. [Google Scholar]
- Shang, Z.; Sun, L.; Xia, Y.; Zhang, W. Vibration-based damage detection for bridges by deep convolutional denoising autoencoder. Struct. Health Monit. 2020, 1475921720942836. [Google Scholar] [CrossRef]
- Kramer, M.A. Nonlinear principal component analysis using autoassociative neural networks. AICHE J. 1991, 37, 233–243. [Google Scholar] [CrossRef]
- Li, S.; Li, H.; Liu, Y.; Lan, C.; Zhou, W.; Ou, J. SMC structural health monitoring benchmark problem using monitored data from an actual cable-stayed bridge. Struct. Control Health Monit. 2014, 21, 156–172. [Google Scholar] [CrossRef]
Publisher’s Note: MDPI stays neutral with regard to jurisdictional claims in published maps and institutional affiliations. |
© 2020 by the authors. Licensee MDPI, Basel, Switzerland. This article is an open access article distributed under the terms and conditions of the Creative Commons Attribution (CC BY) license (https://creativecommons.org/licenses/by/4.0/).