1. Introduction
The current ecological and environmental situation has led to an international awareness of greenhouse gas emissions. Renewable and natural energy sources have been widely used and developed over the last 20 years. The production of electrical energy from photovoltaic energy in territories with a high solar potential has increased considerably. As Reunion Island is located in a tropical zone with a high annual productivity (1314 h of full-power equivalent in 2019 [
1]), the energy policy of France and of the island encourages the development of photovoltaic solar energy. In this context, the production of electrical energy by photovoltaic means has increased from 0 to 206.3 MW in 15 years [
1] in order to counter the massive importation of fossil fuels. As a non-interconnected grid territory, the Reunion Island grid is prone to instability due to strong variations in intermittent energy production. Thereby, maintenance and forecasting of photovoltaic production are necessary. The tropical conditions induce an increase in faults and premature aging of photovoltaic systems [
2]. Moreover, the photovoltaic park in Reunion Island includes a wide range of sizes of power plants. There is a large proportion of small installations (62.66% of the number of photovoltaic plants are below 9 kVA), which are unequally equipped for diagnosis and fault detection.
The DETECT project aims to implement innovative technical solutions to detect, isolate, and identify faults that may lead to failures. These solutions allow improvement of the energy efficiency of PV systems by anticipating maintenance operations. The deployment of these solutions on a large scale relies on the use of low-cost technologies, allowing the implementation of diagnostic modules while limiting the installation of additional sensors in situ. The objective of the project is to develop distributed technical solutions to analyze the health status of hybrid systems, in particular PV systems, installed in humid tropical environments such as Reunion Island. The innovative character of this project is based on several elements:
development of a diagnostic system based on the electrical signals available on the photovoltaic installations (voltage, current, and power),
real-time diagnosis without system interruption,
facilitation of the deployment of these solutions by promoting low-cost technologies.
2. Method Presentation
When a fault occurs, symptoms will appear in the PV system, the behavior of the voltage or current curves can be affected in a more or less visible way [
3]. Advanced diagnosis methods collect the information available on the production site and process it in order to highlight the characteristic behavior, i.e., the fault symptoms.
The development of a diagnosis method consists of three steps:
identification of measured variables that are sensitive to faults,
selection of the most suitable tool to highlight the symptoms (data processing),
interpretation of the symptoms in order to make a diagnosis.
In order to meet the constraints of the DETECT project, the following options are retained:
permanent shading, hotspots, and bypass diode faults will be studied,
the input variables of the diagnostic method are current and voltage collected by the inverters, and weather data simulated by the regional climate model (WRF models),
signal processing tools with low computational cost are selected.
3. Time Series Decomposition and Preliminary Results
Signal processing methods are used to extract additional features from time series. Among the most known, the fast Fourier transform (FFT) transforms discrete time domain data into the frequency domain. The information collected comprises the gain and the phase of the signal for each frequency value. These characteristics carry information not available for data in the time domain. Unlike FFT, whose scope is limited to stationary or periodic signals, the wavelet transform (WT) is applicable to non-stationary and transient signals. The signal is decomposed into distinct details with determined bandwidths. The analysis of the information then extracted is used for fault diagnosis.
In order to extract information from PV output time series, these well-known decomposition tools have already been applied to PV fault diagnosis, as well as more recent tools. FFT [
4], EMD (empirical mode decomposition) [
5], discrete wavelet transform decomposition [
6], and PCA (principal component analysis) [
7] can be cited. Diagnosis of PV system faults warrants special attention for these tools in order to, e.g., detect arc faults, define PV system health status, quantify power quality disturbances in a PV-based microgrid, or discern shading faults.
Variational mode decomposition (VMD) is a decomposition algorithm, developed in 2014 by Dragomiretskiy [
8], that demodulates non-recursively a signal
in a finite number of distinct amplitude-modulated-frequency-modulated (AM-FM) signals
, called intrinsic mode functions (IMFs).
The superiority of EMD or VMD has been studied in cases of structural health monitoring [
9] and medical time series [
10]. The latter highlights that EMD is more sensitive to low frequencies than VMD and conversely for VMD and high frequencies. Regarding signal noise, VMD filters high-frequency noise in a more effective way without signal characteristic changes, unlike EMD, which reduces signal amplitude.
It is important to note that EMD’s or VMD’s superiority and advantages highly depend on the time series characteristics.
VMD has already been used in other application domains for diagnosis [
11], and it is a promising tool for electrical system diagnosis [
12]. In the next subsections, EMD and VMD are applied to PV output current for healthy, cloudy, and faulty data.
3.1. Experimental Data Selection
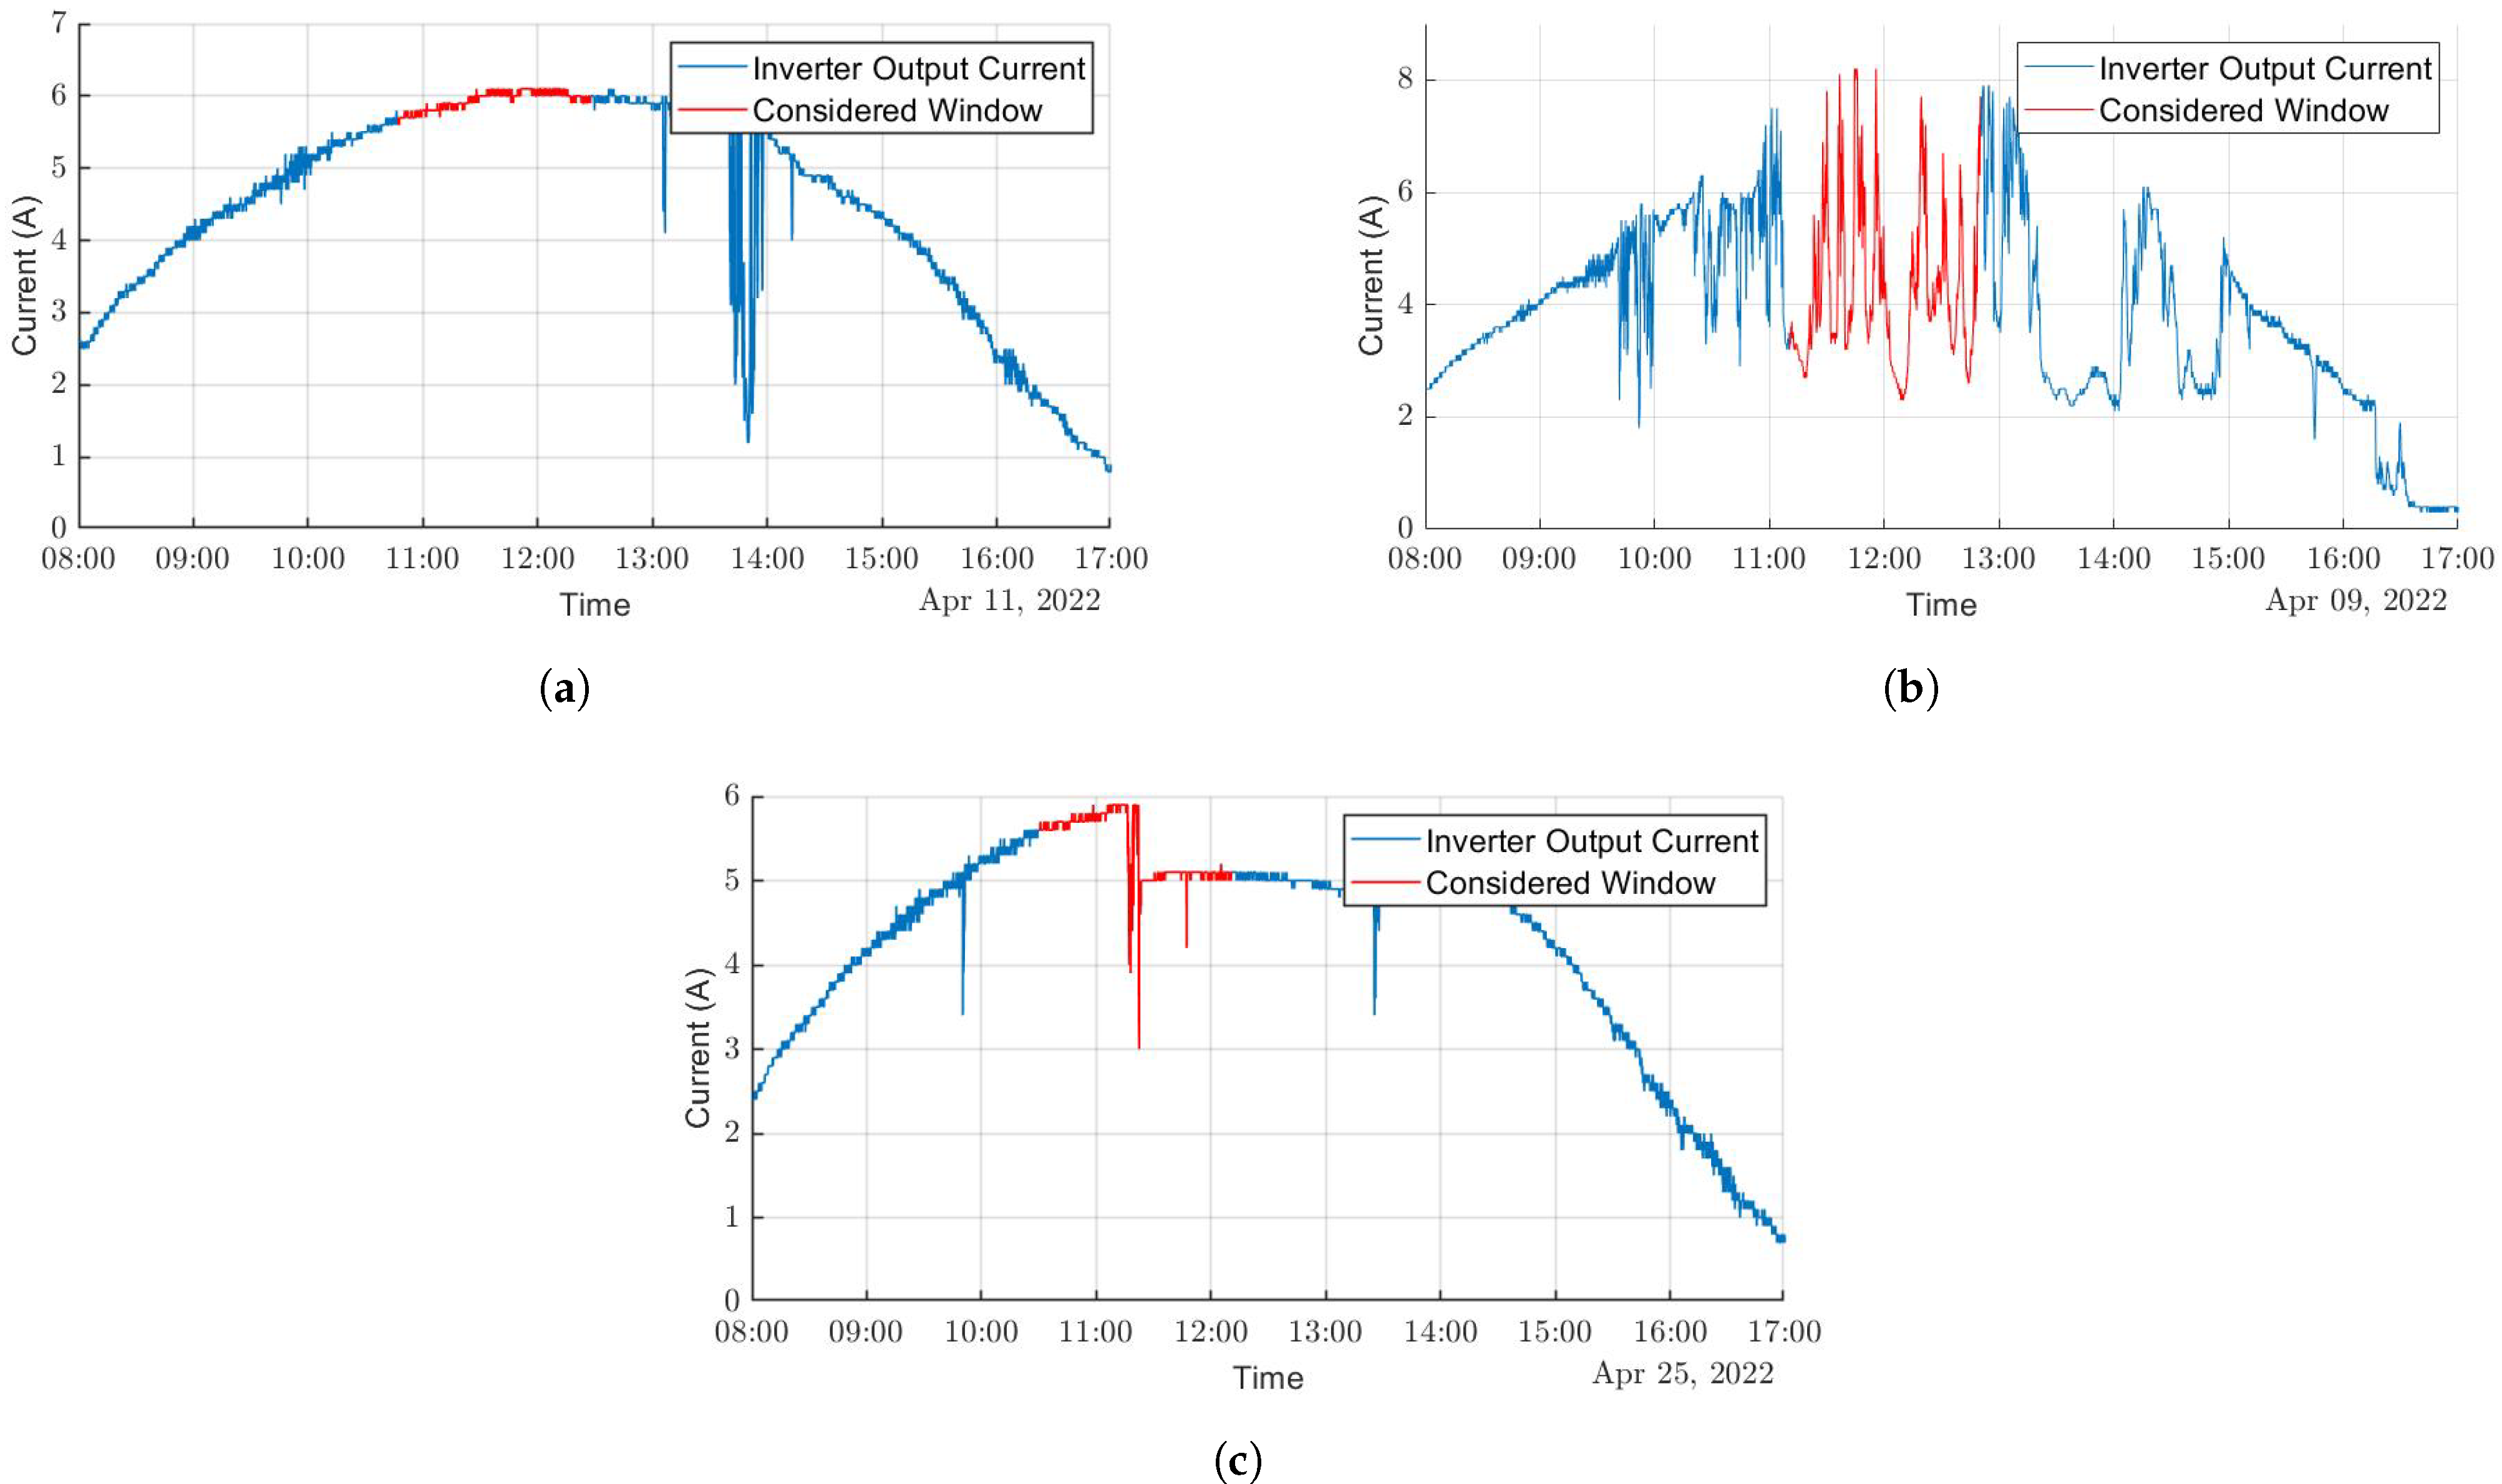
Three types of experimental conditions were applied on a 4kWc real rooftop PV plant consisting of 2 lines of twelve panels, corresponding to healthy conditions during clear and cloudy sky, and faulty conditions during clear sky weather.
3.2. Preliminary Results
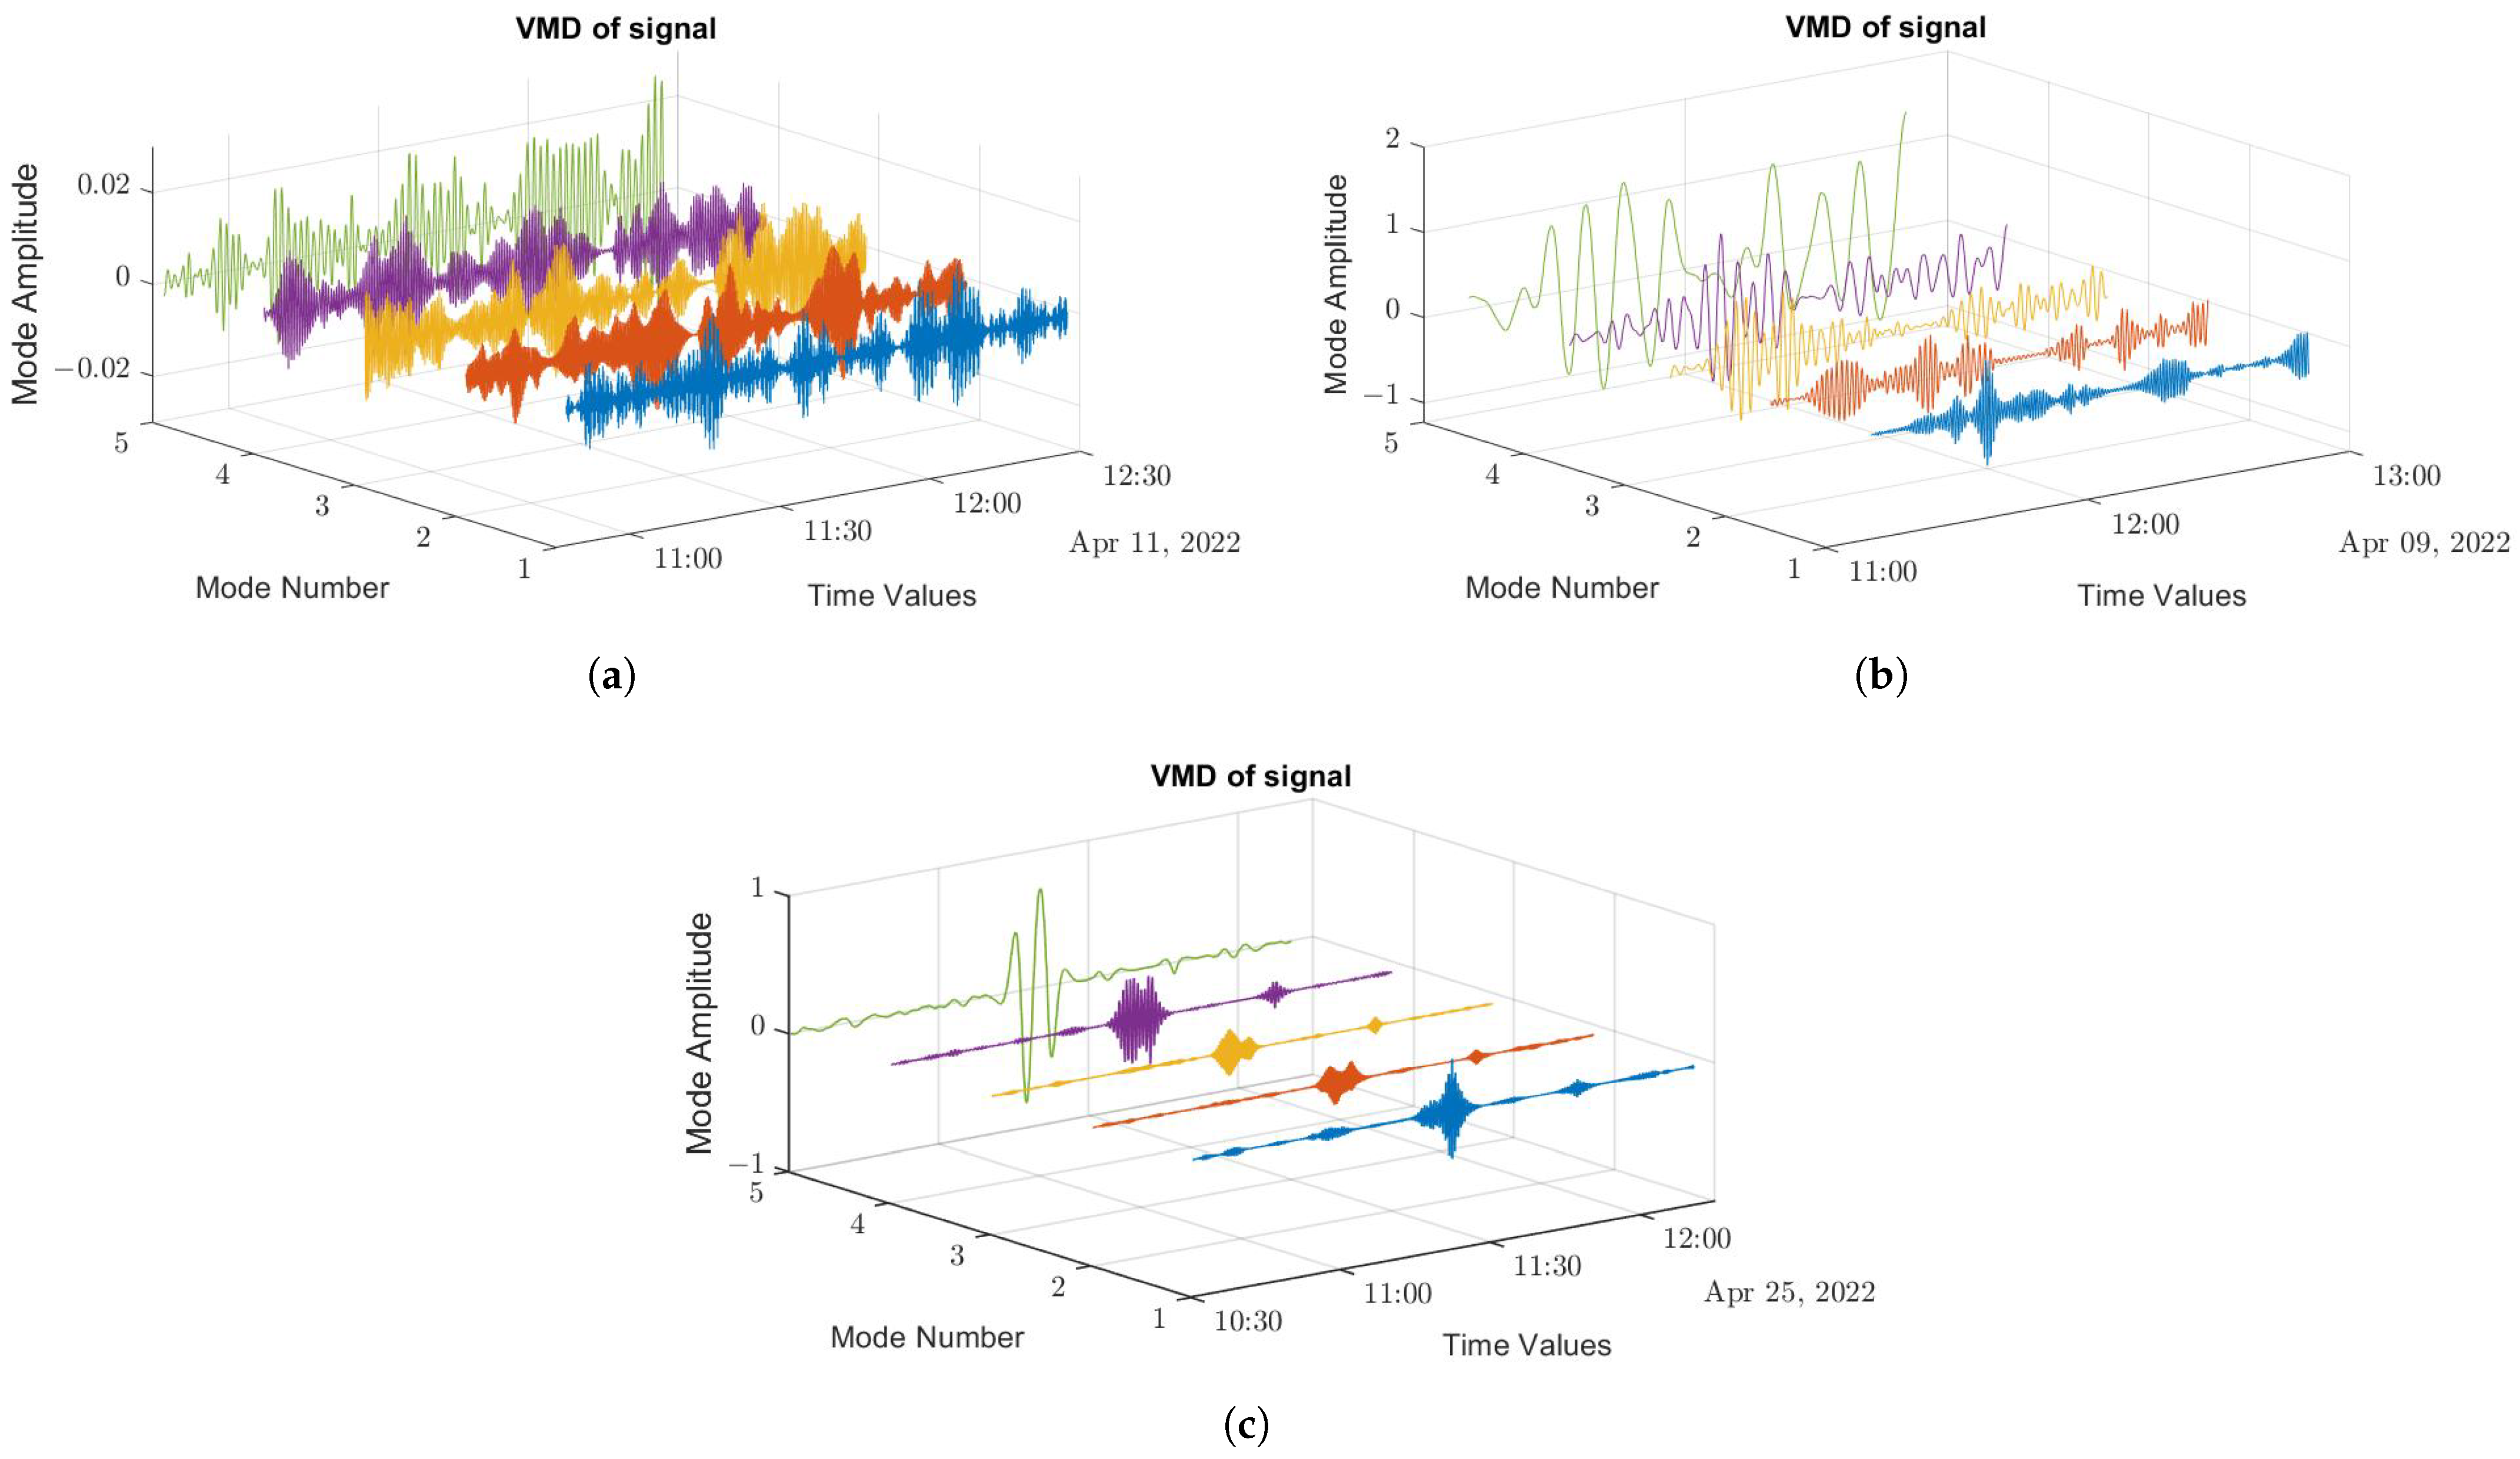
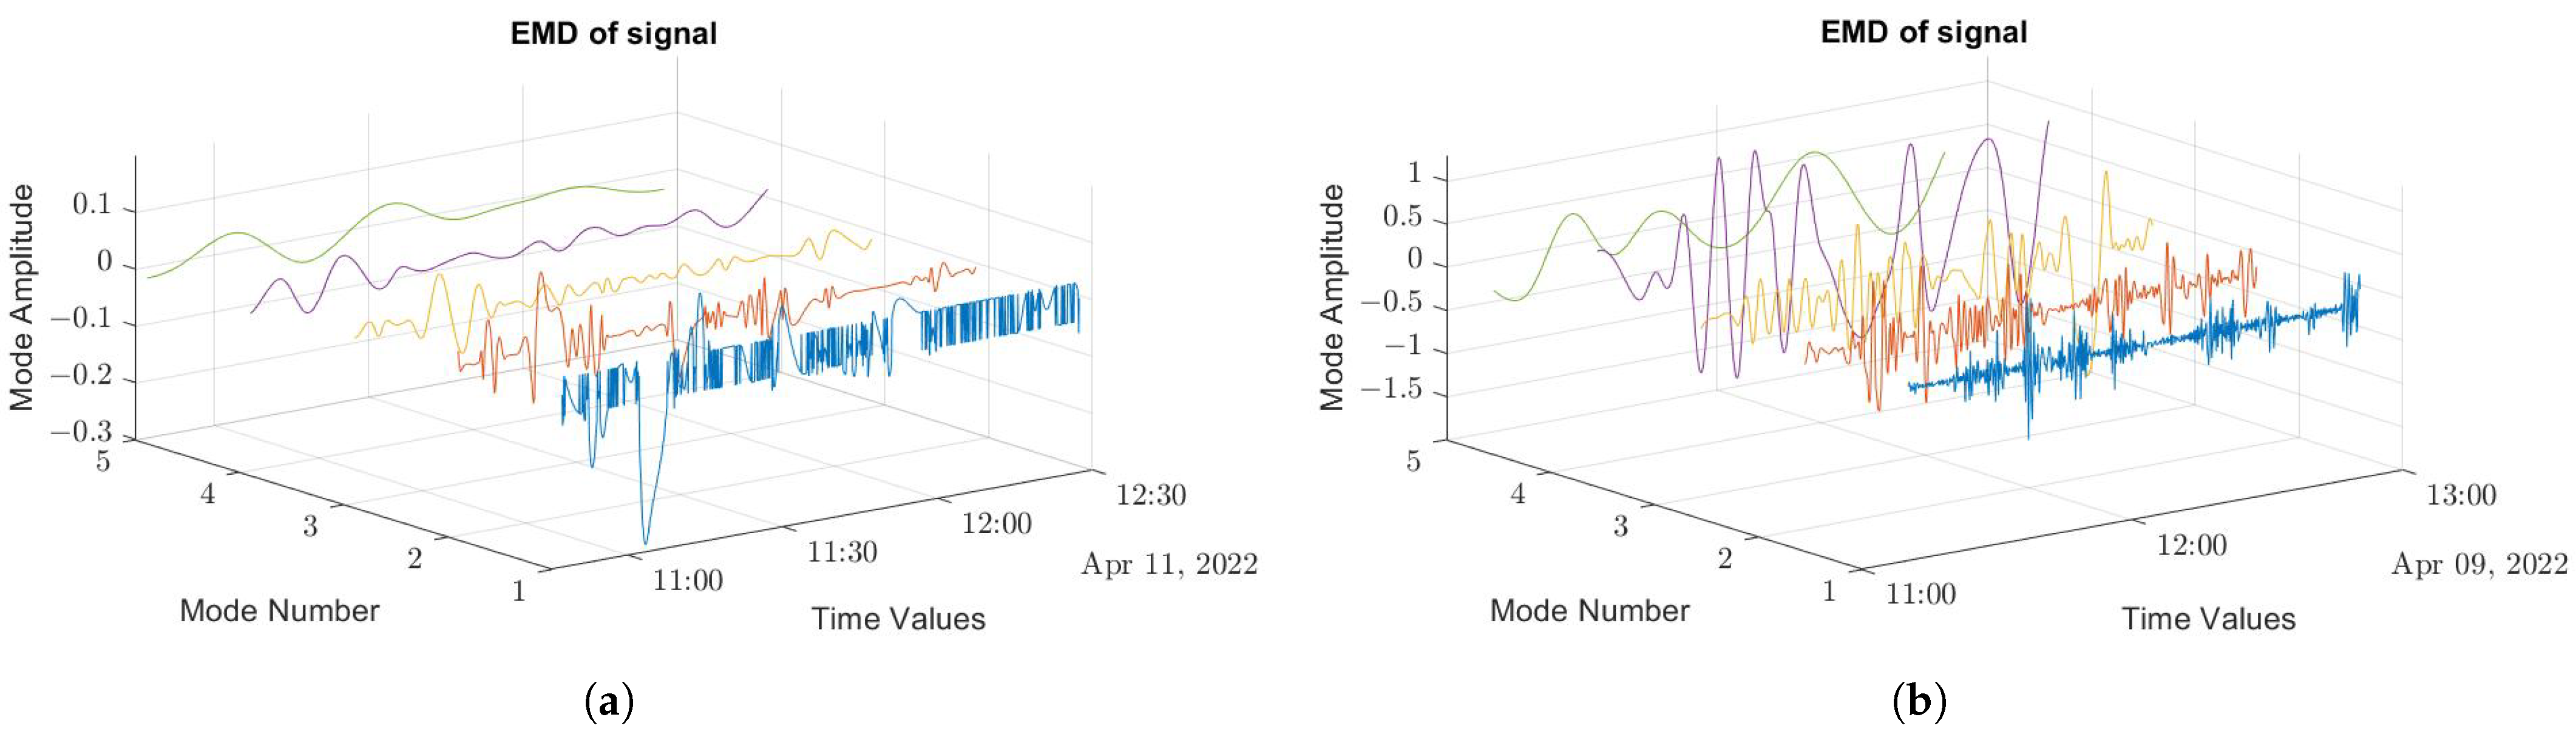
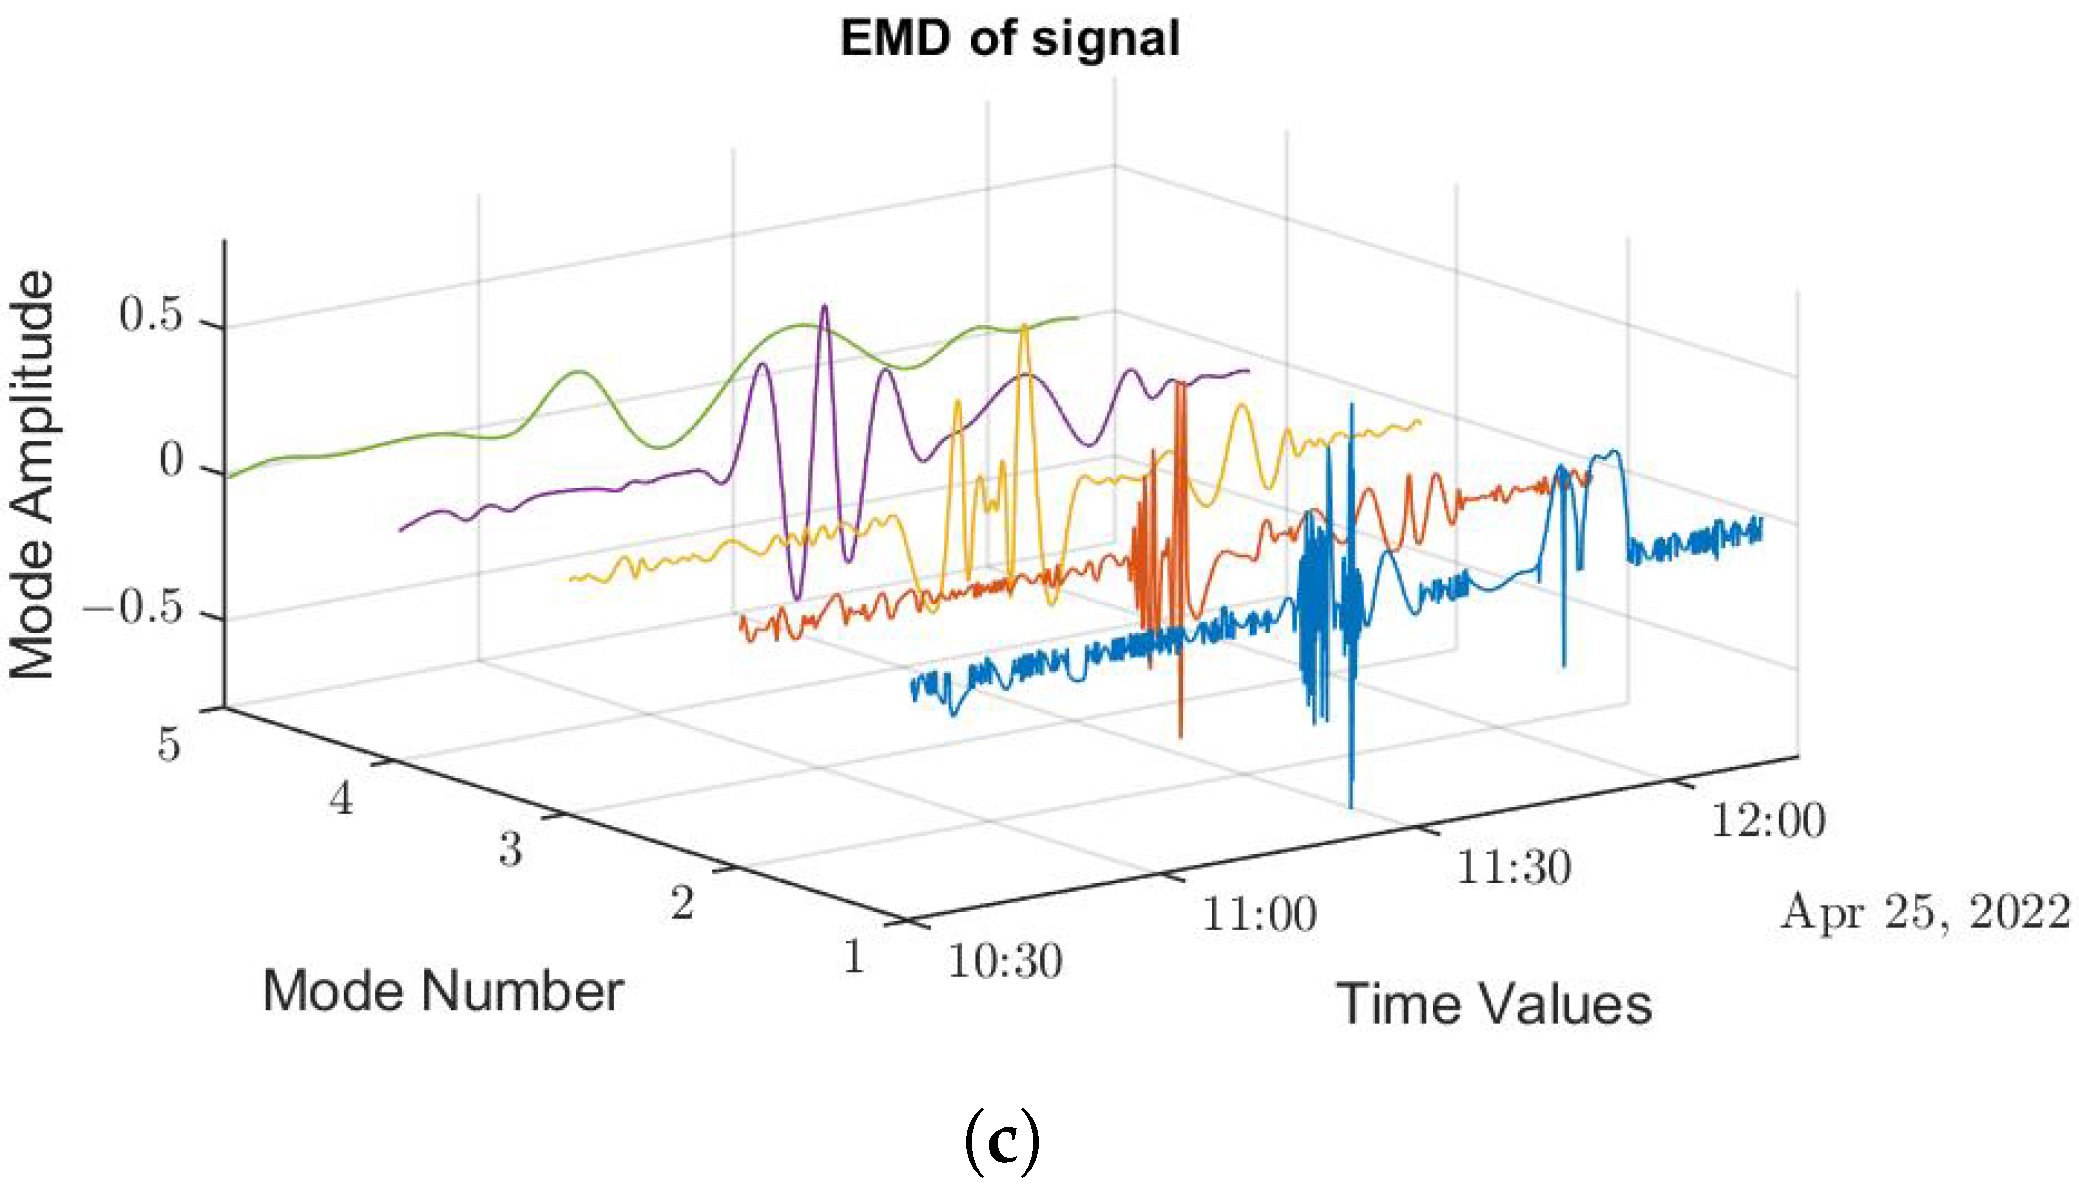
The following figures illustrate EMD and VMD analysis of the selected data. The different time series are shown in
Figure 1. The selected windows defined in red are decomposed by EMD and VMD.
Figure 2 and
Figure 3 exhibit the different IMFs for the three conditions.
In order to extract more information regarding the IMF characteristics, an analysis of each IMF was conducted. For each IMF, its energetic contribution was calculated, as well as its central frequency being collected and the coefficient of correlation being calculated between the current IMF and the original signal. These preliminary results suggest that some IMFs react differently according to experimental conditions. The analysis and the study of these IMFs could allow determination of the occurring conditions with accuracy, and discrimination of a faulty state from a healthy state.
4. Conclusions and Perspectives
The DETECT Project aims to develop real-time, low cost, and accurate PV system fault diagnosis. In this context, EMD and VMD are promising signal processing tools with a low computational cost. This advantage allows undertaking an on-line PV time-series data analysis.
The proposed targeted method should combine high-efficiency and low-cost technologies, yet minimize human and material effort deployment on photovoltaic parks. The first results have been confirmed on a set of experimental data. The analysis of IMF characteristics and the selection of the most significant ones are in progress. A comparative study of EMD and VMD performance associated with another step of the fault diagnosis tool is being undertaken. In parallel, different research domains are being investigated, in the context of signal processing and information theory. The main perspective is to build an indicator coming from IMF characteristics, aiming to precisely detect, isolate, and diagnose possible faults.
Author Contributions
Conceptualization, C.L., C.D. and F.K.; methodology, C.L., C.D. and F.K.; software, C.L. and C.D.; validation, C.L., C.D., F.K., F.A. and M.B.; formal analysis, C.L., C.D., F.K., F.A. and M.B.; investigation, C.L., C.D., F.K., F.A., and M.B.; resources, C.D., F.A. and M.B.; writing—original draft preparation, C.L. and F.K.; writing—review and editing, C.L., C.D. and F.K.; supervision, C.D., F.A. and M.B.; project administration, C.D., F.A. and M.B.; funding acquisition, C.D., F.A. and M.B. All authors have read and agreed to the published version of the manuscript.
Funding
This research work was funded by the ERDF (European Regional Development Fund) and the Region Council of La Réunion.
Institutional Review Board Statement
Not applicable.
Informed Consent Statement
Not applicable.
Data Availability Statement
Not applicable.
Acknowledgments
Special acknowledgments go to the European Regional Development Fund (ERDF) and the Regional council of Reunion for DETECT project funding. We also thank the project’s partner, the Femto-ST laboratory.
Conflicts of Interest
The authors declare no conflict of interest.
References
- SPL Énergie Réunion. Bilan Energétique de La Réunion Année 2020; Technical Report; Observatoire Énergie Réunion (OER), Horizon Réunion: Saint-Pierre, France, 2020. [Google Scholar]
- Jordan, D.C.; Silverman, T.J.; Wohlgemuth, J.H.; Kurtz, S.R.; VanSant, K.T. Photovoltaic failure and degradation modes. Prog. Photovolt. Res. Appl. 2017, 25, 318–326. [Google Scholar] [CrossRef]
- Pillai, D.S.; Blaabjerg, F.; Rajasekar, N. A Comparative Evaluation of Advanced Fault Detection Approaches for PV Systems. IEEE J. Photovoltaics 2019, 9, 513–527. [Google Scholar] [CrossRef]
- Wang, Z.; McConnell, S.; Balog, R.S.; Johnson, J. Arc fault signal detection—Fourier transformation vs. wavelet decomposition techniques using synthesized data. In Proceedings of the 2014 IEEE 40th Photovoltaic Specialist Conference (PVSC), Denver, CO, USA, 8–13 June 2014; pp. 3239–3244. [Google Scholar]
- Ding, K.; Feng, L.; Zhang, J.; Chen, X.; Chen, F.; Li, Y. A health status-based performance evaluation method of photovoltaic system. IEEE Access 2019, 7, 124055–124065. [Google Scholar] [CrossRef]
- Yılmaz, A.; Bayrak, G. A real-time UWT-based intelligent fault detection method for PV-based microgrids. Electr. Power Syst. Res. 2019, 177, 105984. [Google Scholar] [CrossRef]
- Rouani, L.; Harkat, M.F.; Kouadri, A.; Mekhilef, S. Shading fault detection in a grid-connected PV system using vertices principal component analysis. Renew. Energy 2021, 164, 1527–1539. [Google Scholar] [CrossRef]
- Dragomiretskiy, K.; Zosso, D. Variational mode decomposition. IEEE Trans. Signal Process. 2014, 62, 531–544. [Google Scholar] [CrossRef]
- Civera, M.; Surace, C. A comparative analysis of signal decomposition techniques for structural health monitoring on an experimental benchmark. Sensors 2021, 21, 1825. [Google Scholar] [CrossRef] [PubMed]
- Maji, U.; Pal, S. Empirical mode decomposition vs. variational mode decomposition on ECG signal processing: A comparative study. In Proceedings of the 2016 International Conference on Advances in Computing, Communications and Informatics, ICACCI 2016, Jaipur, India, 21–24 September 2016; pp. 1129–1134. [Google Scholar] [CrossRef]
- Shang, H.; Li, F.; Wu, Y. Partial discharge fault diagnosis based on multi-scale dispersion entropy and a hypersphere multiclass support vector machine. Entropy 2019, 21, 81. [Google Scholar] [CrossRef] [PubMed] [Green Version]
- Achlerkar, P.D.; Samantaray, S.R.; Manikandan, M.S. Variational Mode Decomposition and Decision Tree Based Detection and Classification of Power Quality Disturbances in Grid-Connected Distributed Generation System. IEEE Trans. Smart Grid 2018, 9, 3122–3132. [Google Scholar] [CrossRef]
| Publisher’s Note: MDPI stays neutral with regard to jurisdictional claims in published maps and institutional affiliations. |
© 2022 by the authors. Licensee MDPI, Basel, Switzerland. This article is an open access article distributed under the terms and conditions of the Creative Commons Attribution (CC BY) license (https://creativecommons.org/licenses/by/4.0/).


