Proceeding Paper

Towards Time-Series Feature Engineering in Automated Machine Learning for Multi-Step-Ahead Forecasting †

1
Leiden Institute of Advanced Computer Science, Leiden University, 2333 CA Leiden, The Netherlands
2
Honda Research Institute Europe, 63073 Offenbach am Main, Germany
*
Author to whom correspondence should be addressed.
Presented at the 8th International Conference on Time Series and Forecasting, Gran Canaria, Spain, 27–30 June 2022.
Eng. Proc. 2022, 18(1), 17; https://doi.org/10.3390/engproc2022018017
Published: 21 June 2022
(This article belongs to the Proceedings of The 8th International Conference on Time Series and Forecasting)

Abstract

:
Feature engineering is an essential step in the pipelines used for many machine learning tasks, including time-series forecasting. Although existing AutoML approaches partly automate feature engineering, they do not support specialised approaches for applications on time-series data such as multi-step forecasting. Multi-step forecasting is the task of predicting a sequence of values in a time-series. Two kinds of approaches are commonly used for multi-step forecasting. A typical approach is to apply one model to predict the value for the next time step. Then the model uses this predicted value as an input to forecast the value for the next time step. Another approach is to use multi-output models to make the predictions for multiple time steps of each time-series directly. In this work, we demonstrate how automated machine learning can be enhanced with feature engineering techniques for multi-step time-series forecasting. Specifically, we combine a state-of-the-art automated machine learning system, auto-sklearn, with tsfresh, a library for feature extraction from time-series. In addition to optimising machine learning pipelines, we propose to optimise the size of the window over which time-series data are used for predicting future time-steps. This is an essential hyperparameter in time-series forecasting. We propose and compare (i) auto-sklearn with automated window size selection, (ii) auto-sklearn with tsfresh features, and (iii) auto-sklearn with automated window size selection and tsfresh features. We evaluate these approaches with statistical techniques, machine learning techniques and state-of-the-art automated machine learning techniques, on a diverse set of benchmarks for multi-step time-series forecasting, covering 20 synthetic and real-world problems. Our empirical results indicate a significant potential for improving the accuracy of multi-step time-series forecasting by using automated machine learning in combination with automatically optimised feature extraction techniques.

1. Introduction

Time-series (TS) data, such as electrocardiograms, music, exchange rates, and energy consumption, is everywhere in our daily life and business world. Multi-step-ahead forecasting is an important task in time-series modeling with many industrial applications, such as crude oil price forecasting [1] and flood forecasting [2]. Both ML models [3,4] and statistical models [5,6] are used for this purpose. Creating an ML pipeline for such TS data analysis is, however, difficult for many domain experts with limited machine learning expertise, due to the complexity of the data sets and the ML models.
To reduce the complexity of creating machine learning pipelines, automated machine learning (AutoML) research has recently focused on developing algorithms that can automatically design ML pipelines optimised for a given data set without human input [7,8]. The components in a pipeline may include a data cleaning component, feature engineering component, ML model component, and ensemble construction component. While there has been work proposed in the past that used AutoML for TS analysis [9], the current AutoML systems do not support specialised techniques used for designing machine learning pipelines for TS data, such as TS feature engineering. As demonstrated by Christ et al. [10], including such specialized techniques for extracting TS features or feature importance filtering could significantly improve the accuracy of ML models. Therefore, our goal in this paper is to study if extending AutoML systems by including such techniques can improve the quality of automatically generated machine learning pipelines for multi-step forecasting.
This paper presents a study of AutoML for time-series multi-step TS forecasting implemented through (i) multi-output modeling, and (ii) recursive modeling. We combine the state-of-the-art AutoML system of auto-sklearn with tsfresh, a well-known library for feature extraction from TS. We implement three AutoML variants and state-of-the-art baseline models, including auto-sklearn, SVM, GBM, N-BEATS, and Auto-Keras. More specifically, our contributions are as follows:
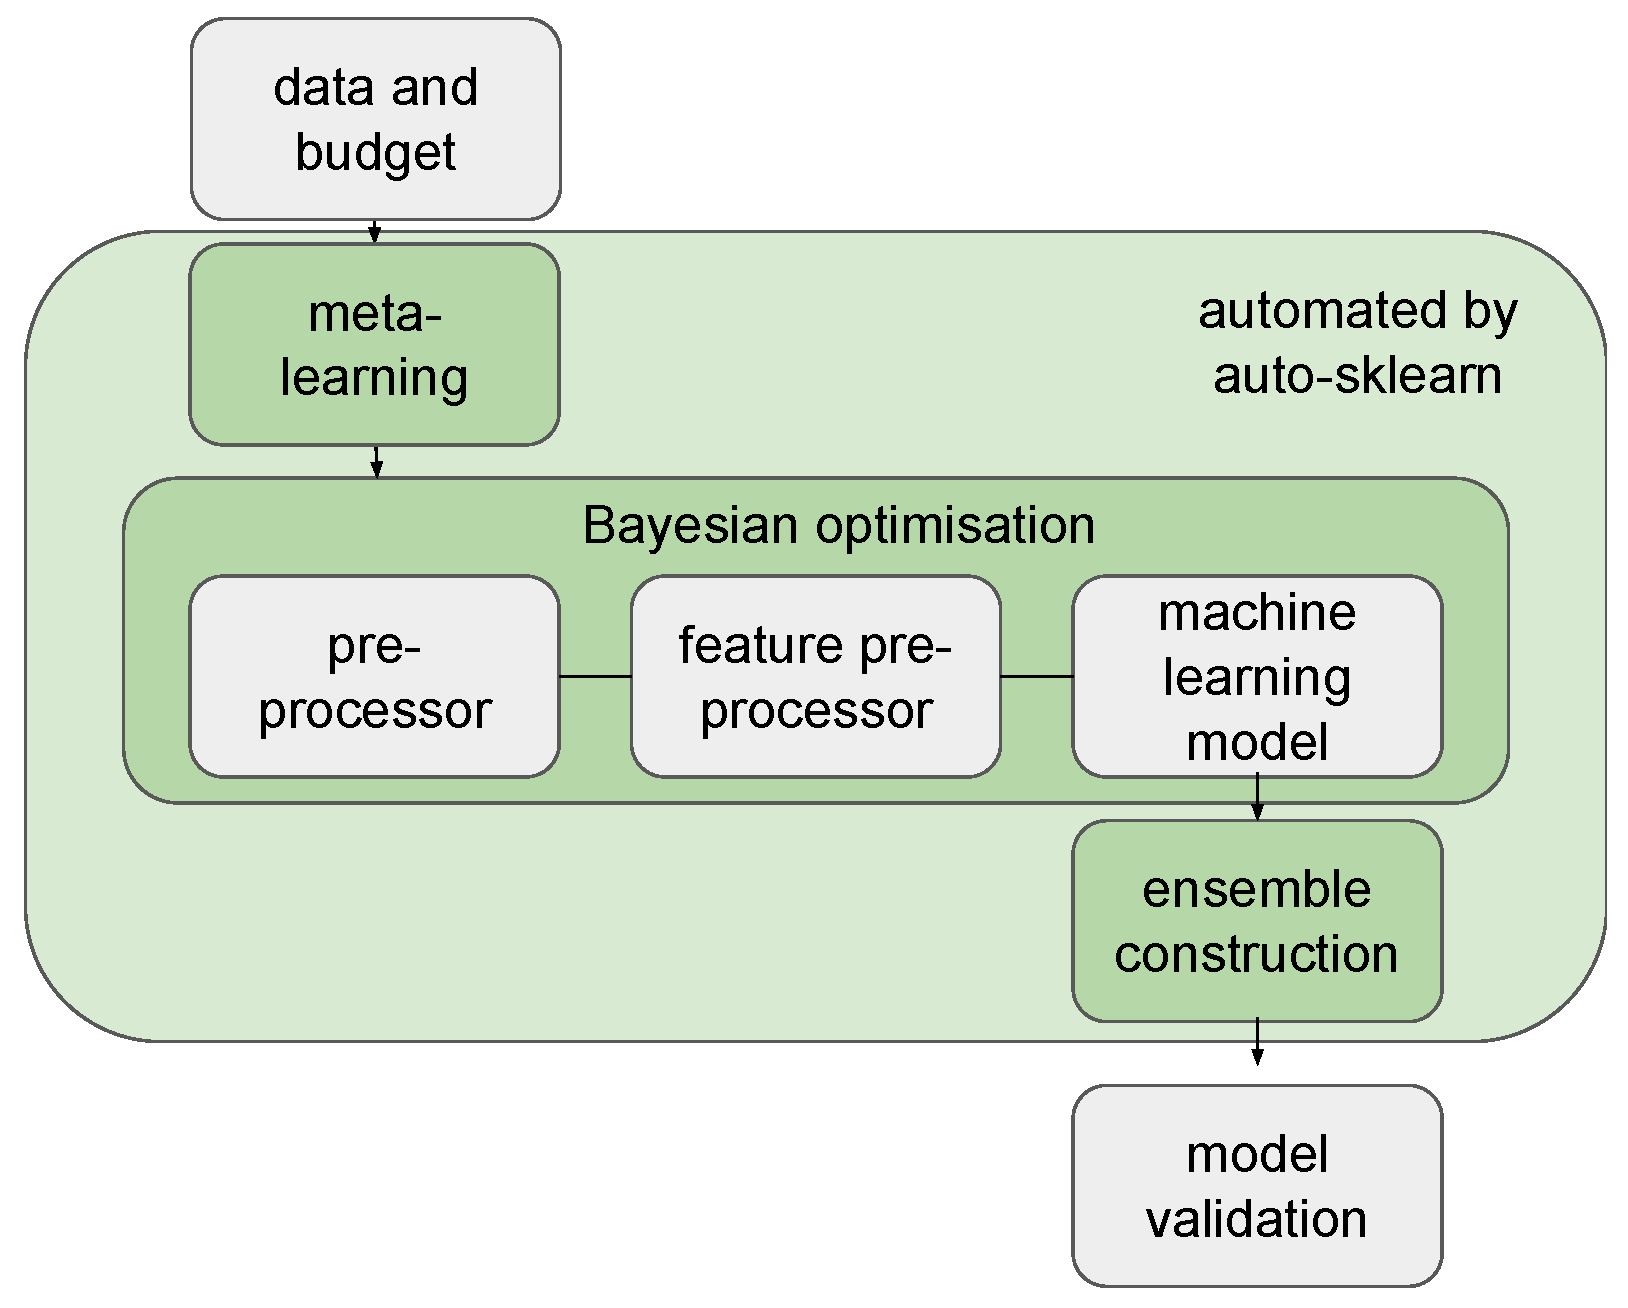
  • We adapt the auto-sklearn AutoML system to the task of forecasting and introduce three AutoML forecasting variants for multi-step-ahead TS forecasting.
  • We demonstrate the importance of feature selection and window size selection in forecasting problems and further show that by incorporating such approaches, our TS AutoML techniques outperform available AutoML methods.
  • We evaluate our methods on 20 benchmarking data sets from 20 different categories and against the baselines. We found that our proposed AutoML method outperformed the traditional ML baseline on 14 out of 20 data sets and N-BEATS on 15 out of 20 data sets.
The remainder of this paper is structured as follows: Section 2 covers related work on TS forecasting, TS feature engineering and AutoML. Section 3 introduces the problem statement of AutoML for multi-step TS forecasting. In Section 4, the methodology of our newly proposed models is explained. Section 5 presents the results of the empirical performance comparison of different ML models for multi-step TS forecasting. A summary of our work and directions for future work are given in Section 6.

2. Related Work

Multi-step TS Forecasting: different ML methods and statistical methods have been used for both single-step and multi-step TS analysis in the past few decades [11]. These include artificial neural networks [3], support vector machines [4], gradient boosting machine [12], random forest [13], auto-regressive moving average models [5], and exponential smoothing models [6]. To use these models for multi-step forecasting, two major approaches are used: direct and recursive strategies [14]. The first of these uses multi-output regression models to predict multiple TS steps into the future directly or use multiple models (one for each time step) to make multi-step forecasting. Multi-output models show good performance and require less computational resources than training multiple models to realise multi-step forecasting [15]. The second approach uses a single model recursively, using the predicted values as an additional input to forecast the next step. In this case, the error in the prediction may be accumulated [14]. Recursive strategies only require one model, which saves significant computational time [14]. Other methods based on these two approaches are also used, such as the DirRec strategy [16], which combines the recursive strategies and direct strategies.
TS feature engineering: Feature engineering is an essential component in ML pipelines. Feature extraction methods have also been used for TS analysis tasks [17,18]. There are a number of TS feature extraction libraries that are widely used for TS analysis, including tsfresh [19], Catch22 [20], and hctsa [21]. Catch22 extracts a selected list of the 22 most useful features of the 4791 features of hctsa from a TS. Extracting features with Catch22 is more computationally efficient than hctsa, with only a 7% reduction in accuracy on average. In the following, we use tsfresh, which extracts more than 700 TS features in parallel and has previously shown strong performance [19], since it does not require huge computational resources like hctsa, or suffers from an accuracy reduction like Catch22.
AutoML: AutoML systems have been used in many domains, such as image classification [22], language processing [23] and energy consumption forecasting [9]. However, TS features are not well-studied in AutoML systems. In our earlier work [9], we studied AutoML for short-term load forecasting demonstrating the competitive performance of AutoML systems. However, we did not investigate the use of TS features. In another work [24], we studied AutoML with TS features for single-step TS forecasting. Our experimental results indicate that AutoML with TS features can further improve the accuracy of AutoML systems. In this work, we focus on studying how to improve the performance of AutoML systems on multi-step forecasting tasks by using TS features. Many AutoML systems have been recently developed, including Auto-sklearn [25], AutoGluon [8] and Auto-Keras [26] . Auto-sklearn is used in our experiments, since it supports various algorithms (e.g., SVMs) that are not available in the other systems, and it is easy to extend. Auto-Keras is used to create a deep learning baseline in our experiments.

3. Problem Statement

Given a univariate TS x = [ x 1 , , x i ] composed of i observations. We are interested in predicting the next k values x = [ x i + 1 , , x i + k ] , where k > 1 denotes the forecasting window. Usually not all the data points show the same influence on the predictions of [ x i + 1 , , x i + k ] . The more recent data points tend to be more important. Specifically, given a TS segment [ x i w + 1 , , x i ] , we are interested in forecasting of [ x i + 1 , , x i + k ] ; the window size w indicates how much historical data are used to make the prediction. In our previous work [24], we found that the window size w plays an essential role in single-step TS forecasting; specifically, if an ML model gets too much or too little information, this may reduce the model’s performance. Here, we extend the automated window size selection technique to multi-step forecasting. Besides this, we use tsfresh to automatically extract features from TS data within these windows.

AutoML for Multi-Step TS Forecasting

We define the Combined Algorithm Selection and Hyperparameter optimisation (CASH) problem [27] for multi-output TS forecasting as the following joint optimisation problem: Given a TS data set x = [ x 1 , , x n ] that is split into x t r a i n and x v a l i d , we are interested in building an optimised model using x t r a i n by minimising loss on x v a l i d . Formally, we define the automated TS forecasting problem as:
Let A = { A ( 1 ) , , A ( k ) } be a set of algorithms with associated hyperparameter spaces Λ ( 1 ) , , Λ ( k ) . Let w = { w ( 1 ) , , w ( l ) } be the set of the possible window sizes. Furthermore, let x t r a i n be a training set, and x v a l i d be a validation set. Finally, let L ( A λ ( i ) , w ( j ) , x t r a i n , x v a l i d ) denote the loss that algorithm A ( i ) achieves on x v a l i d when trained on x t r a i n with hyperparameters λ Λ ( i ) and window size w ( j ) . Then the automated TS forecasting problem is to find the window size, algorithm, and hyperparameter setting that minimises this loss, i.e., to determine:
( A * , λ * , w * ) argmin A A , λ Λ , w w L ( A λ , w , x t r a i n , x v a l i d )

4. Methodology

This section presents the two multi-step forecasting techniques and the AutoML technique enhanced with TS features we use later in our experiments.

4.1. Multi-Step Forecasting

Recursive strategy: In this strategy, given a univariate TS x = [ x 1 , , x n ] composed of n observations, a model f is trained to perform a single-step ahead forecast: x ^ i + 1 = f ( x i w + 1 , , x i ) with i { w , , n 1 }. Then we use x ^ i + 1 as an input to predict x i + 2 . x ^ i + 2 = f ( x i w + 2 , , x i , x ^ i + 1 ) with i { w , , n 1 }. We continue recursively, making new predictions in this manner until we forecast x i + k .
Direct Multi-Output strategy: A multi-output strategy has been proposed by Taieb and Bontempi [28] to solve multi-step TS forecasting tasks. In this strategy, one multi-output model f is learned, i.e., [ x ^ i + 1 , , x ^ i + k ] = f ( x i w + 1 , , x i ) with i { w , , n k } .

4.2. Auto-Sklearn with TS Feature Engineering

In this work, we study how we can extend auto-sklearn [25] to perform automatic feature extraction on TS data. Originally, the pipelines constructed by auto-sklearn include a preprocessor, feature preprocessor and ML components. The ensemble construction used in auto-sklearn uses a greedy algorithm to build the ensembles. The workflow of auto-sklearn is illustrated in Figure 1. Auto-sklearn has a powerful feature preprocessor component. However, it does not support any specialised TS feature extractors. In our work, we use our newly proposed TS feature extractors in the search space instead of the feature extractor in auto-sklearn. Automated feature extraction in this case considers both the selection of the window size and extraction of relevant features. Therefore, we propose three variants of auto-sklearn that are specially designed for TS forecasting tasks by replacing the feature extractors of auto-sklearn with one of the following.
(1)
Auto-sklearn with automated window size selection (W): the first variant of auto-sklearn for TS forecasting optimises the window size w. The TS x = [ x i w + 1 , , x i ] are used to train a model that predicts [ x i + 1 , , x i + k ] .
(2)
Auto-sklearn with tsfresh features (T): the second variant of auto-sklearn extracts tsfresh TS features from the TS segment x = [ x i w + 1 , , x i ] to predict [ x i + 1 , , x i + k ] . In this case, the window size w is predefined and fixed. The TS features g ( x ) = g ( [ x i w + 1 , , x i ] ) are calculated using the TS feature extractor g. Feature importance is calculated using the Benjamini-Hochberg procedure [29] to select the important features. The Benjamini-Hochberg procedure selects important features for each step in the TS separately. We then use the union of all the important features to predict [ x i + 1 , , x i + k ] .
(3)
Auto-sklearn with automated window size selection and tsfresh features (WT): this approach combines the two previously mentioned approaches. Both window size w and the TS extractor g are optimised in this variant.

5. Experimental Results

Our key empirical results are based on aggregate performance over 20 data sets and 8 models. More detailed descriptions of the data sets and models are described in the section.

5.1. Data Sets

The open-source datasets from CompEngine [30] are used in our experiments. CompEngine is a TS data engine containing 197 types of data sets comprising 29,514 in total. These data sets include both real-world and synthetic data sets. We chose ten real-world and ten synthetic data sets from different categories. These are comprised of the following 20 categories: Audio: Animal sounds, Human speech, Music; Ecology: Zooplankton growth; Economics: Macroeconomics, Microeconomics; Finance: Crude oil prices, Exchange rate, Gas prices; Medical: Electrocardiography ECG; Flow: Driven pendulum with dissipation, Duffing-van der Pol Oscillator, Driven van der Pol oscillator, Duffing two-well oscillator, Diffusionless Lorenz Attractor; Stochastic Process: Autoregressive with noise, Correlated noise, Moving average process, Nonstationary autoregressive, Random walk.
Since there are usually more than one data set in each category, we choose the first one of each category. We split every data set into 67% training and 33% test set, based on temporal order, since the data sets are TS.

5.2. Experimental Setup

All the experiments were executed on 8 cores of an Intel Xeon E5-2683 CPU (2.10 GHz) with 10 GB RAM. In the experiments, version 0.8.0 of auto-sklearn and version 0.16.1 of tsfresh were used. To evaluate the quality of an ML pipeline, we used quantified error/accuracy. R M S E was used as a performance metric in the optimisation. The maximum evaluation time for one ML pipeline was set to 20 min wall-clock time. The time budget for every AutoML optimisation on each data set was set to 3 h wall-clock time. In these experiments, we used hold-out validation (training:validation = 67:33), the default validation technique in auto-sklearn. The split was carried out only on the training data, such that the optimisation process never sees the test data. However, we did not shuffle the data set in order to preserve the temporal structure of the TS data. All remaining choices were left at their default settings. Since experiments are very time-consuming, we used bootstrapping to create distributions of performance results in order to investigate their variability. Every experiment was run 25 times. We then randomly sampled 5 out of the 25 results and selected the model with the lowest R M S E on the training set out of these five models and reported the R M S E on the test set. We repeated this process 100 times per model and data set. The distributions we showed are based on these 100 values.
We compared the AutoML methods, including Auto-Keras, auto-sklearn and our proposed variants, with traditional ML baselines and N-BEATS. Both recursive and multi-output techniques are used in the ML baselines (GBM and SVM). All other models use the multi-output approach.

5.3. Baselines

  • Gradient Boosting Machine (GBM): Gradient Boosting Machine is a classical ML model used for TS analysis tasks that has shown promising performance in the M3, M4 competitions [31]. For hyperparameter optimisation, we performed a random search on GBM with 30 iterations and window size w = 100 [32]. In this case, the search space is the same as the search space of GBM in auto-sklearn. In this experiment, we did not split the training set into the training set and validation sets.
  • Support vector machine (SVM): SVM is another classical ML model that has been used for TS forecasting (e.g., [13]). Similar to GBM experiments, we use 30 iterations of random search and window size w = 100 . The search space is the same as the search space of SVM in auto-sklearn.
  • N-BEATS: N-BEATS [33] uses fully-connected layers with residual links to improve 3% over the winner of the M4 competition, which demonstrates state-of-the-art performance. We used the default hyperparameter settings in the implementation provided by Oreshkin et al. [33] and the bootstrapping approach mentioned in Section 5 to create distributions of results. The number of epochs was set to 500.
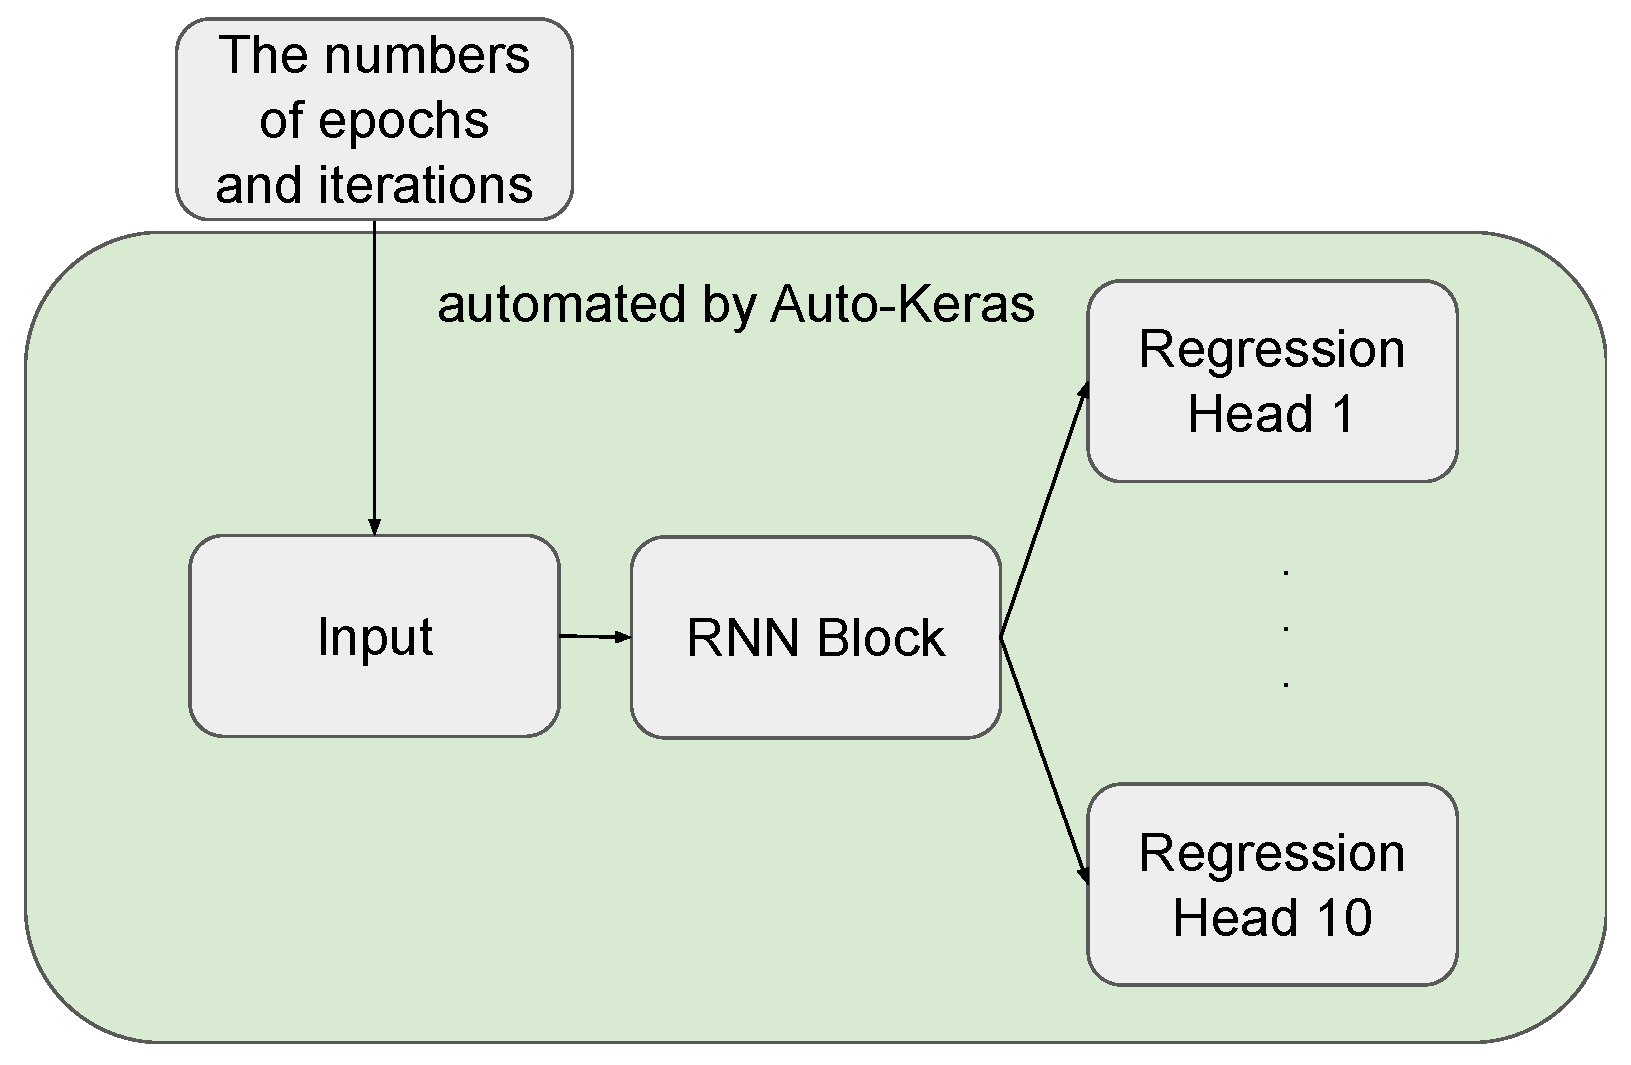
  • Auto-Keras: Auto-Keras [26] is a neural architecture search system that uses Bayesian optimisation to search for high-performance neural network architectures. Some neural network units available in its search space (e.g., LSTM, GRU), have been used for TS forecasting (see, e.g., [34,35]). Vanilla Auto-Keras does not support multi-output models. To deal with multi-step forecasting tasks, we designed our new search space using three types of blocks available in Auto-Keras: Input block, RNN Block and Regression Head (see Figure 2). The RNN Block is the critical component in our networks. We use RNN as a baseline, as it has been recently studied in the literature on TS forecasting (see, e.g., [34,36]). Several hyperparameters need to be considered for this block, including bidirectionality, the number of layers and layer type (LSTM or GRU). Auto-Keras cannot choose the window size w automatically. We manually preprocessed the data with window size w = 100 . We used Bayesian optimisation for architecture search. The number of epochs was set to 100, and we left the remaining settings of Auto-Keras at their default values.
  • Vanilla auto-sklearn (VA): We manually preprocessed the data with window size w = 100 and then fed it to the auto-sklearn. The time budget for the optimisation was set to 3 h.

5.4. Our Methods

  • Auto-sklearn with automated window size selection (W): For the W variant, we did not need to manually preprocess the data, since the window size w is selected automatically. The window size ranges from 50 to 200.
  • Auto-sklearn with tsfresh features (T): In the T variant, the TS feature extractor tsfresh was used as an internal component of auto-sklearn. Auto-sklearn used these TS features as input data to search over ML pipelines. The window size was set to w = 100 .
  • Auto-sklearn with automated window size selection and tsfresh features (WT): In WT, we set the window size w to range from 50 to 200. The TS features were extracted from these input data.
Table 1 and Table 2 compare the performance achieved by different methods in terms of RMSE on the test set. Table 1, shows the results for traditional ML baseline models, while Table 2 presents the results for AutoML techniques and N-BEATS. To present the results in these tables, we calculated the statistical significance of the results by the non-parametric Mann–Whitney U-test [37] with a standard significance level set to 0.05. The bold-faced entries show the lowest mean R M S E achieved on a given data set, and the ∗ means the R M S E is statistically best.

5.5. Research Questions

Q1: How do recursive and multi-output techniques compare in terms of accuracy?
To determine the answer to this question, we compared the recursive and multi-output versions of GBM and SVM algorithms. Among the baselines we consider, N-BEATS as described in the original work is not a recursive model. Therefore, we do not consider it for this analysis. Looking at Table 1, we generally observe that GBM-multioutput performs better than GBM-recursive on 12 out of 20 data sets, while SVM-multioutput outperforms SVM-recursive on 17 out of 20 data sets in terms of RMSE . As we have observed that multi-output models tend to perform better, which is in line with the results from [14]. Therefore, we only use the multi-output technique in our next experiments.
Q2: To what extent can AutoML techniques (Auto-Keras, auto-sklearn, and our variants) beat the traditional baselines (GBM, SVM)?
Looking at Table 1 and Table 2, one can compare the performance achieved by different methods in terms of RMSE on the test set. We observe that Auto-Keras beats all the traditional ML baseline models (GBM-recursive, GBM-multioutput, SVM-recursive, and SVM-multioutput) on 4 out of 20 data sets. Vanilla auto-sklearn outperforms all the traditional ML baselines on 8 out of 20 data sets. Our three variants W, T, WT show lower error than all the traditional ML baselines on 10, 5, and 5 out of 20 data sets, respectively. The best AutoML (W) outperforms the best traditional ML baseline (SVM-multioutput) on 14 out of 20 data sets.
Q3: To what extent can AutoML techniques beat N-BEATS?
Looking at Table 2, we observe that the best AutoML (W) outperforms N-BEATS on 14 out of 20 data sets. For other AutoML techniques we observe that Auto-Keras, VA, T, and WT beat N-BEATS on 5, 12, 11, and 10 out of 20 data sets, respectively. AutoML methods that are based on standard machine learning are beating this neural networks based model.

6. Conclusions

In this paper, we extend AutoML for multi-step TS forecasting with TS features. We found that AutoML can achieve significantly higher accuracy than the traditional ML baselines on 14 out of 20 data sets in terms of RMSE . Although N-BEATS performs better than Auto-Keras and vanilla auto-sklearn on many data sets, our AutoML TS variants still managed to beat it on 14 out of 20 data sets. We found that the multi-output technique tends to perform better with the same budget than the recursive technique in the multi-step TS forecasting tasks. Overall, these results clearly demonstrate that the use of AutoML techniques and multi-output strategies for multi-step TS forecasting is promising.
Interesting avenues for future work include AutoML for online learning and TS classification. Most AutoML systems focus on a stable data set. Characteristics of TS data might change over time and consequently, the best configuration of data sets may vary over time. We see potential value in extending AutoML on evolving data streams. Furthermore, in TS classification typically classification with a fixed-sized sliding window has been studied. However, the best window size might not be easily determined. Our automated window size selection technique may help to improve the performance of the classification tasks.

Author Contributions

Conceptualization, C.W., M.B. and H.H.H.; methodology, C.W., M.B. and H.H.H.; software, C.W.; validation, C.W.; formal analysis, C.W.; investigation, C.W., M.B. and H.H.H.; resources, C.W., M.B. and H.H.H.; data curation, C.W.; writing—original draft preparation, C.W.; writing—review and editing, M.B., T.B., H.H.H., S.L. and M.O.; visualization, C.W.; supervision, M.B., T.B., H.H.H., S.L. and M.O.; project administration, T.B., H.H.H., S.L. and M.O.; funding acquisition, T.B., H.H.H., S.L. and M.O. All authors have read and agreed to the published version of the manuscript.

Funding

This work is part of the research programme C2D–Horizontal Data Science for Evolving Content with project name DACCOMPLI and project number 628.011.002, which is (partly) financed by the Netherlands Organisation for Scientific Research (NWO).

Institutional Review Board Statement

Not applicable.

Informed Consent Statement

Not applicable.

Data Availability Statement

The data sets used in our experiments are available in https://github.com/wangcan04/AutoML-multistep-forecasting, accessed on 1 June 2022.

Conflicts of Interest

The authors declare no conflict of interest.The funders had no role in the design of the study; in the collection, analyses, or interpretation of data; in the writing of the manuscript, or in the decision to publish the results.

Abbreviations

The following abbreviations are used in this manuscript:
TSTime-series
MLMachine Learning
AutoMLAutomated Machine Learning

References

  1. Xiong, T.; Bao, Y.; Hu, Z. Beyond one-step-ahead forecasting: Evaluation of alternative multi-step-ahead forecasting models for crude oil prices. Energy Econ. 2013, 40, 405–415. [Google Scholar] [CrossRef] [Green Version]
  2. Chang, F.J.; Chiang, Y.M.; Chang, L.C. Multi-step-ahead neural networks for flood forecasting. Hydrol. Sci. J. 2007, 52, 114–130. [Google Scholar] [CrossRef]
  3. Chen, P.; Liu, S.; Shi, C.; Hooi, B.; Wang, B.; Cheng, X. NeuCast: Seasonal Neural Forecast of Power Grid Time Series. In Proceedings of the Twenty-Seventh International Joint Conference on Artificial Intelligence, IJCAI 2018, Stockholm, Sweden, 13–19 July 2018; pp. 3315–3321. [Google Scholar]
  4. Nie, H.; Liu, G.; Liu, X.; Wang, Y. Hybrid of ARIMA and SVMs for Short-Term Load Forecasting. Energy Procedia 2012, 16, 1455–1460. [Google Scholar] [CrossRef] [Green Version]
  5. Box, G.E.; Jenkins, G.M.; Reinsel, G.C.; Ljung, G.M. Time Series Analysis: Forecasting and Control; John Wiley & Sons: Hoboken, NJ, USA, 2015. [Google Scholar]
  6. Nedellec, R.; Cugliari, J.; Goude, Y. GEFCom2012: Electric load forecasting and backcasting with semi-parametric models. Int. J. Forecast. 2014, 30, 375–381. [Google Scholar] [CrossRef]
  7. Guyon, I.; Sun-Hosoya, L.; Boullé, M.; Escalante, H.J.; Escalera, S.; Liu, Z.; Jajetic, D.; Ray, B.; Saeed, M.; Sebag, M.; et al. Analysis of the AutoML Challenge Series 2015–2018. In Automated Machine Learning; Springer: Berlin, Germany, 2019; pp. 177–219. [Google Scholar]
  8. Shi, X.; Mueller, J.; Erickson, N.; Li, M.; Smola, A. Multimodal AutoML on Structured Tables with Text Fields. In Proceedings of the 8th ICML Workshop on Automated Machine Learning (AutoML), Virtual, 23–24 June 2021. [Google Scholar]
  9. Wang, C.; Bäck, T.; Hoos, H.H.; Baratchi, M.; Limmer, S.; Olhofer, M. Automated Machine Learning for Short-term Electric Load Forecasting. In Proceedings of the 2019 IEEE Symposium Series on Computational Intelligence (SSCI), Xiamen, China, 6–9 December 2019; pp. 314–321. [Google Scholar]
  10. Christ, M.; Kempa-Liehr, A.W.; Feindt, M. Distributed and parallel time series feature extraction for industrial big data applications. arXiv 2016, arXiv:1610.07717. [Google Scholar]
  11. Hong, T.; Fan, S. Probabilistic electric load forecasting: A tutorial review. Int. J. Forecast. 2016, 32, 914–938. [Google Scholar] [CrossRef]
  12. Li, L.; Dai, S.; Cao, Z.; Hong, J.; Jiang, S.; Yang, K. Using improved gradient-boosted decision tree algorithm based on Kalman filter (GBDT-KF) in time series prediction. J. Supercomput. 2020, 76, 6887–6900. [Google Scholar] [CrossRef]
  13. Candanedo, L.M.; Feldheim, V.; Deramaix, D. Data driven prediction models of energy use of appliances in a low-energy house. Energy Build. 2017, 140, 81–97. [Google Scholar] [CrossRef]
  14. Taieb, S.B.; Bontempi, G.; Atiya, A.F.; Sorjamaa, A. A review and comparison of strategies for multi-step ahead time series forecasting based on the NN5 forecasting competition. Expert Syst. Appl. 2012, 39, 7067–7083. [Google Scholar] [CrossRef] [Green Version]
  15. Ferreira, L.B.; da Cunha, F.F. Multi-step ahead forecasting of daily reference evapotranspiration using deep learning. Comput. Electron. Agric. 2020, 178, 105728. [Google Scholar] [CrossRef]
  16. Sorjamaa, A.; Lendasse, A. Time series prediction using DirRec strategy. In Proceedings of the ESANN 2006, 14th European Symposium on Artificial Neural Networks, Bruges, Belgium, 26–28 April 2006; pp. 143–148. [Google Scholar]
  17. Coyle, D.; Prasad, G.; McGinnity, T.M. A time-series prediction approach for feature extraction in a brain-computer interface. IEEE Trans. Neural Syst. Rehabil. Eng. 2005, 13, 461–467. [Google Scholar] [CrossRef] [PubMed]
  18. Phinyomark, A.; Quaine, F.; Charbonnier, S.; Serviere, C.; Tarpin-Bernard, F.; Laurillau, Y. Feature extraction of the first difference of EMG time series for EMG pattern recognition. Comput. Methods Programs Biomed. 2014, 117, 247–256. [Google Scholar] [CrossRef] [PubMed]
  19. Christ, M.; Braun, N.; Neuffer, J.; Kempa-Liehr, A.W. Time series feature extraction on basis of scalable hypothesis tests (tsfresh—A python package). Neurocomputing 2018, 307, 72–77. [Google Scholar] [CrossRef]
  20. Lubba, C.H.; Sethi, S.S.; Knaute, P.; Schultz, S.R.; Fulcher, B.D.; Jones, N.S. catch22: CAnonical Time-series CHaracteristics. arXiv 2019, arXiv:1901.10200. [Google Scholar] [CrossRef] [Green Version]
  21. Fulcher, B.D.; Jones, N.S. hctsa: A computational framework for automated time-series phenotyping using massive feature extraction. Cell Syst. 2017, 5, 527–531. [Google Scholar] [CrossRef] [PubMed]
  22. Zoph, B.; Vasudevan, V.; Shlens, J.; Le, Q.V. Learning Transferable Architectures for Scalable Image Recognition. In Proceedings of the 2018 IEEE Conference on Computer Vision and Pattern Recognition, CVPR 2018, Salt Lake City, UT, USA, 18–22 June 2018; pp. 8697–8710. [Google Scholar]
  23. Bisong, E. Google automl: Cloud natural language processing. In Building Machine Learning and Deep Learning Models on Google Cloud Platform; Springer: Berlin, Germany, 2019; pp. 599–612. [Google Scholar]
  24. Wang, C.; Baratchi, M.; Bäck, T.; Hoos, H.H.; Limmer, S.; Olhofer, M. Towards time-series-specific feature engineering in automated machine learning frameworks. 2022; under review. [Google Scholar]
  25. Feurer, M.; Klein, A.; Eggensperger, K.; Springenberg, J.; Blum, M.; Hutter, F. Efficient and Robust Automated Machine Learning. In Advances in Neural Information Processing Systems 28; Curran Associates, Inc.: Montreal, QC, Canada, 7–12 December 2015; pp. 2962–2970. [Google Scholar]
  26. Jin, H.; Song, Q.; Hu, X. Auto-Keras: An Efficient Neural Architecture Search System. In Proceedings of the 25th ACM SIGKDD International Conference on Knowledge Discovery & Data Mining, Anchorage, AK, USA, 4–8 August 2019; ACM: New York, NY, USA, 2019; pp. 1946–1956. [Google Scholar]
  27. Thornton, C.; Hutter, F.; Hoos, H.H.; Leyton-Brown, K. Auto-WEKA: Combined Selection and Hyperparameter Optimization of Classification Algorithms. In KDD’13, Proceedings of the 19th ACM SIGKDD International Conference on Knowledge Discovery and Data Mining, Chicago, IL, USA, 11–14 August 2013; ACM: New York, NY, USA, 2013; pp. 847–855. [Google Scholar]
  28. Taieb, S.B.; Bontempi, G. Recursive Multi-step Time Series Forecasting by Perturbing Data. In Proceedings of the 11th IEEE International Conference on Data Mining, ICDM 2011, Vancouver, BC, Canada, 11–14 December 2011; pp. 695–704. [Google Scholar] [CrossRef]
  29. Benjamini, Y.; Hochberg, Y. Controlling the false discovery rate: A practical and powerful approach to multiple testing. J. R. Stat. Soc. Ser. B (Methodol.) 1995, 57, 289–300. [Google Scholar] [CrossRef]
  30. Fulcher, B.D.; Lubba, C.H.; Sethi, S.S.; Jones, N.S. CompEngine: A self-organizing, living library of time-series data. arXiv 2019, arXiv:1905.01042. [Google Scholar]
  31. Januschowski, T.; Gasthaus, J.; Wang, Y.; Salinas, D.; Flunkert, V.; Bohlke-Schneider, M.; Callot, L. Criteria for classifying forecasting methods. Int. J. Forecast. 2020, 36, 167–177. [Google Scholar] [CrossRef]
  32. Bergstra, J.; Bengio, Y. Random Search for Hyper-Parameter Optimization. J. Mach. Learn. Res. 2012, 13, 281–305. [Google Scholar]
  33. Oreshkin, B.N.; Carpov, D.; Chapados, N.; Bengio, Y. N-BEATS: Neural basis expansion analysis for interpretable time series forecasting. arXiv 2019, arXiv:1905.10437. [Google Scholar]
  34. Siami-Namini, S.; Tavakoli, N.; Namin, A.S. A Comparison of ARIMA and LSTM in Forecasting Time Series. In Proceedings of the 17th IEEE International Conference on Machine Learning and Applications, ICMLA, Orlando, FL, USA, 17–20 December 2018; pp. 1394–1401. [Google Scholar]
  35. Zhang, X.; Shen, F.; Zhao, J.; Yang, G. Time Series Forecasting Using GRU Neural Network with Multi-lag After Decomposition. In Proceedings of the Neural Information Processing—24th International Conference, ICONIP 2017, Guangzhou, China, 14–18 November 2017; Springer: Berlin, Germany, 2017; Volume 10638, pp. 523–532. [Google Scholar]
  36. Yamak, P.T.; Yujian, L.; Gadosey, P.K. A comparison between arima, lstm, and gru for time series forecasting. In Proceedings of the 2019 2nd International Conference on Algorithms, Computing and Artificial Intelligence, Sanya, China, 20–22 December 2019; pp. 49–55. [Google Scholar]
  37. Mann, H.B.; Whitney, D.R. On a test of whether one of two random variables is stochastically larger than the other. Ann. Math. Stat. 1947, 18, 50–60. [Google Scholar] [CrossRef]
Figure 1. Workflow of auto-sklearn. Auto-sklearn uses Bayesian optimisation to search the space of ML pipelines, including a preprocessor, feature preprocessor and ML components.
Engproc 18 00017 g001
Figure 2. Workflow of our customised search space of Auto-Keras for TS forecasting. The input data flows through the RNN Block. Hyperparameters, such as the number of layers and learning rate, will be optimised during the search. The Regression Head then generates output based on the information from the RNN Block.
Engproc 18 00017 g002
Table 1. RMSE on test set acquired from traditional ML baselines. GBM-recursive, GBM-multiout, SVM-recursive, and SVM multioutput win on 6, 6, 0, and 8 out of 20 data sets respectively.
DatasetRMSE (GBM
-Recursive)
RMSE (GBM
-Multioutput)
RMSE (SVM
-Recursive)
RMSE (SVM
-Multioutput)
Autoregre noise0.4588900.4615580.4845160.459410
Correlated noise1.8721761.8621372.0129162.004572
Lorenz Attractor0.1023230.0880450.1882230.152384
Pendulum0.1120410.1045190.1721180.035350
Driven oscillator0.1216060.1247010.2316610.224206
Two-well oscillator0.0339500.0324620.0753180.007772
Duffing oscillator0.0258300.0213300.0753080.013762
Moving average0.6297910.6271760.6414530.622803
Nonstationary6.0497965.9876316.7962466.448516
Random walk12.76656113.69075330.59455325.654821
Crude oil prices28.21500832.90949042.27800320.867176
ECG79.209558103.881034128.420743126.1525026
Exchange rate0.0068800.0068230.0285710.005433
Gas prices102.819893100.612148166.021626172.605827
Human speech0.0593650.0548380.0850020.057631
Macroeconomics779.515969806.704035713.073168713.363569
Microeconomics647.432403705.0518793500.0942383865.235605
Music0.0828640.0760470.0683410.052978
Tropical sound0.0094680.0062850.0349250.008820
Zooplankton312.033380385.377067319.839856320.049399
Table 2. RMSE on test set acquired from different AutoML methods including vanilla auto-sklearn (VA), our proposed variants (W, T, and WT), Auto-Keras and the state-of-the-art method N-BEATS. The accuracy of N-BEATS, Auto-Keras, VA, W, T, WT are statistically significant on 5, 0, 2, 8, 3, and 3 out of 20 data sets, respectively.
RMSE
(N-BEATS)
RMSE
(Auto-Keras)
RMSE (VA)RMSE (W)RMSE (T)RMSE (WT)
Autoregre noise0.491133
± 0.001470
0.468036 0.454026
± 0.000502
0.453002
± 0.000137 *
0.464252
± 0.000286
0.463611
± 0.000302
Correlated noise 1.949831
± 0.012037
1.848905 1.832344
± 0.003727
1.822611
± 0.0009631 *
1.841418
± 0.000878
1.843744
± 0.000858
Lorenz Attractor 0.076379
± 0.007143
1.248956 0.050628
± 0.009272
0.039705
± 0.003994 *
0.140621
± 0.081695
0.249406
± 0.012638
Pendulum 0.113806
± 0.010232
0.512860 0.055285
± 0.020322
0.021416
± 0.022933 *
0.154815
± 0.100197
0.177645
± 0.048287
Driven oscillator 0.101795
± 0.006627
0.232306 0.094895
± 0.010350
0.085300
± 0.005317
0.061014
± 0.001292 *
0.149184
± 0.003854
Two-well oscillator 0.010395
± 0.000897 *
0.201339  0.032185
± 0.006572
0.033103
± 0.000724
0.019638
± 0.001726
0.057722
± 0.009568
Duffing oscillator  0.004316
± 0.001006 *
0.500197 0.011301
± 0.011301
0.010777
± 0.000844
0.020875
± 0.000919
0.019648
± 0.001661
Moving average 0.662554
± 0.002471
0.610291  0.615606
± 0.000661
0.614169
± 0.000080
0.609240
± 0.000326
0.608775
± 0.000241 *
Nonstationary 6.253612
± 0.034291
9.888761  5.775404
± 0.048135 *
5.783582
± 0.012927 *
6.720498
± 0.023618
6.826646
± 0.022398
Random walk 3.099224
± 0.058073 *
19.385011  13.478998
± 0.172438
13.240742
± 0.138406
14.765951
± 0.843100
15.411989
± 0.368020
Crude oil prices 32.199970
± 0.846056 *
44.305246 34.766214
± 0.702608
34.669098
± 0.374047
33.134671
± 0.228864
35.373982
± 0.209542
ECG 143.617378
± 7.120182
149.577016  96.577900
± 3.258370 *
102.0317220
± 14.282081
104.228003
± 1.6258357
103.260689
± 2.110540
Exchange rate 0.004831
± 0.001875
0.013859  0.006049
± 0.000130
0.003627
± 0.001326 *
0.006886
± 0.000237
0.004569
± 0.001505
Gas prices 59.147486
± 3.122861 *
126.112217 118.033606
± 25.754493
101.514037
± 0.021932
109.711360
± 4.170307
121.133289
± 1.387935
Human speech 0.089423
± 0.001085
0.065285 0.061140
± 0.001988
0.061280
± 0.002512
0.058722
± 0.000191
0.057920
± 0.000288 *
Macroeconomics  755.905175
± 11.131619
711.622796  791.586127
± 37.469871
766.036513
± 31.082581
682.959633
± 3.559769
662.098158
± 24.511173 *
Microeconomics 2179.375169
± 6643.906258
5545.979242 805.637017
± 61.049526
733.760632
± 12.795080 *
1295.531031
± 34.305972
1348.425680
± 264.961810
Music  0.078767
± 0.001062
0.091060 0.085224
± 0.005985
0.072422
± 0.002119
0.068895
± 0.000906 *
0.084715
± 0.002951
Tropical sound  0.010038
± 0.000203
0.010660  0.008483
± 0.000072
0.008407
± 0.000013 *
0.008930
± 0.000029
0.008717
± 0.000044
Zooplankton 306.329197
± 2.591637
310.290963 297.091504
± 2.118263
282.485896
± 1.234165
278.597102
± 1.237304 *
301.160979
± 4.331423
Publisher’s Note: MDPI stays neutral with regard to jurisdictional claims in published maps and institutional affiliations.

