Proceeding Paper

Detection of Prostate Cancer Biomarker PCA3 with Electrochemical Apta-Sensor †

1
Material and Engineering Research Institute (MERI), Sheffield Hallam University, Sheffield S1 1WB, UK
2
Department of Chemistry, University of Sheffield, Brook Hill, Sheffield S3 7HF, UK
3
The Institute of Marine Engineering, Science and Technology, London SW1H 9JJ, UK
4
Biomolecular Sciences Research Centre (BMRC), Sheffield Hallam University, Sheffield S1 1WB, UK
*
Author to whom correspondence should be addressed.
Presented at the 2nd International Electronic Conference on Biosensors, 14–18 February 2022; Available Online: https://sciforum.net/event/IECB2022.
Eng. Proc. 2022, 16(1), 8; https://doi.org/10.3390/IECB2022-12257
Published: 14 February 2022
(This article belongs to the Proceedings of The 2nd International Electronic Conference on Biosensors)

Abstract

:
This is a continuation of our research into the development of novel biosensing technologies for early diagnostics of prostate cancer (PCa). The existing PCa diagnostics based on PSA detection (prostate cancer antigen) in blood serum often yield controversial outcomes and require improvement. At the same time, the long non-coded RNA transcript PCA3 overexpressed in PCa patients’ urine proved to be an ideal biomarker for PCa diagnosis, and recent research mainly focuses on developing biosensors for the detection of PCA3. One of the most promising directions in this research is the use of aptamers as bio-receptors for PCA3. We demonstrated the earlier great potential of electrochemical sensors exploiting aptamer labelled with redox group ferrocene. In this work, we use the RNA-based aptamer specific to 227 nt fragment of lncRNA PCA3 labelled with methylene blue redox label which offers a higher affinity to PCA3 than commonly used DNA-based aptamers. Before proceeding with biosensing experiments, the gold screen-printed electrodes were cleaned by CV scanning in a sulfuric acid solution, which removed surface contaminations and thus improved immobilization of aptamers. The quality of the gold surface was assessed by contact angle measurements. Moreover, the concentration of immobilized aptamers was optimized to achieve the best results in electrochemical measurements. Initial tests were carried out using cyclic voltammograms (CV) measurements and showed a correlation between oxidation/reductions peaks intensities and the concentration of PCA3. Such experiments proved the main concept of the proposed apta-sensing, e.g., the changes of aptamer secondary structure during binding the target (PCA3) resulting in redox labels coming closer to the electrode surface and thus increasing the charge transfer. The lowest recorded concentration of PCA3 was 0.01 nM in CV measurements, which is close to the LDL level for this method. Much more promising results were obtained with the electrochemical impedance spectroscopy (EIS) measurements, which showed remarkable features of increasing sensitivity at low concentrations of PCA3. The extrapolation of data below 0.05 nM level allowed estimating LDL of about 0.4 pM. The results obtained are very encouraging and constitute a major step towards developing a simple, reliable, and cost-effective diagnostic tool for the early detection of prostate cancer.

1. Introduction

Prostate cancer (PCa), also known as adenocarcinoma, is the most common worldwide type of cancer in men after lung cancer, and it is the second leading cause of mortality among men [1,2]. Clinically, the standard diagnostics test for detection of PCa is based on the detection and quantification of total serum prostate-specific antigen (tPSA) in serum, followed by further examinations such as digital rectal examination (DRE) and imaging investigations if PCa is suspected [3,4]. Despite the benefits of these tests, physicians still have difficulty identifying early-stage PCa due to its asymptomatic nature and/or symptoms resembling benign conditions, such as prostatic hyperplasia (BPH) [5]. Furthermore, PSA testing has limits in terms of specificity, accuracy, and sensitivity [6,7,8]. Hence, identifying other specific PCa biomarkers besides PSA for the detection of PCa is of high importance [9,10]. The long non-coding RNA (lncRNA) known as PCA3 overexpressed in PCa patients’ urine has been widely accepted as one of the specific biomarkers for malignant prostate cells [11,12,13]. PCA3 level can predict prostatic biopsies’ outcome, especially in combination with other PCa biomarkers such as PSA and can reduce the likelihood of false-positive results [14,15,16]. Prognesa® test, approved in USA in 2012, is based on detection of both PCA3 and PSA using quantitative nucleic acid amplification after digital rectal examination and yields a PCA3 score (the ratio of PCA3 to PSA mRNA molecules in urine specimens) [17,18]. However, such a test is time-consuming, expensive, and requires highly skilled operators. Biosensing techniques involving aptamers as bioreceptors, e.g., single-stranded RNA or DNA molecules with high affinity for target molecules, are alternatives to well-established immunosensors. A GC3 RNA aptamer against the 277 nt section of lncRNA transcript PCA3 was developed using SELEX process and reported by Marangoni et al. [19]. According to this study, the GC3 aptamer showed the highest affinity towards PCA3. From the transducer point of view, electrochemical sensors are the most attractive because of their high sensitivity, simplicity of operation and low cost [20,21,22]. The concept of detection of PCA3 using specific DNA-based aptamers labelled with redox group (ferrocene) was explained and proved in our recent publications [23,24].
This work is a further study of the implementation of electrochemical sensing combined with redox-labelled aptamers for the detection of PCA3. Here, we used the original GC3 RNA-based aptamer, which is supposed to provide higher specificity towards PCA3 target. It is also labelled with another redox chemical, e.g., methylene blue. Two electrochemical methods of cyclic voltammetry (CV) and electrochemical impedance spectroscopy (EIS) were exploited here using screen-printed gold electrodes (SPGE) and interdigitated gold electrodes (IDGE), respectively, and compared the sensitivity of detection with so-far published papers. The properties of the gold surface of these electrodes and its effect on electrochemical measurements were also assessed in this study. CV is a common electrochemical method for analysing redox reactions at the electrode surface [25], while EIS is a very sensitive method capable of detecting tiny changes in a double layer on the electrode surface [26]. The high sensitivity of EIS could be beneficial for apta-sensing and for the detection of PCA3, as has been shown in [24]. The results obtained are very encouraging and constitute a major step towards developing a simple, reliable, and cost-effective diagnostic tool for the early detection of prostate cancer.

2. Materials and Methods

2.1. Chemicals and Reagents

The CG RNA-based aptamer reproducing the following sequence of nucleotides 5′-AGUUUUUGCGUGUGCCCUUUUUGUCCCC-3′ published by the inventors [19] was customised by Merck Life Science Ltd. (Dorset, UK). This aptamer has been used in our previous work [23]. The methylene blue and thiol groups were attached to C5 and C3 termini, respectively. The target analyte, e.g., the 277 nt fragment of lncRNA PCA3 was purchased from Eurofins Scientific (Guildford, UK branch) and prepared in PBS (pH 7.5).
HEPES binding buffer (HBB) pH 7.6, sodium phosphate di-basic (Na2HPO4), potassium phosphate mono-basic (KH2PO4), potassium chloride (KCl), magnesium chloride (MgCl2), dithiothreitol (DTT), and sodium chloride (NaCl), were procured from Sigma-Aldrich (Gillingham, UK). All reagents were of analytical grade. The target analyte, e.g., the 277 nt fragment of lncRNA PCA3 was purchased from Eurofins Scientific (Guildford, UK) and prepared in PBS (pH 7.5). All aqueous solutions were prepared using 18.2 MΩ·cm deionized (DI) water (Millipore, Watford, UK). The methylene blue labelled CG RNA based aptamer [19], which was used in our previous work [23], was acquired from Merck Life Science Ltd. (London branch, UK). The methylene blue and thiol groups were attached to C5 and C3 termini, respectively.

2.2. Measurements and Instrumentation

Three-electrode gold screen-printed assemblies (AT) with Ag/AgCl reference electrodes with 4 mm diameter working electrodes from DropSens Metrohm (Runcorn, UK) were used for CV measurements with Dropsens potentiostat Stat8000. Voltage ranges from −0.4 to 0.2 V with the step of 10 mV and scan rate of 40 mV/s were used. CV cycles were recorded 5 times until the current readings were stabilized. In addition to cyclic voltammetry, the time dependencies of cathodic current at −0.25 V were recorded on electrodes during exposure to PCA3 of different concentrations for kinetic study of the PCA3 to aptamer binding. Interdigitated gold electrodes having 50 fringes with the spacing of 5 μm were used for EIS measurements with Parastate 4000 impedance analyzer. The AC signal of 50 mV amplitude (and zero DC bias) with the frequency varied from 0.1 Hz to 100 kHz was used in these measurements. Moreover, the sessile drop method was used in water contact angle measurements with OCA 15EC Goniometer. DI water 10 μL drops were dispensed on top of the electrode surface, and the droplet microscopic images were captured and analysed using built-in software.

2.3. Immobilization of Aptamers and Preparation for CV and EIS Measurements

The aptamers were immobilized on the surface of both types of electrodes (SPGE and IDGE) following the procedure described in detail in our earlier publications [24,27]. Extra cleaning of the electrodes method has been done using CV cleaning scans in 0.1 M H2SO4 until the gold oxide reduction peak no longer increased in size. Such treatment removes surface contaminants without damaging the gold surface as described in [20].
This additional cleaning procedure has resulted in consistent and a smooth electrode surface. The target analyte (PCA3) was resuspended in detection buffer (HEPES pH 7.5, 120 mm NaCl, 5 mm KCl,) at different concentrations from 100 nM down to 0.01 nM and were used in both CV and EIS measurements.

3. Results and Discussion

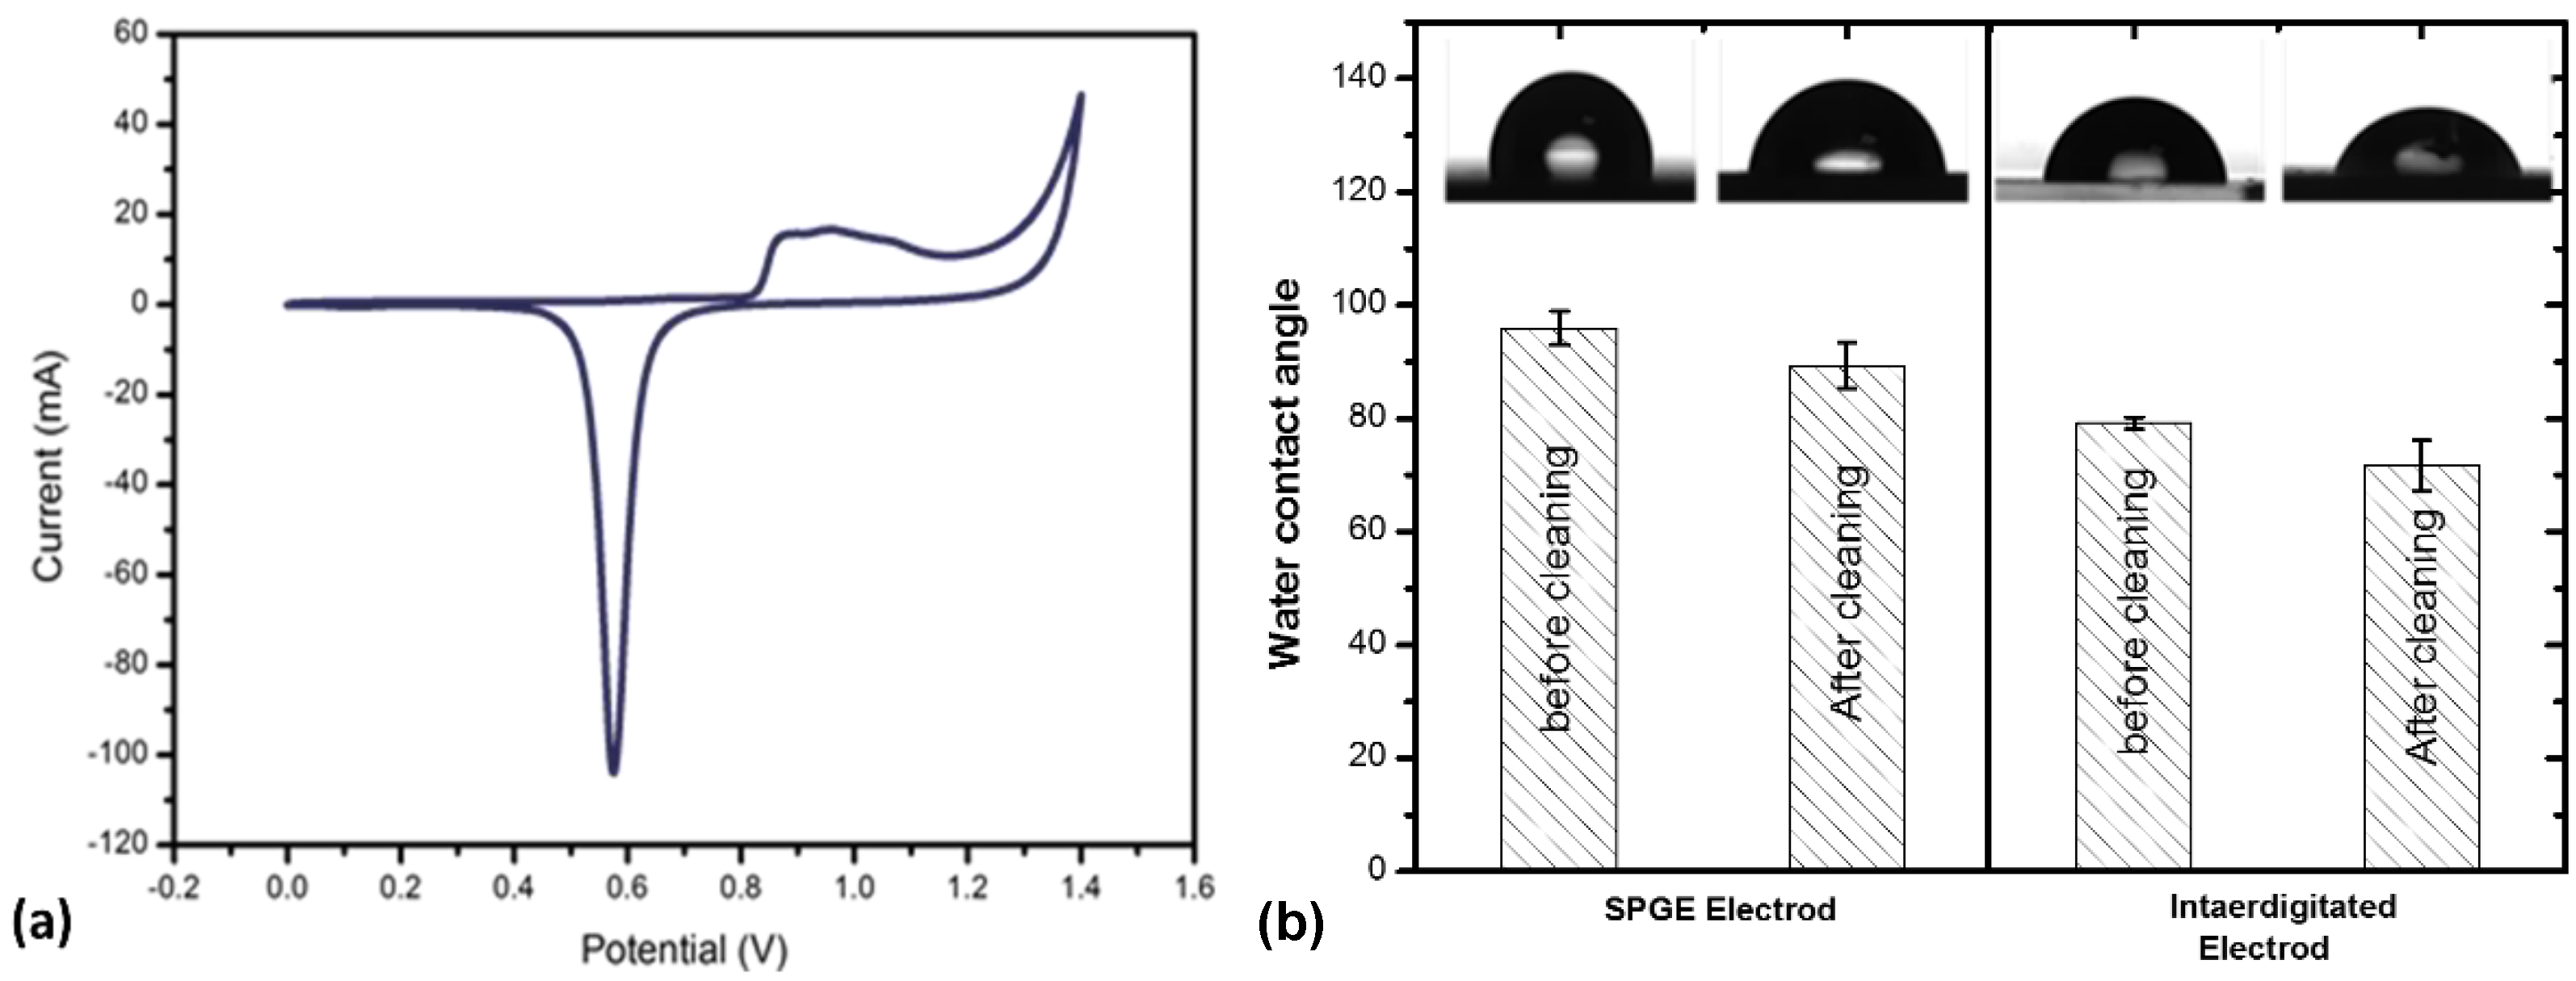
3.1. Characterization of Gold Electrodes after Cleaning

Characterization of gold surface wettability before and after CV cleaning in 0.1 mM H2SO4 solution was carried out by contact angle measurement. Figure 1a shows a typical CV of SPGE during cleaning, similar to that described in [20]. Figure 1b shows the effect of CV cleaning on the wettability of various gold electrodes surfaces using the contact angle measurement data. Images of water droplets are shown below.
Since the cleaning methodology is essential, as is described in [28]. A minimum of three sets of measurements were performed across the surface of each sample. The homogeneity and structure of the gold electrode surface influence the peak currents in CV and amperometry detection [29]. For this reason, the gold electrode surface must be cleaned before the immobilization of aptamers. The final stabilized CV curve after 10 cycles of cleaning is shown in Figure 1a. The reduction in contact angles for both electrodes AT SPGE and IDGE after cleaning indicates better wettability of the gold surface is shown in Figure 1b.

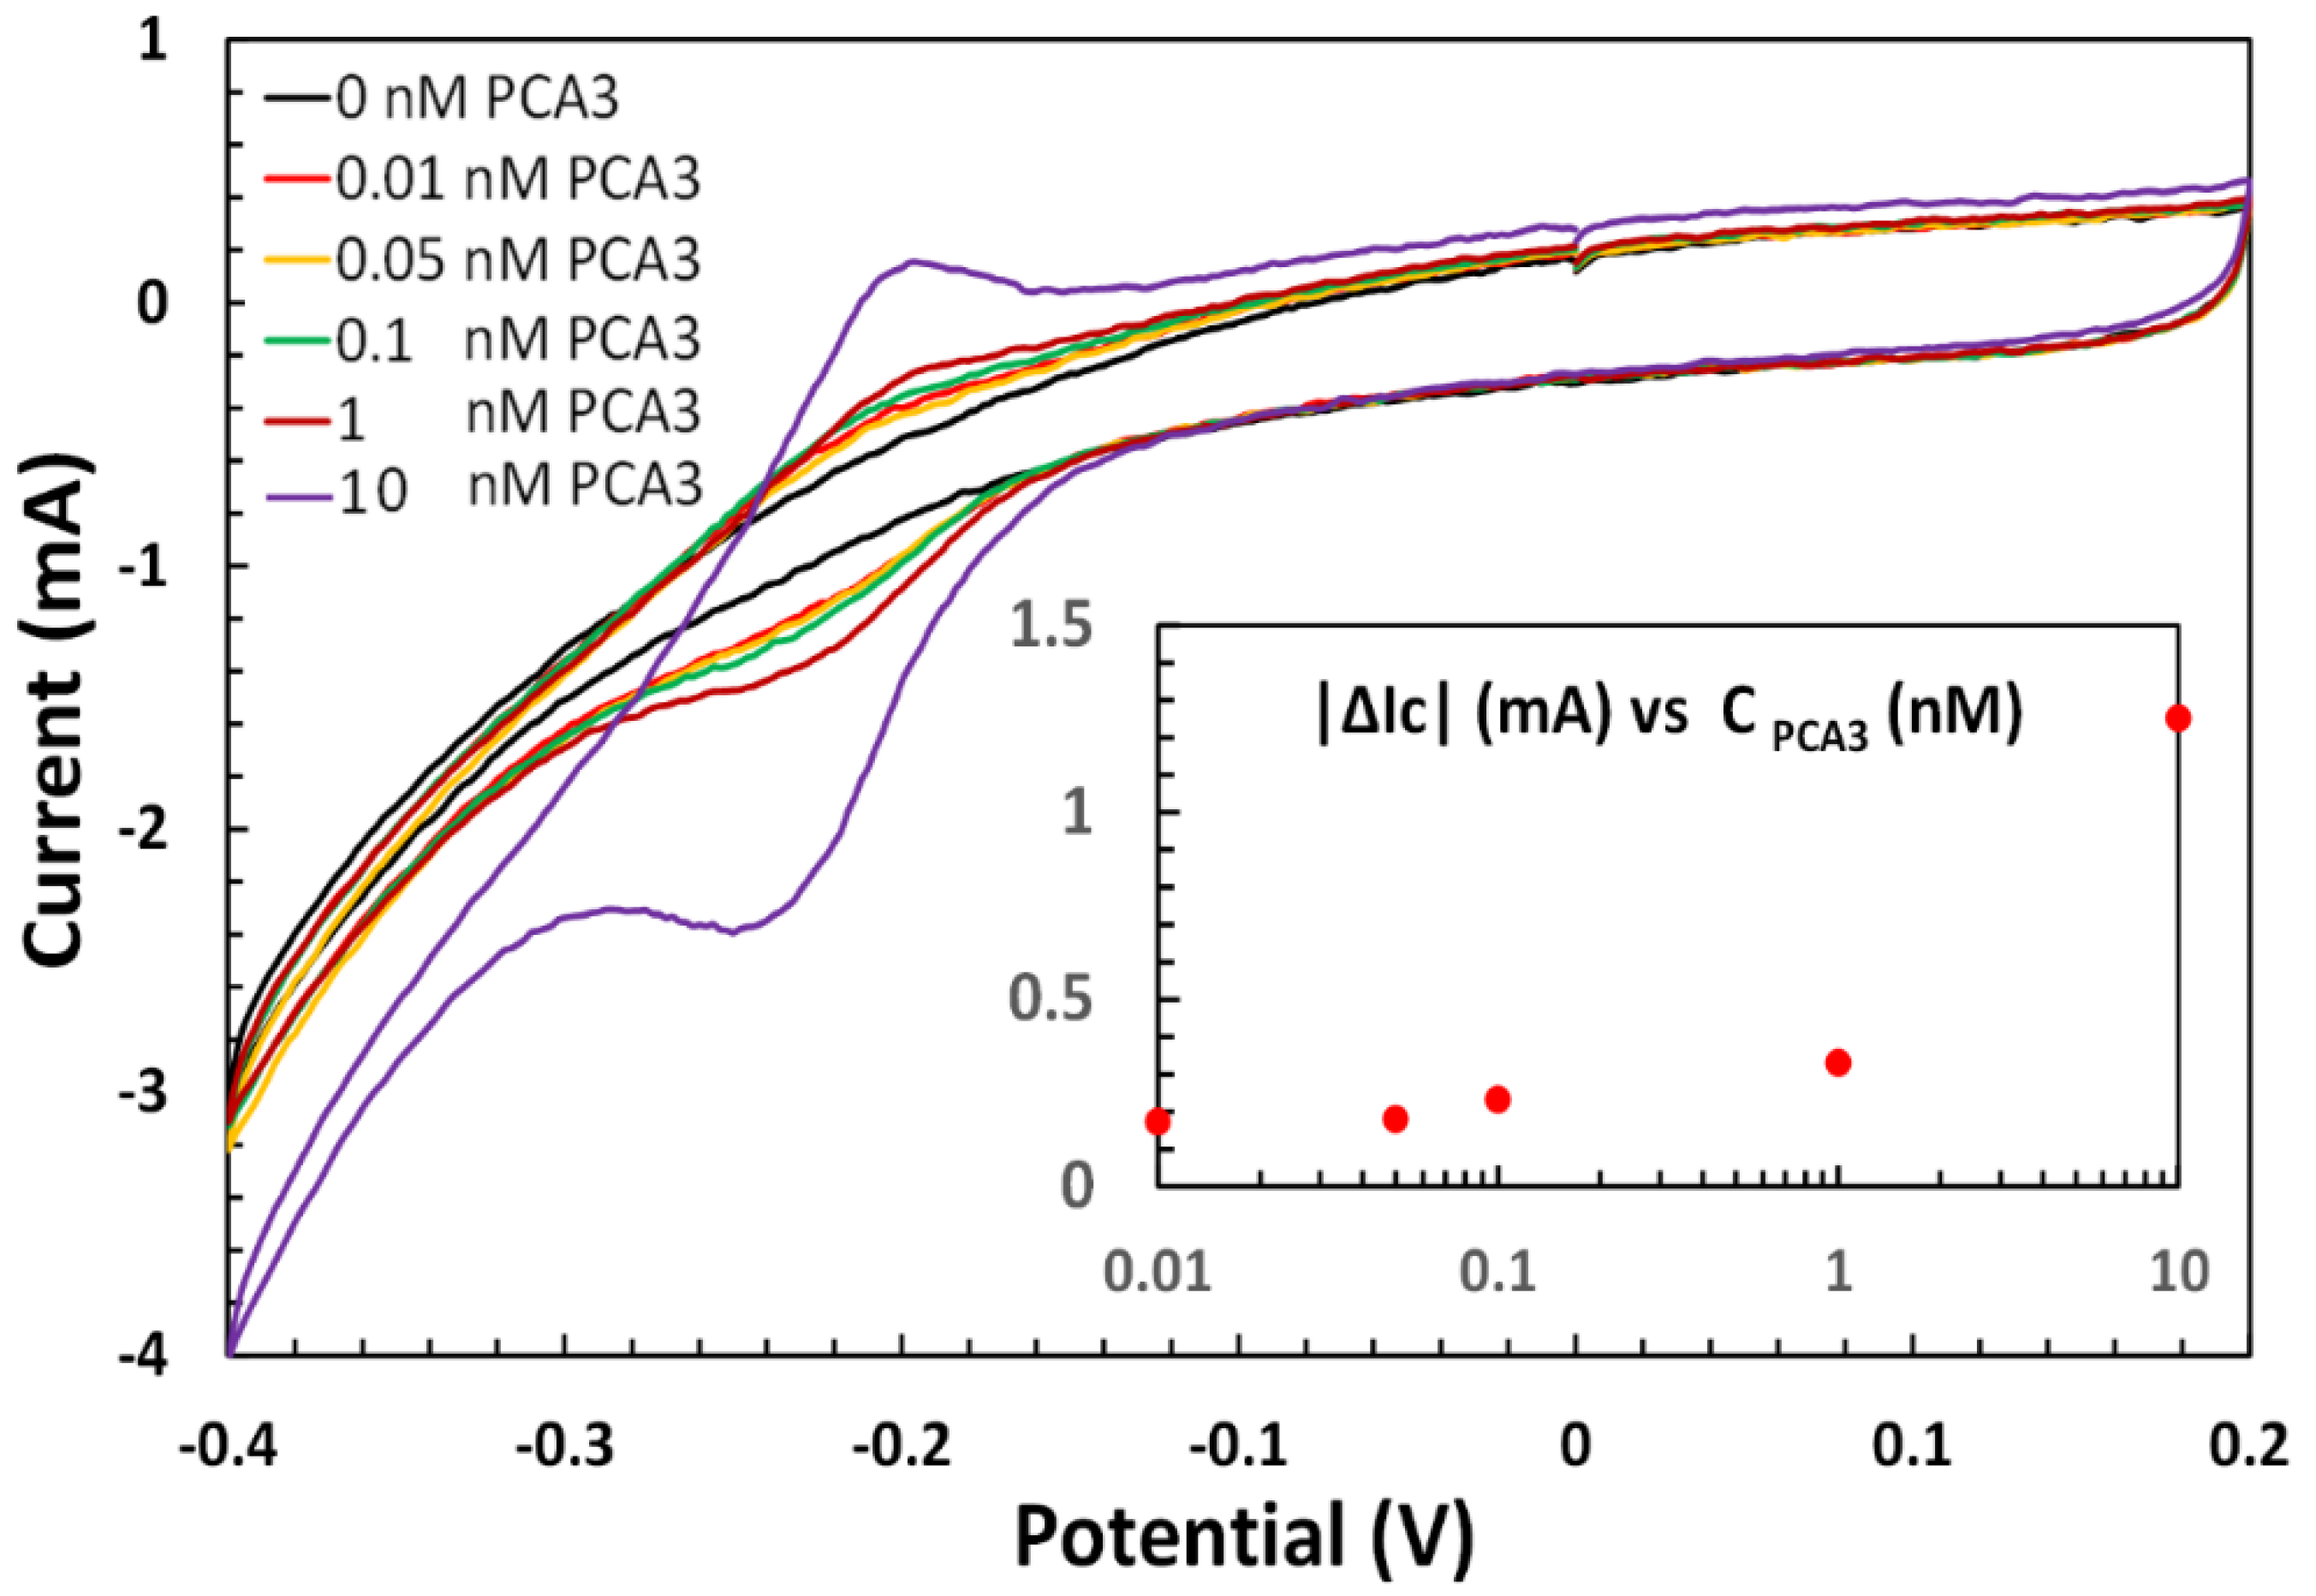
3.2. Electrochemical Apta-Sensing of PCA3

Typical CV curves were recorded on SPGE with immobilized aptamers before and after exposure to PCA3 of different concentrations, as shown in Figure 2. The characteristic oxidation and reduction peaks of methylene blue appeared on all CV curves at around −0.2 and −0.25 V, respectively. The intensity of redox current peaks varied dramatically depending on the concentration of PCA3 bound to aptamers. Initial peaks for aptamers appear as small humps on CV curves. The intensity of these peaks increases progressively with the increase in PCA3 concentration. This trend can be observed clearly on the inset in Figure 2, showing concentration dependence of the absolute values of changes in cathodic current at −0.25 V. The values of |ΔIc| were calculated by subtracting the baseline Ic value for pure aptamer from Ic values corresponding to different concentrations of PCA3.
The graph in Figure 2 (inset) represents the beginning of a standard sigmoid curve. The saturation of the sensor response could be achieved at much larger concentrations of PCA3. At low concentrations of PCA3 the response is almost flattened between 0.05 and 0.01 nM, which means that the LDL can be estimated as 0.05 nM. This value corresponds to 0.125 ng/mL, considering the molecular weight of about 2.5 kD for a 78 bp fragment of lncRNA PCA3), which is close to LDL = 0.1 ng/mL evaluated previously [24] for CV measurements for ferrocene-labelled aptamer. It should be noted that the lowest concentration of PCA3 detected on SPGE before CV cleaning was only 0.1 nM. Therefore, electrodes’ cleaning resulted in 5 to 10 folds increase in the sensitivity. The optimal concentration of aptamers yielding less noisy CV graphs was 1 μM.

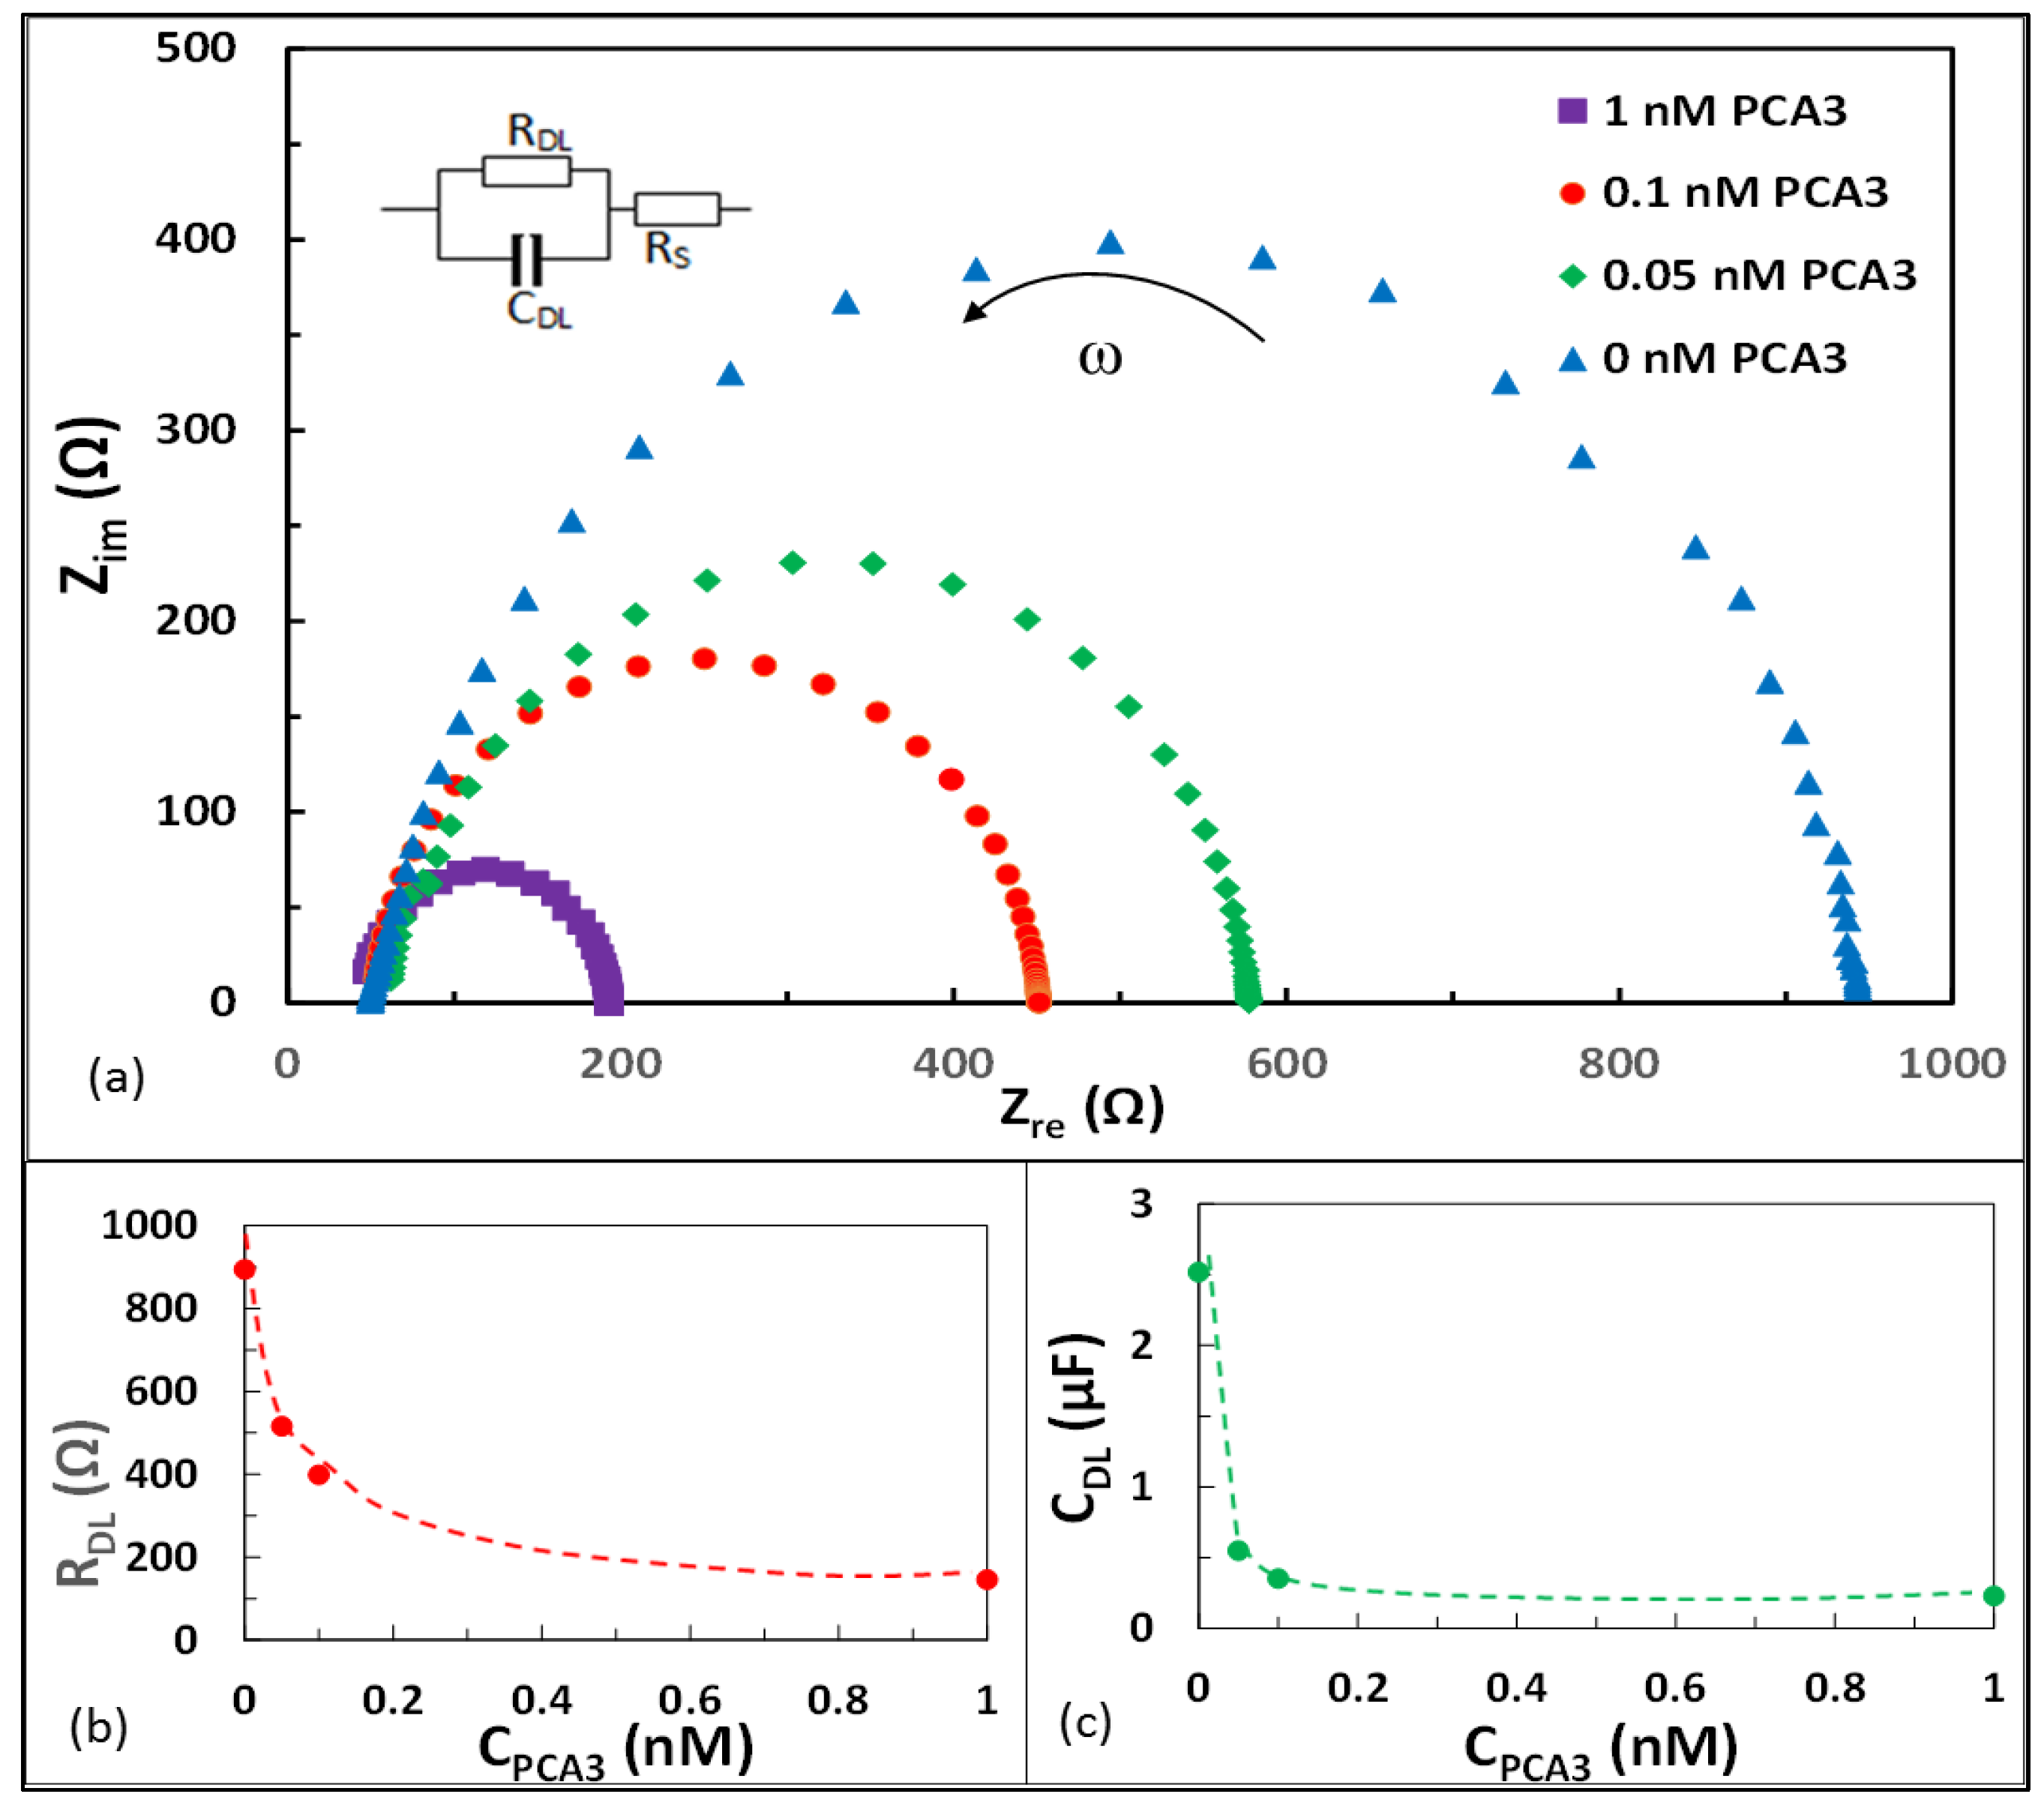
3.3. Electrochemical Impedance Spectroscopy (EIS)

The results of EIS measurements are presented in Figure 3 as the dependencies of the imaginary ( Z i m ) vs real ( Z r e )   parts of impedance known as Nyquist plots. As one can see, all Nyquist plots recorded on IDGE with immobilized aptamers before and after exposure to different concentrations of PCA3 appear as almost ideal semi-circles with the anticlockwise direction of AC frequency increase. This is a clear indication of the negligible contribution of diffusion of redox chemicals to the electrode surface, which is obvious since the redox labels are attached to aptamers. Therefore, the behaviour of IDGE modified with redox-labelled aptamers can be described by a simplified (without diffusion impedance) equivalent circuit shown as an inset in Figure 3a. The sizes (diameters) of Nyquist semi-circles correlate with the concentration of PCA3 bound to the aptamers. The layer of fresh aptamers shows the largest diameter, which decreases with an increase in PCA3 concentration.
Analysis of Nyquist graphs is based on the formula of electrical impedance (Z) of a simplified equivalent circuit (see inset in Figure 3a) described earlier [24]:
Z = Z r e j Z i m ;       Z r e = R D L 1 + ω 2 R D L 2 C D L 2 + R S   ;           Z i m = ω R D L 2 C D L 1 + ω 2 R D L 2 C D L 2   ,
where Z r e   and   Z i m are respectively the real and imaginary parts of impedance, which depend on the resistance and capacitance of a double layer ( R D L   and   C D L ) and bulk resistance of the solution ( R S )   as well as the frequency (ω) of AC signal. Analysis of the above equation gives at low frequencies ( ω 0 ) Z r e 0 = R D L + R S     and   Z i m o = 0 , while at high frequencies ( ω ) Z r e = R S and Z i m = 0 . Therefore, the characteristic parameter of double-layer resistance R D L can be calculated as R D L = R r e o Z R e .
On the other hand, the capacitance of a double layer (CDL) can be calculated from the maximal values of Z i m m a x 1 / ω C D L .
The values of R D L   and   C D L were calculated from the Nyquist plots in Figure 3a for all concentrations of PCA3, including zero concentration corresponding to the aptamer layer before binding PCA3, and the results are given in Figure 3b,c. As one can see from Figure 3b,c, the sensitivity of detection increases with the decrease in PCA3 concentration, which is opposite to CV measurements (see inset in Figure 2). Unfortunately, it is impossible to precisely evaluate the LDL of EIS measurements because the lowest concentration of PCA3 was only 0.05 nM. However, it is possible to estimate the LDL from the slope of the RDL vs CPCA3 graph at low concentrations (between 0.05 and 0 nM) in Figure 3b. The gradient of this graph ΔCPCA3RDL = 0.05/378.7 = 1.3 × 10⁻⁴ nM/Ω, therefore assuming the triple noise level of about 3 Ω, the LDL can be estimated as 0.4 pM. A similar estimation of LDL can be done from the CDL vs CPCA3 graph in Figure 3c. The gradient ΔCPCA3CDL = 0.05/2.5 = 0.02 nM/µF. Assuming the triple noise level of 0.01 µF, the LDL of 0.2 pM can be estimated.

4. Conclusions

The results obtained in this work proved a concept of electrochemical detection of prostate cancer marker PCA3 using RNA-based aptamers labelled with methylene blue redox group. The mechanism of detection is based on the increasing of charge transfer between the redox label and the electrode because of aptamers engulfing the target molecules (PCA3) and bringing redox labels (methylene blue) closer to the electrode surface. One of the main advantages of such an approach is the absence of redox chemicals in solution, which may allow performing tests on real samples of urine in future. Cyclic voltammogram measurements resulted in moderate LDL values between 0.05 and 0.01 nM, similar to the values obtained in our previous work on DNA-based aptamers labelled with ferrocene [25]. Such sensitivity should be sufficient for clinical use. However, EIS method appeared to be much more promising because of a different nature of the sensor response having the sensitivity increasing at low concentrations. The absence of redox chemicals in the solution allowed using a simplified model for EIS data analysis, which resulted in a correlation between both the resistance and capacitance of a double layer on the electrode surface and the concentration of PCA3 consistent with the above model of aptasensing. Our estimations showed that LDL for EIS measurements could be in sub-pM range. Additionally, some important technological steps of sensors preparation, such as electrochemical cleaning of gold screen-printed electrodes and optimization of the aptamer concentration for immobilization on the surface of gold, were implemented. Overall, this work is a major step towards the future development of a novel methodology of prostate cancer diagnostics. This work is ongoing and focuses on more detailed CV and EIS measurements in a wide range of PCA3 concentrations, statistical analysis of data, and more precise evaluation of LDL. PCA3 detection in complex media such as urine will be attempted.

Author Contributions

All authors contribute to the manuscript equally. All authors have read and agreed to the published version of the manuscript.

Funding

This research received no external funding.

Institutional Review Board Statement

Not applicable.

Informed Consent Statement

Not applicable.

Data Availability Statement

The data are not publicly available; The data files are stored on corresponding instruments and on personal computers.

Acknowledgments

We would like to acknowledge Sheffield Hallam University, UK, specifically material and engineering research institute (MERI) and, Biomolecular Sciences Re-search Centre (BMRC), in City Campus, Howard Street, Sheffield, S1 1WB, for full access to its resources and material in this research.

Conflicts of Interest

The authors declare no conflict of interest.

References

  1. Ferlay, J.; Soerjomataram, I.; Dikshit, R.; Eser, S.; Mathers, C.; Rebelo, M.; Parkin, D.M.; Forman, D.; Bray, F. Cancer incidence and mortality worldwide: Sources, methods and major patterns in GLOBOCAN 2012. Int. J. Cancer 2015, 136, E359–E386. [Google Scholar] [CrossRef] [PubMed]
  2. Sung, H.; Ferlay, J.; Siegel, R.L.; Laversanne, M.; Soerjomataram, I.; Jemal, A.; Bray, F. Global Cancer Statistics 2020: GLOBOCAN Estimates of Incidence and Mortality Worldwide for 36 Cancers in 185 Countries. CA Cancer J. Clin. 2021, 71, 209–249. [Google Scholar] [CrossRef]
  3. Salman, J.W.; Schoots, I.G.; Carlsson, S.V.; Jenster, G.; Roobol, M.J. Prostate Specific Antigen as a Tumor Marker in Prostate Cancer: Biochemical and Clinical Aspects. In Advances in Cancer Biomarkers; Springer: Dordrecht, The Netherlands, 2015; Volume 867, pp. 93–114. ISBN 9789401772150. [Google Scholar]
  4. Buzzoni, C.; Auvinen, A.; Roobol, M.J.; Carlsson, S.; Moss, S.M.; Puliti, D.; de Koning, H.J.; Bangma, C.H.; Denis, L.J.; Kwiatkowski, M.; et al. Metastatic Prostate Cancer Incidence and Prostate-specific Antigen Testing: New Insights from the European Randomized Study of Screening for Prostate Cancer. Eur. Urol. 2015, 68, 885–890. [Google Scholar] [CrossRef] [Green Version]
  5. Daniyal, M.; Siddiqui, Z.A.; Akram, M.; Asif, H.M. MINI-REVIEW Epidemiology. Etiol. Diagn. Treat. Prostate Cancer 2014, 15, 9575–9578. [Google Scholar]
  6. Heijnsdijk, E.A.M.; der Kinderen, A.; Wever, E.M.; Draisma, G.; Roobol, M.J.; de Koning, H.J. Overdetection, overtreatment and costs in prostate-specific antigen screening for prostate cancer. Br. J. Cancer 2009, 101, 1833–1838. [Google Scholar] [CrossRef] [PubMed] [Green Version]
  7. Aslan, G.; Irer, B.; Cimen, S.; Goktay, Y.; Celebi, I.; Tuna, B.; Yorukoglu, K. The Performance of Abnormal Digital Rectal Examination for the Detection of Prostate Cancer at Stratified Prostate Specific Antigen Levels. Open J. Urol. 2011, 1, 67–71. [Google Scholar] [CrossRef] [Green Version]
  8. Hussain, S.; Gunnell, D.; Donovan, J.; McPhail, S.; Hamdy, F.; Neal, D.; Albertsen, P.; Verne, J.; Stephens, P.; Trotter, C.; et al. Secular trends in prostate cancer mortality, incidence and treatment: England and Wales, 1975–2004. BJU Int. 2008, 101, 547–555. [Google Scholar] [CrossRef] [Green Version]
  9. Mistry, K.; Cable, G. Meta-analysis of prostate-specific antigen and digital rectal examination as screening tests for prostate carcinoma. J. Am. Board Fam. Pract. 2003, 16, 95–101. [Google Scholar] [CrossRef] [PubMed] [Green Version]
  10. Altuwaijri, S. Role of Prostate Specific Antigen (PSA) in Pathogenesis of Prostate Cancer. J. Cancer Ther. 2012, 3, 331–336. [Google Scholar] [CrossRef] [Green Version]
  11. Chistiakov, D.A.; Myasoedova, V.A.; Grechko, A.V.; Melnichenko, A.A.; Orekhov, A.N. New biomarkers for diagnosis and prognosis of localized prostate cancer. Semin. Cancer Biol. 2018, 52, 9–16. [Google Scholar] [CrossRef]
  12. Rönnau, C.G.H.; Verhaegh, G.W.; Luna-Velez, M.V.; Schalken, J.A. Noncoding RNAs as Novel Biomarkers in Prostate Cancer. BioMed Res. Int. 2014, 2014, 591703. [Google Scholar] [CrossRef] [PubMed]
  13. Schalken, J.A.; Hessels, D.; Verhaegh, G. New targets for therapy in prostate cancer: Differential display code 3 (DD3PCA3), a highly prostate cancer-specific gene. Urology 2003, 62, 34–43. [Google Scholar] [CrossRef]
  14. Bourdoumis, A.; Papatsoris, A.G.; Chrisofos, M.; Efstathiou, E.; Skolarikos, A.; Deliveliotis, C. The novel prostate cancer antigen 3 (PCA3) biomarker. Int. Braz. J. Urol. 2010, 36, 665–669. [Google Scholar] [CrossRef] [Green Version]
  15. Wu, A.K.; Reese, A.C.; Cooperberg, M.R.; Sadetsky, N.; Shinohara, K. Utility of PCA3 in patients undergoing repeat biopsy for prostate cancer. Prostate Cancer Prostatic Dis. 2012, 15, 100–105. [Google Scholar] [CrossRef] [PubMed] [Green Version]
  16. Goode, R.R.; Marshall, S.J.; Duff, M.; Chevli, E.; Chevli, K.K. Use of PCA3 in detecting prostate cancer in initial and repeat prostate biopsy patients. Prostate 2013, 73, 48–53. [Google Scholar] [CrossRef] [PubMed]
  17. Groskopf, J.; Aubin, S.M.; Deras, I.L.; Blase, A.; Bodrug, S.; Clark, C.; Brentano, S.; Mathis, J.; Pham, J.; Meyer, T.; et al. APTIMA PCA3 Molecular Urine Test: Development of a Method to Aid in the Diagnosis of Prostate Cancer. Clin. Chem. 2006, 52, 1089–1095. [Google Scholar] [CrossRef] [PubMed] [Green Version]
  18. Deras, I.L.; Aubin, S.M.J.; Blase, A.; Day, J.R.; Koo, S.; Partin, A.W.; Ellis, W.J.; Marks, L.S.; Fradet, Y.; Rittenhouse, H.; et al. PCA3: A Molecular Urine Assay for Predicting Prostate Biopsy Outcome. J. Urol. 2008, 179, 1587–1592. [Google Scholar] [CrossRef] [PubMed]
  19. Marangoni, K.; Neves, A.F.; Rocha, R.M.; Faria, P.R.; Alves, P.T.; Souza, A.G.; Fujimura, P.T.; Santos, F.A.A.; Araújo, T.G.; Ward, L.S.; et al. Prostate-specific RNA aptamer: Promising nucleic acid antibody-like cancer detection. Sci. Rep. 2015, 5, 12090. [Google Scholar] [CrossRef] [Green Version]
  20. Butterworth, A.; Blues, E.; Williamson, P.; Cardona, M.; Gray, L.; Corrigan, D.K. SAM Composition and Electrode Roughness Affect Performance of a DNA Biosensor for Antibiotic Resistance. Biosensors 2019, 9, 22. [Google Scholar] [CrossRef] [PubMed] [Green Version]
  21. Fang, X.; Jin, Q.; Jing, F.; Zhang, H.; Zhang, F.; Mao, H.; Xu, B.; Zhao, J. Integrated biochip for label-free and real-time detection of DNA amplification by contactless impedance measurements based on interdigitated electrodes. Biosens. Bioelectron. 2013, 44, 241–247. [Google Scholar] [CrossRef]
  22. Uludag, Y.; Narter, F.; Sağlam, E.; Köktürk, G.; Gök, M.Y.; Akgün, M.; Barut, S.; Budak, S. An integrated lab-on-a-chip-based electrochemical biosensor for rapid and sensitive detection of cancer biomarkers. Anal. Bioanal. Chem. 2016, 408, 7775–7783. [Google Scholar] [CrossRef] [PubMed]
  23. Takita, S.; Nabok, A.; Lishchuk, A.; Smith, D. Optimization of Apta-Sensing Platform for Detection of Prostate Cancer Marker PCA3. Int. J. Mol. Sci. 2021, 22, 12701. [Google Scholar] [CrossRef]
  24. Nabok, A.; Abu-Ali, H.; Takita, S.; Smith, D.P. Electrochemical detection of prostate cancer biomarker pca3 using specific rna-based aptamer labelled with ferrocene. Chemosensors 2021, 9, 59. [Google Scholar] [CrossRef]
  25. Elgrishi, N.; Rountree, K.J.; McCarthy, B.D.; Rountree, E.S.; Eisenhart, T.T.; Dempsey, J.L. A Practical Beginner’s Guide to Cyclic Voltammetry. J. Chem. Educ. 2018, 95, 197–206. [Google Scholar] [CrossRef]
  26. Bard, A.J.; Faulkner, L.R. Electrochemical Methods: Fundamentals and Applications, 2nd ed.; John Wiley & Sons Inc.: New York, NY, USA, 2001; ISBN 978-0-471-04372-0. [Google Scholar]
  27. Takita, S.; Nabok, A.; Smith, D.; Lishchuk, A. Spectroscopic Ellipsometry Detection of Prostate Cancer Bio-Marker PCA3 Using Specific Non-Labeled Aptamer: Comparison with Electrochemical Detection. Chem. Proc. 2021, 5, 65. [Google Scholar] [CrossRef]
  28. Mussa, M.H.; Farmilo, N.; Lewis, O. The Influence of Sample Preparation Techniques on Aluminium Alloy AA2024-T3 Substrates for Sol-Gel Coating. Eng. Proc. 2021, 11, 5. [Google Scholar] [CrossRef]
  29. Fischer, L.M.; Tenje, M.; Heiskanen, A.R.; Masuda, N.; Castillo, J.; Bentien, A.; Émneus, J.; Jakobsen, M.H.; Boisen, A. Gold cleaning methods for electrochemical detection applications. Microelectron. Eng. 2009, 86, 1282–1285. [Google Scholar] [CrossRef]
Figure 1. Cleaning and characterization of gold surfaces: (a) Typical CV curve of SPGE in 0.1 M H2SO4 solution cleaning responses. (b) Results of contact angle measurements of SPGE and IDGE. Images of water droplets are shown above.
Engproc 16 00008 g001
Figure 2. Typical CV curves recorded on SPGE functionalized with aptamers before and after exposure to PCA3 of different concentrations. Inset shows the dependence of absolute values of changes in cathodic current at −0.25 V on PCA3 concentration.
Engproc 16 00008 g002
Figure 3. (a) Nyquist graphs recorded on IDGE modified with aptamers before and after exposure to different concentrations of PCA3. Arrow indicates the direction of frequency increase. A simplified equivalent circuit is shown as inset. Dependencies of the resistance (b) and capacitance (c) of a double layer on the concentration PCA3.
Engproc 16 00008 g003
Publisher’s Note: MDPI stays neutral with regard to jurisdictional claims in published maps and institutional affiliations.

