1. Introduction
Bacterial contamination in food presents a serious danger to human health. Every year, tons of food need to be thrown out and it is estimated that billions of people get sick from food poisoning, leading to deaths in some hundreds of thousand cases (mostly in children) [
1]. Most of the bacterial contaminations can be traced to about 20–30 pathogenic bacteria [
2,
3]. In our work, we focused on the detection of
Escherichia coli and
Listeria monocytogenes with optical and acoustic methods. In both methods, we used specific DNA aptamers as receptors. Aptamers are single-stranded DNA or RNA that, in the correct environment, folds into structures, specifically binding to a target with constant of dissociation, K
d, around 10 nM or lower [
4,
5]. For the optical method, it is possible to modify gold nanoparticles (AuNPs) with aptamers and to study the interaction of AuNPs with bacteria by colorimetry. Aptamers also electrostatically interact with the AuNPs without specific binding, and it is possible to increase the stability of AuNPs with high ionic strength. The incubation of AuNPs with bacteria then removes the protecting aptamer and, after the addition of salts, causes AuNPs aggregation. This process can be measured by changes in absorbance spectra as a function of bacterial concentration. Another optical method used was white light reflectometry. This method measures changes in the thickness of the sensing layer deposited on a silicon chip modified with amino group-modified aptamer through silica chemistry. In this method, the white light from an optical wire illuminates the silicon surface and the reflected light is taken from the same wire to a spectrometer to measure the resulting spectrum and interference pattern of the reflected light. The mathematical model calculates changes in the apparent thickness of the sensing layer on a SiO
2 surface. We also used quartz crystal microbalance (QCM) in a multiharmonic mode for detection bacteria. In this case, the gold surface of the piezo crystal is modified by thiolated aptamers. Changes in resonant frequency and dissipation served as a signal are related to the interaction of bacteria with aptamers. It seems that the interaction of bacteria with the surface is not strictly due to the mass changes. Therefore, we also analyzed the changes in the viscoelastic properties of the sensing layer.
2. Materials and Methods
2.1. Chemicals and Materials
HAuCl4, sodium citrate, phosphate buffer saline (PBS) tablets, TRIS-HCl, NaOH, BS3 linker, bovine serum albumin (BSA), (3-Aminopropyl)triethoxysilane (APTES), tris(2-carboxyethyl)phosphine (TCEP), NH3, H2O2, H2SO4, acetone, and isopropyl alcohol were purchased from Sigma Aldrich (Darmstadt, Germany). DNA aptamers for Listeria monocytogenes and E. coli were purchased from Generi Biotech, Ltd. (Hradec Králové, Czech Republic).
2.2. Preparation of Gold Nanoparticles and Colorimetric Method
The gold nanoparticles (AuNPs) were prepared by the Turkevich method. Then, 100 mL of 0.25 mM HAuCl4 was boiled by putting it on a hotplate set to 99.9 °C for around 20 min under continuous mixing with a magnetic stirrer. The top of the flask was covered with a Petri dish in order to protect the solution from external contaminants and to reduce a loss of solvent due to evaporation. After the solution was brought to boil, 3.4 mL of 39 mM trisodium citrate was added, so that the resultant molar ratio was 1:5 of HAuCl4 to trisodium citrate. The solution first lost its yellow color and then darkened to violet color. This solution was maintained in boiling under mixing for around 15–20 min, after which the solution continually changed its color to red. We then removed the solution from the hot plate and left it to cool to room temperature. The AuNPs were stored in fridge at 4 °C. This method helped to obtain AuNPs with a diameter of approximately 5 nm.
The colorimetric experiments were performed by means of Thermo Scientific Genesys UV–vis spectrophotometer (Waltham, MA, USA). Listeria monocytogenes was prepared in Hungarian Dairy Research Institute (Mosonmagyarovar, Hungary) using standard microbiology methods. Escherichia coli O157:H7 was prepared in National Centre for Scientific Research “Demokritos” (Agia Paraskevi, Greece) in Petri dishes on agar using the standard microbiology method. Concentrations of both bacteria were determined by the plate counting method.
2.3. Preparation of Reflectometric Surface and Method of Detection
The surface of silicone SiO2 chip was cleaned with acetone and isopropyl alcohol for 10 min during sonication. We then used acidic piranha for 20 min (1:1, H2SO4:H2O2) and then cleaned the surface with distilled water until dry under nitrogen. The surface was then incubated in 2% solution of APTES for 20 min. After that, it was dried with nitrogen and put into the oven at 120 °C for 20 min. Then, we added 80 μL of 10 μM aptamer with 8 μL of 600 μM BS3 linker for one hour. After this step, the surface was cleaned with distilled water and left to incubate in TRIS buffer overnight. For blocking of the naked surface, it was immersed into 1% BSA solution for one hour. The samples were measured in flow by a system of visible-near infrared light source (ThetaMetrisis S.A., Athens, Greece) with miniaturized USBE controlled spectrometer (Maya 2000 Pro; Ocean Insight, Orlando, FL, USA) and a reflection probe (AVANTES Inc., Broomfield, CO, USA) consisting of seven optical fibers.
2.4. Preparation of QCM Surface and Method of Detection
The surface was cleaned using basic piranha (1:1:7, NH3:H2O2:H2O). We then applied sodium citrate buffer (250 mM, pH 3) in the flow. After stabilization, the aptamers in a concentration of 10 μM in a citrate buffer were added. We detected the samples in flow by using an injection pump. The QCM crystals (Total Frequency Control, Storrington, UK) were fitted in a quartz flow cell. The signal from the cell was taken with a SARK-110 (Seeed Studios, Shenzhen, China) antenna analyzer.
3. Results and Discussion
First, we explored colorimetry for detection of Listeria monocytogenes. We then determined the lowest NaCl concentration (80 mM) that causes the aggregation of AuNPs.
In the next series of the experiments, we incubated AuNPs for 15 min with different concentrations of DNA aptamers. The interaction of AuNPs with the aptamers protected them from aggregation in the presence of 200 mM NaCl. The spectrum of such AuNPs hardly changed with the use of aptamer concentration of 1 μM. In the next experiments, we incubated the 1 μM aptamer with different concentrations of
Listeria monocytogenes for 40 min at 37 °C. The sample was then centrifuged for 10 min at 14,500 rpm. Bacteria bind to the aptamers in the sample. With increased concentration of bacteria, there is less aptamers in the supernatant after centrifugation. The supernatant was incubated with AuNPs for 15 min and the absorbance spectrum was measured immediately after adding 80 mM NaCl and 10 min after the addition of NaCl.
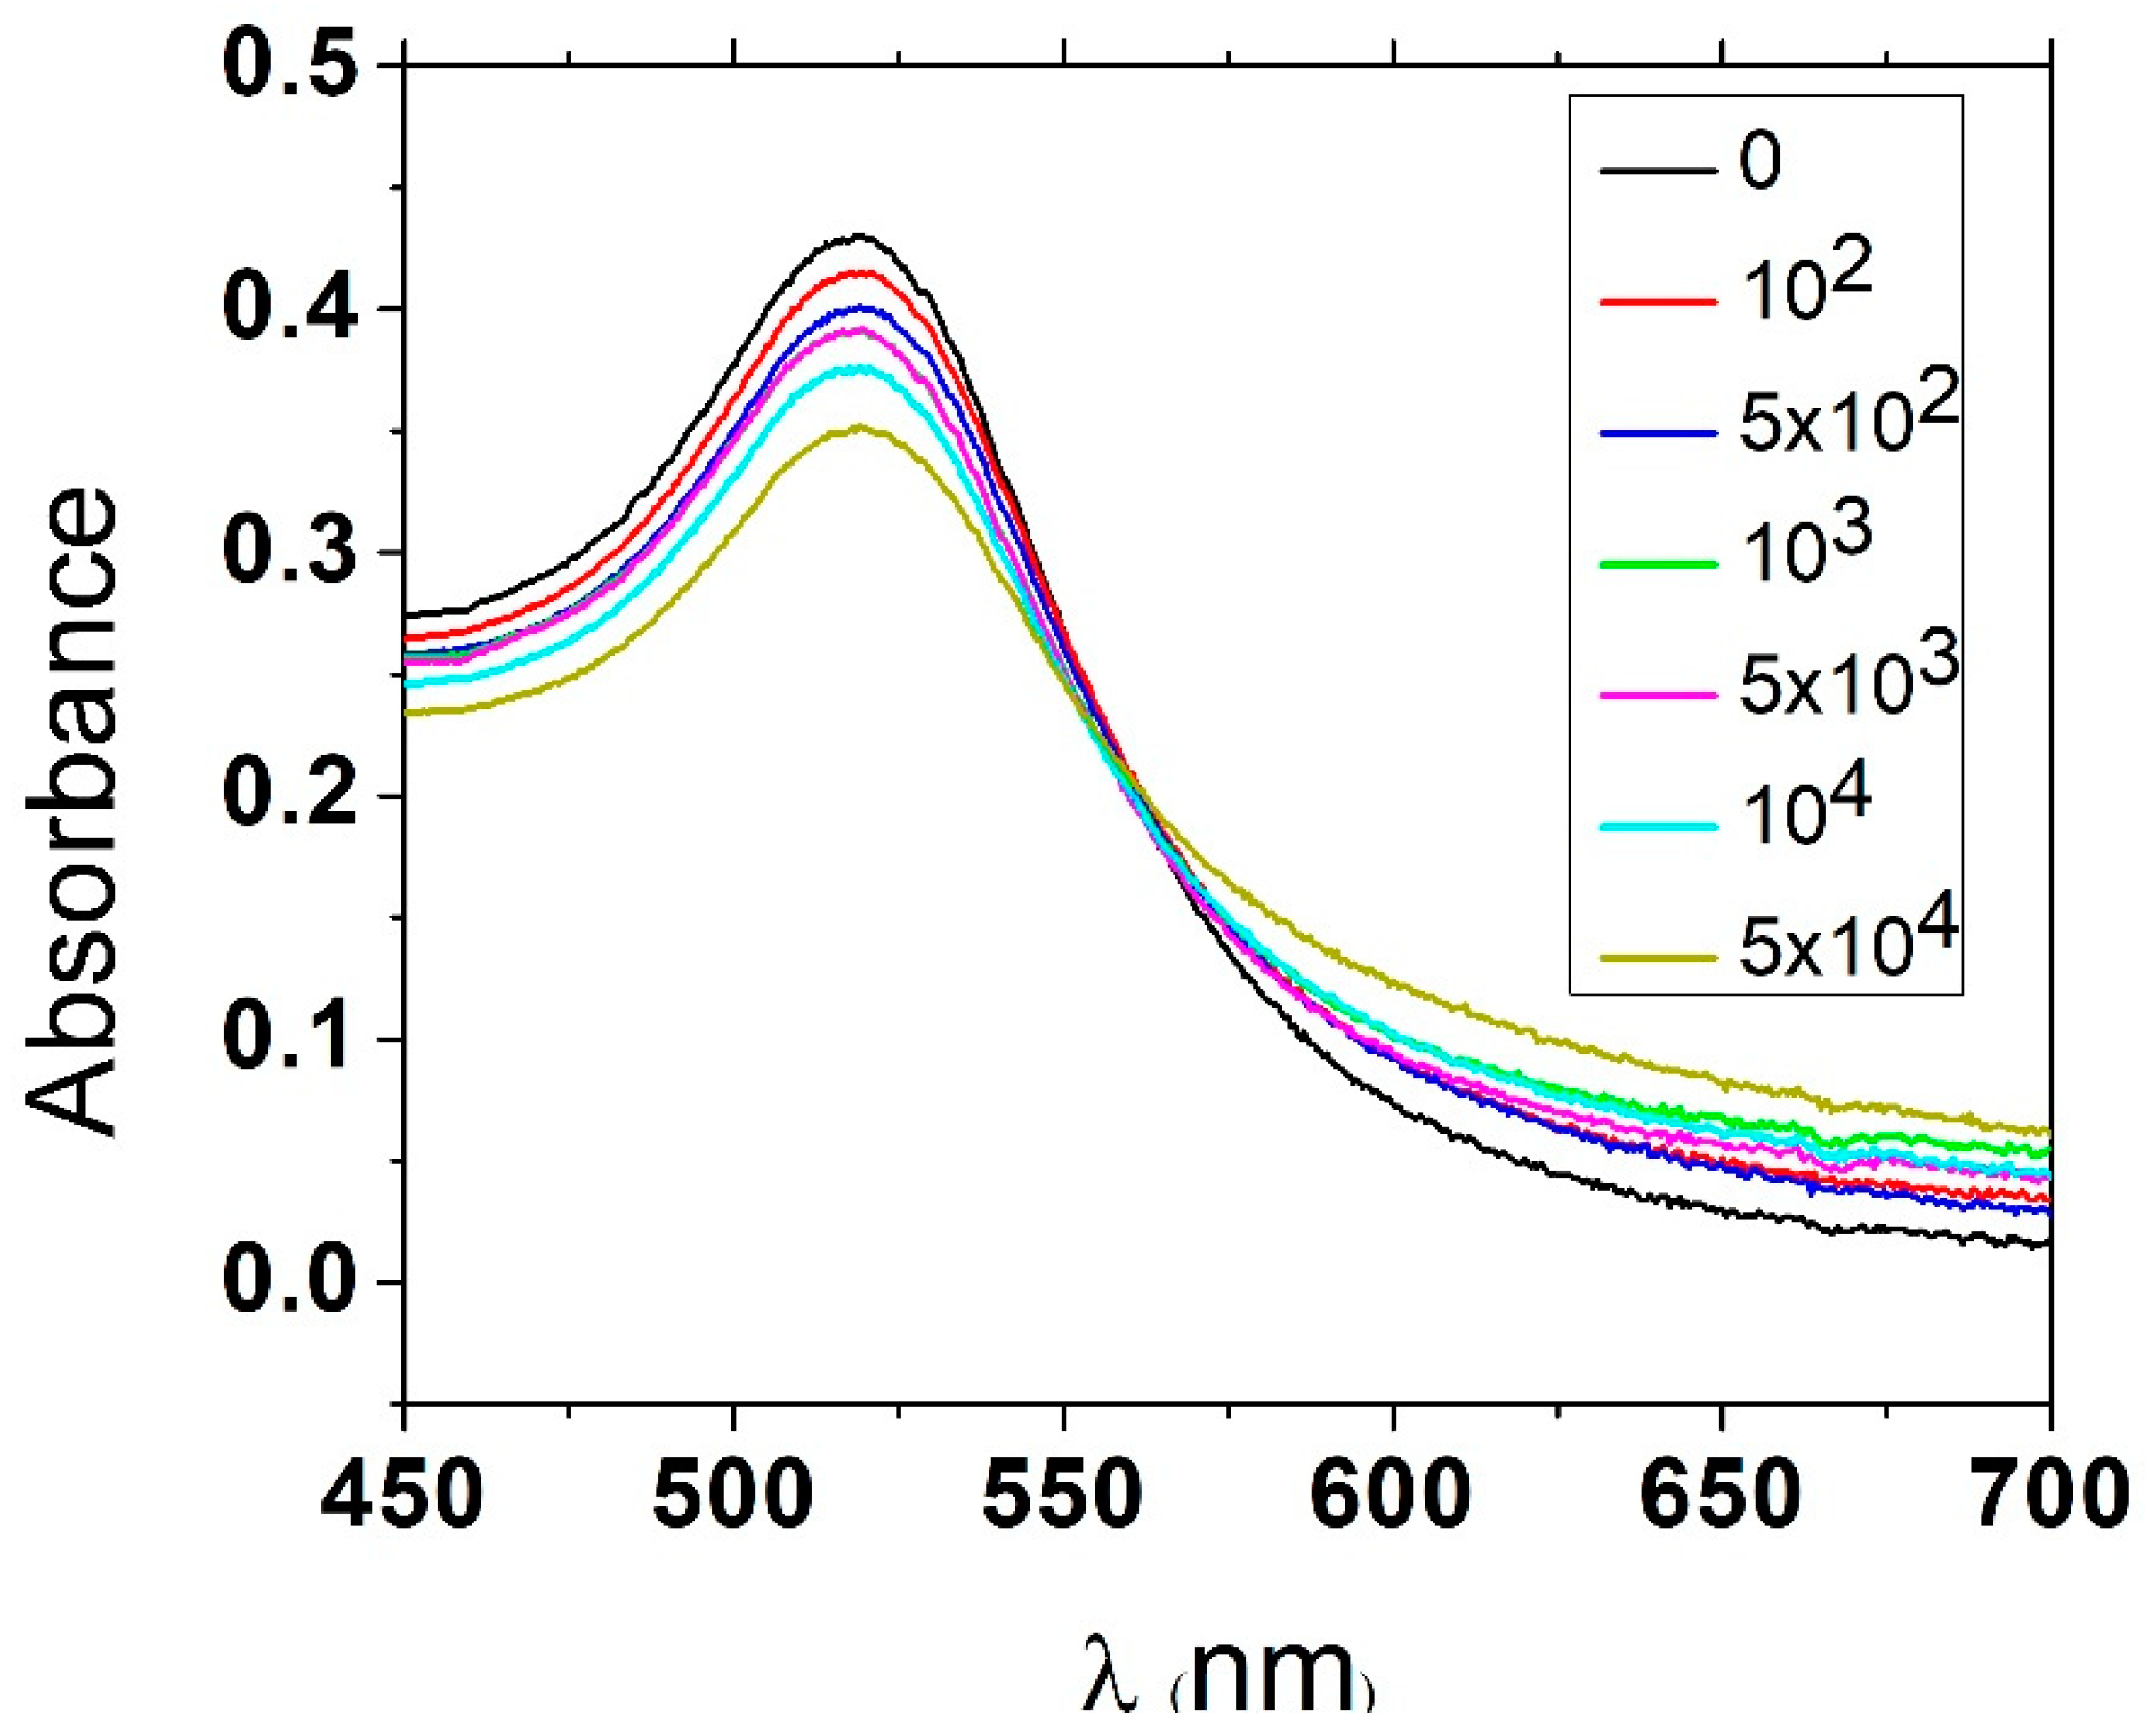
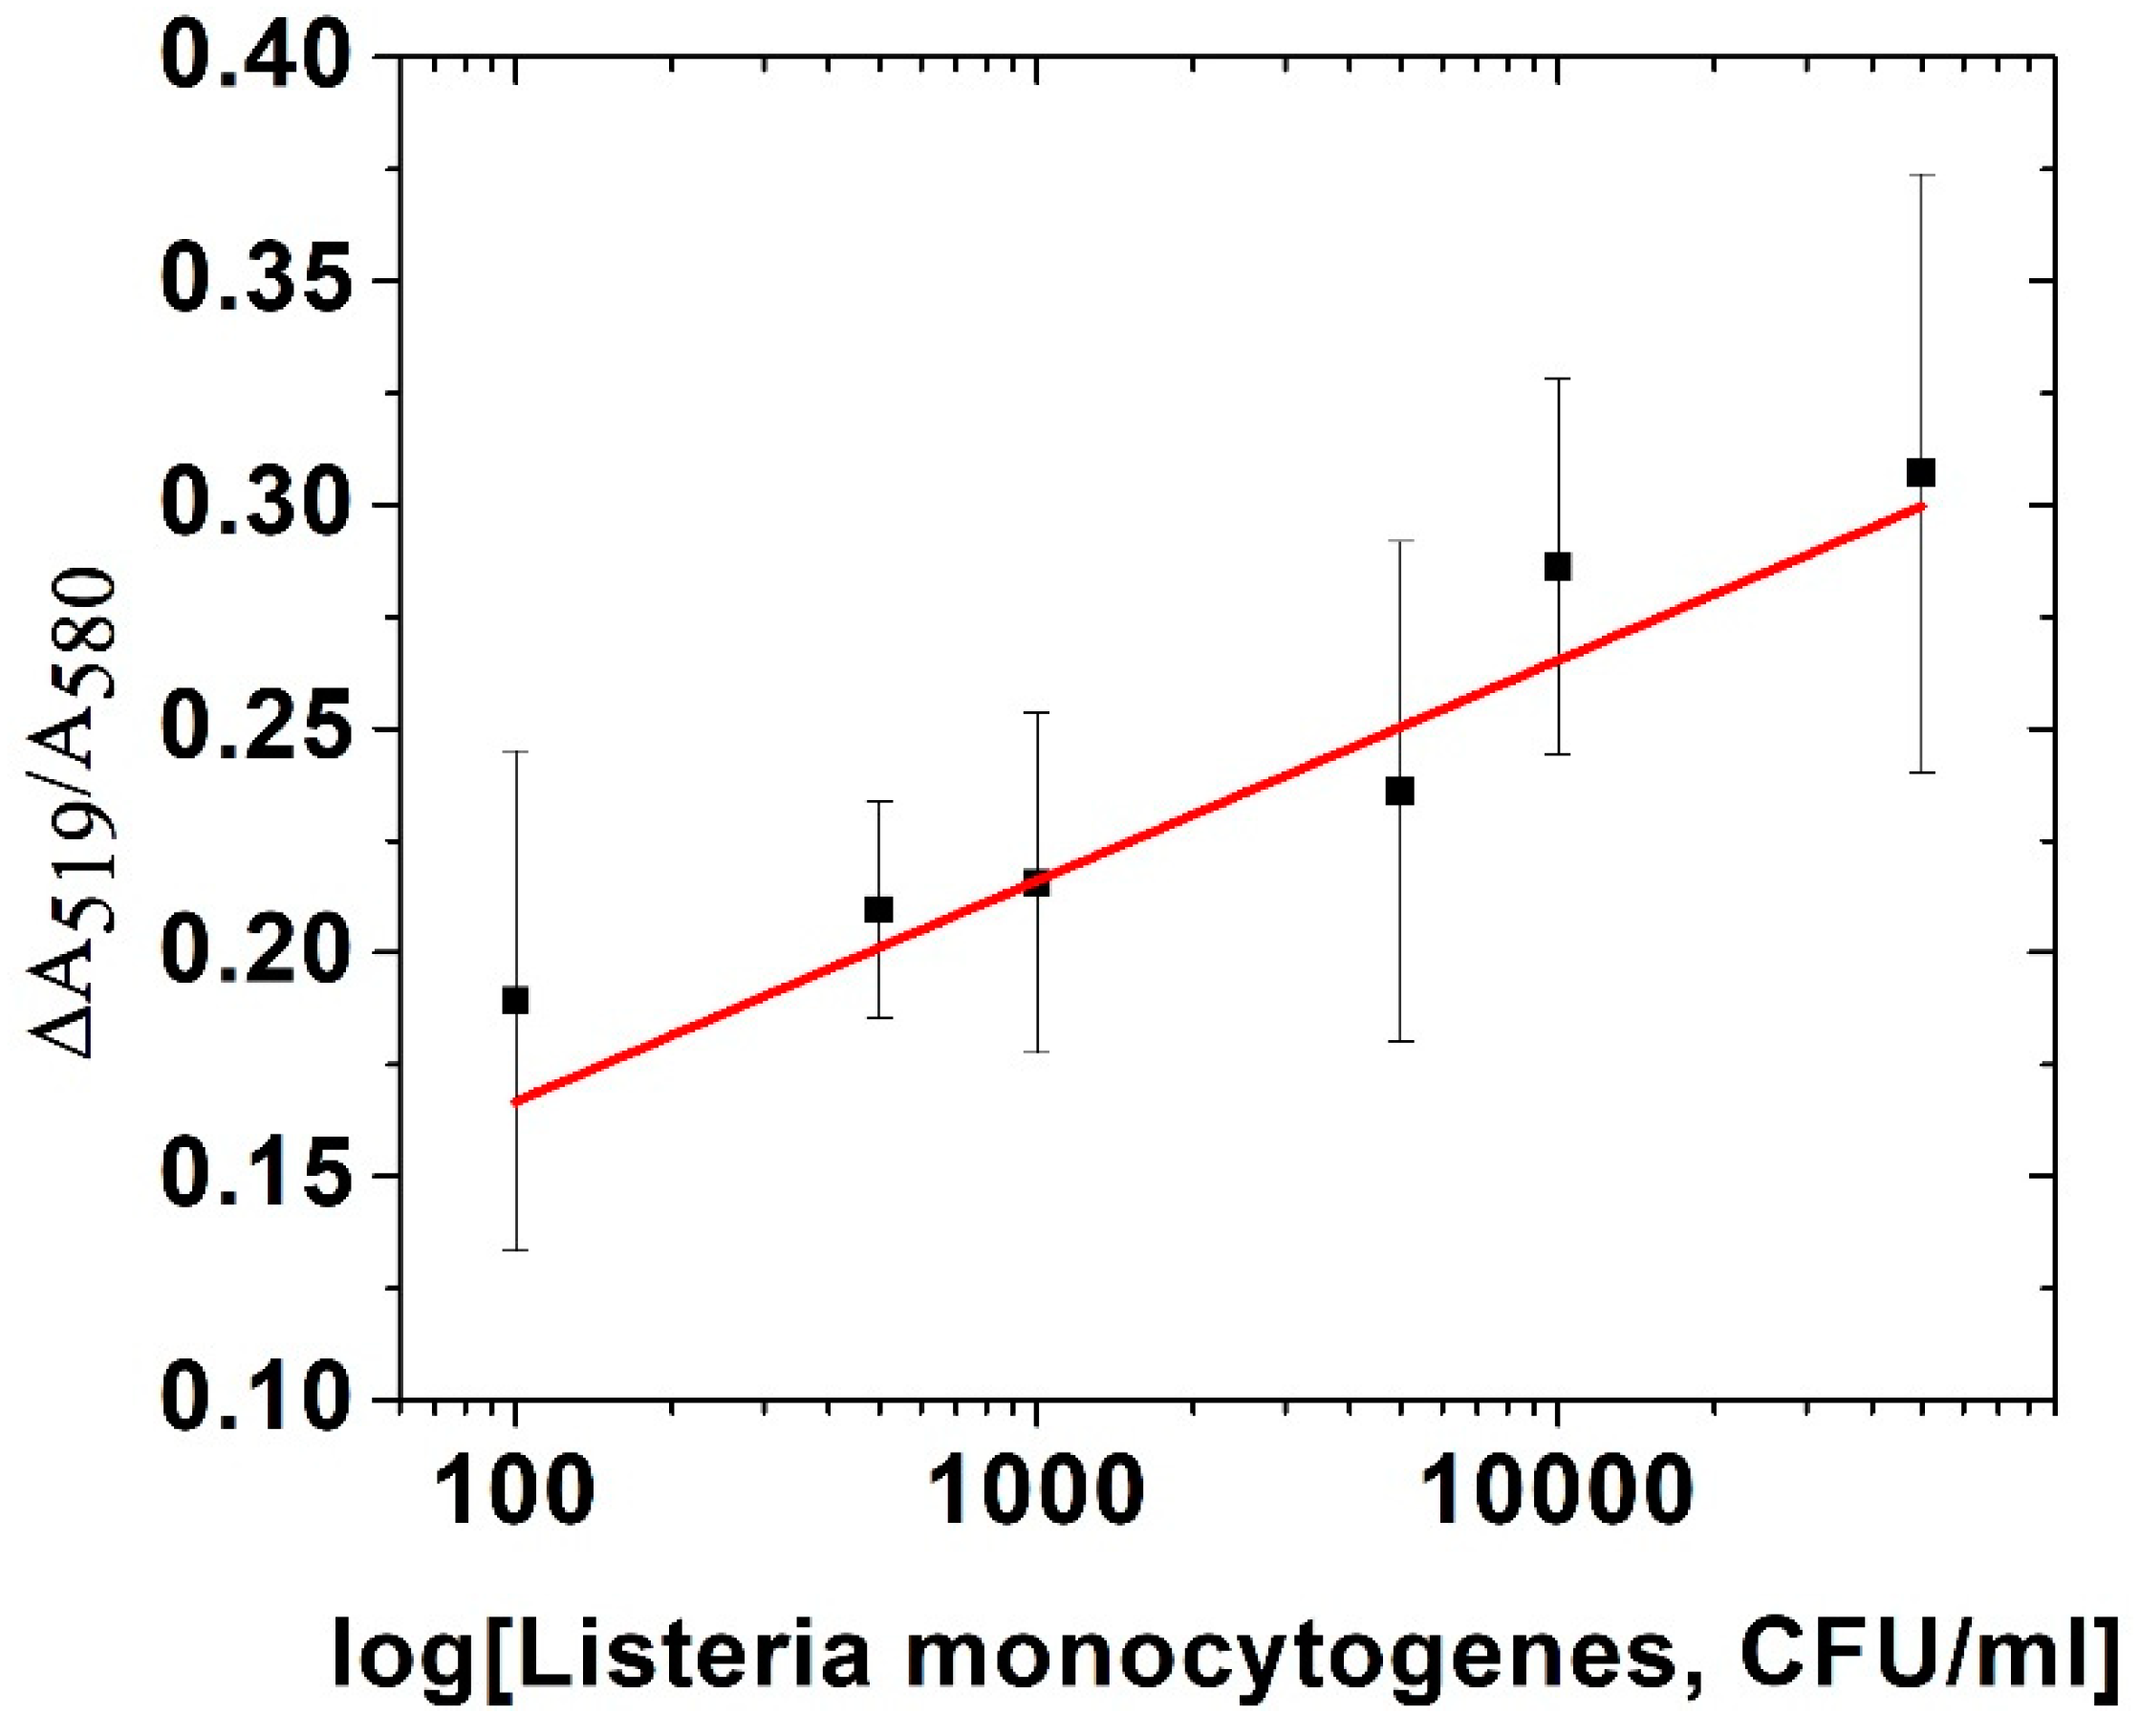
Figure 1 shows the change in absorbance spectra after addition of NaCl for different concentrations of
L. monocytogenes.
Figure 2 shows the calibration curve consisting of change in absorbance (proportion of absorbance at 519 nm and 580 nm as peaks for non-aggregated and aggregated AuNPs, respectively) vs. concentration of bacteria. We calculated the limit of detection (LOD) of this assay as 5.5 × 10
3 CFU/mL. This method can quickly and easily detect bacteria with relatively high LOD. However, it is likely that the sensitivity of detection can be further improved by optimization of the conditions, such as salt concentration, as well as application of different salts, aptamer or AuNPs with another size.
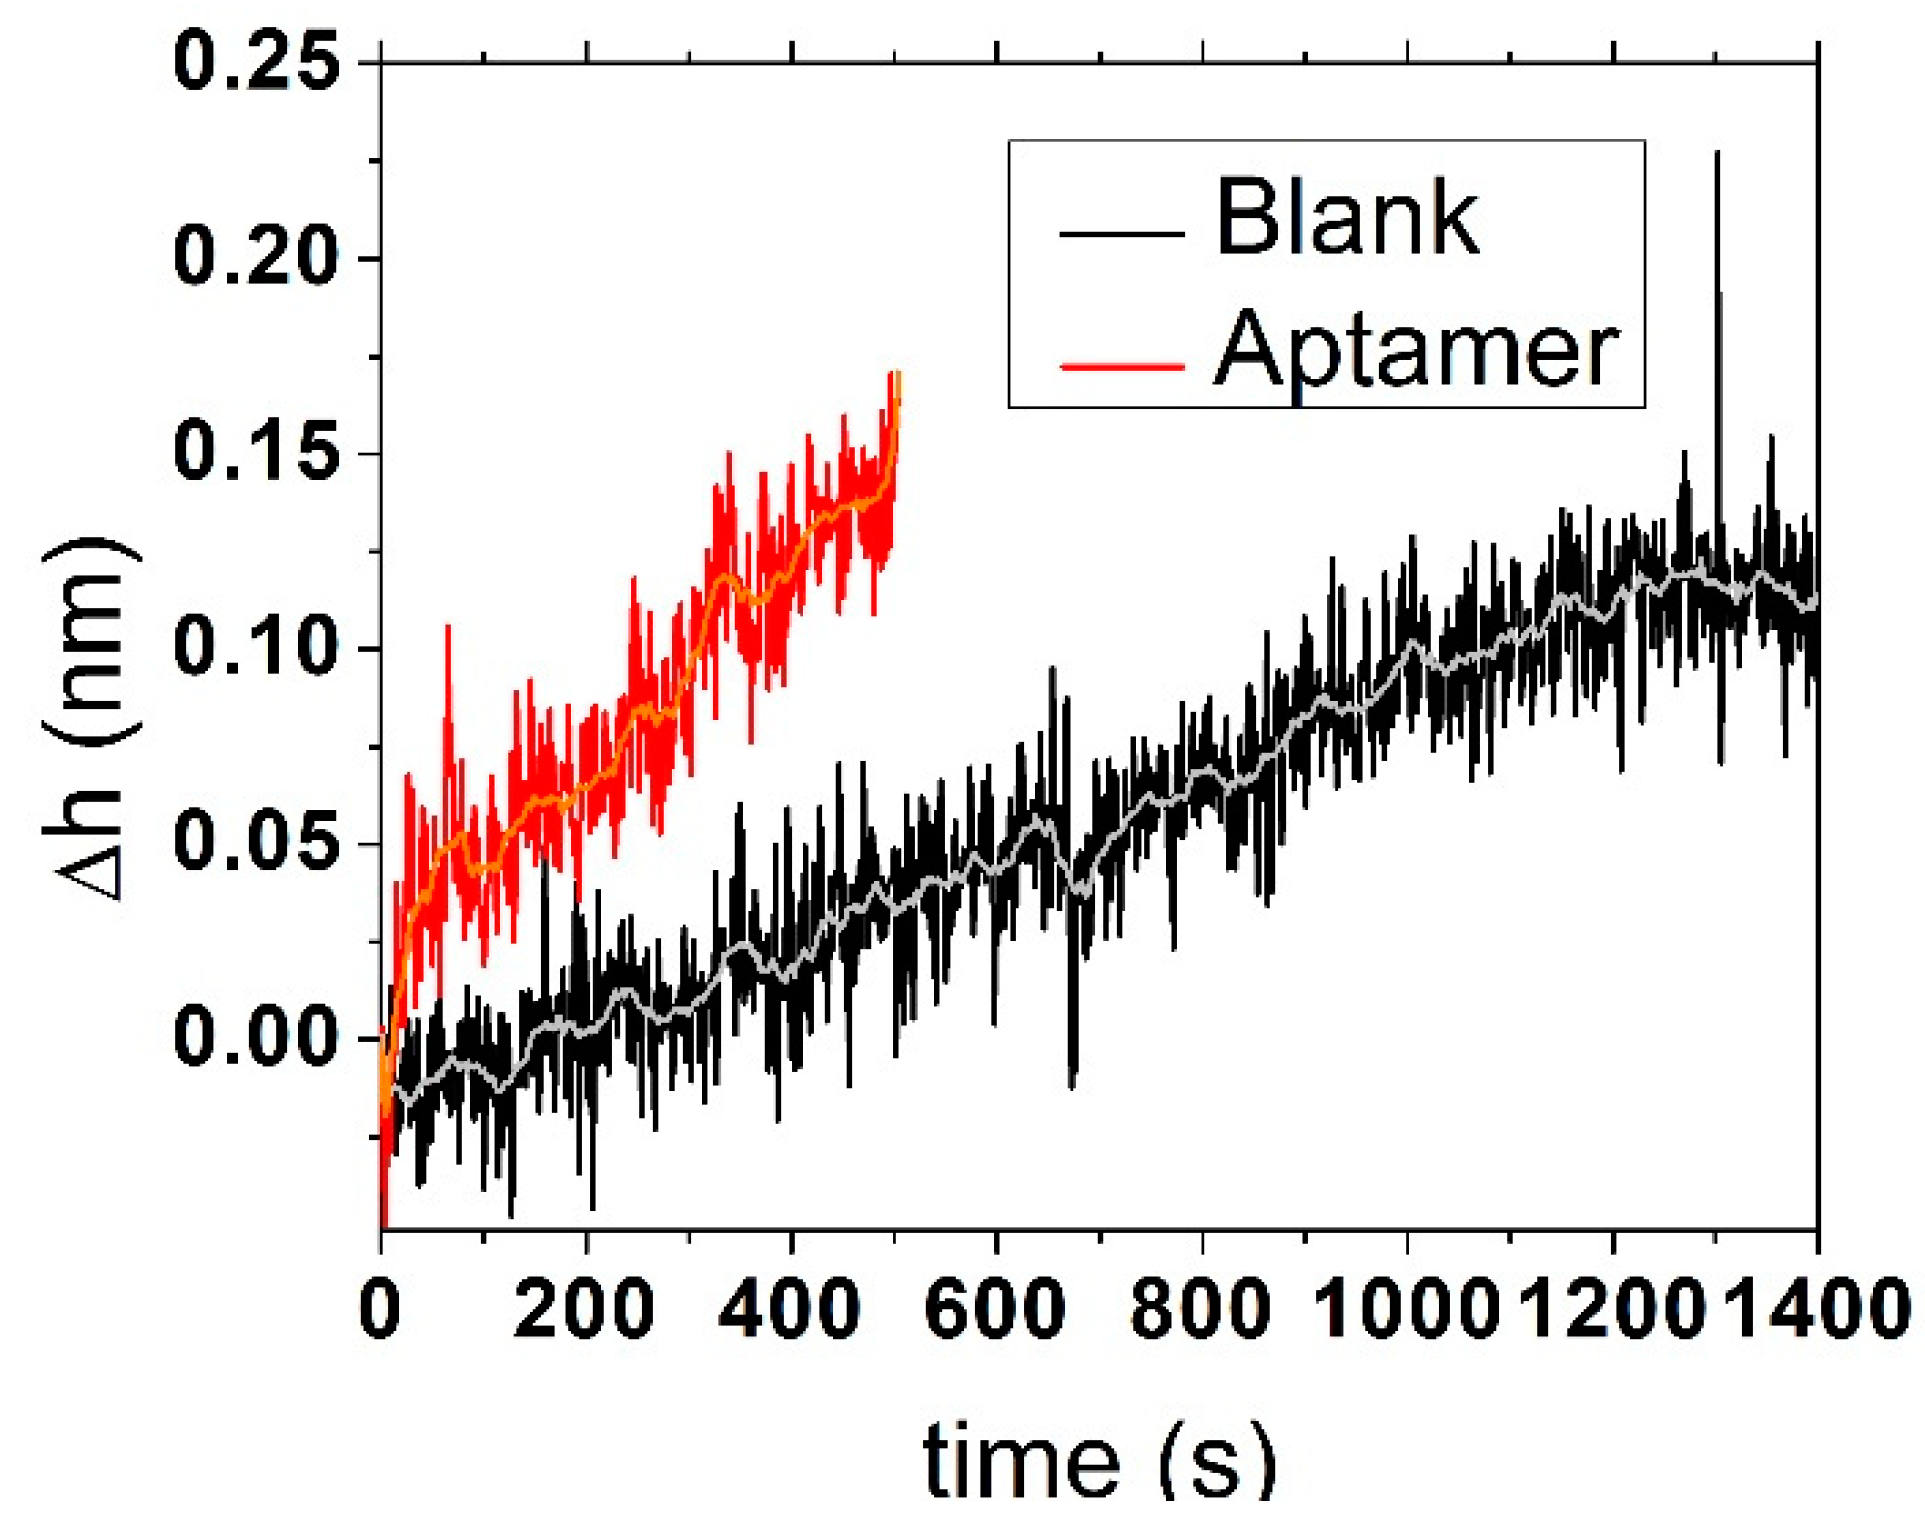
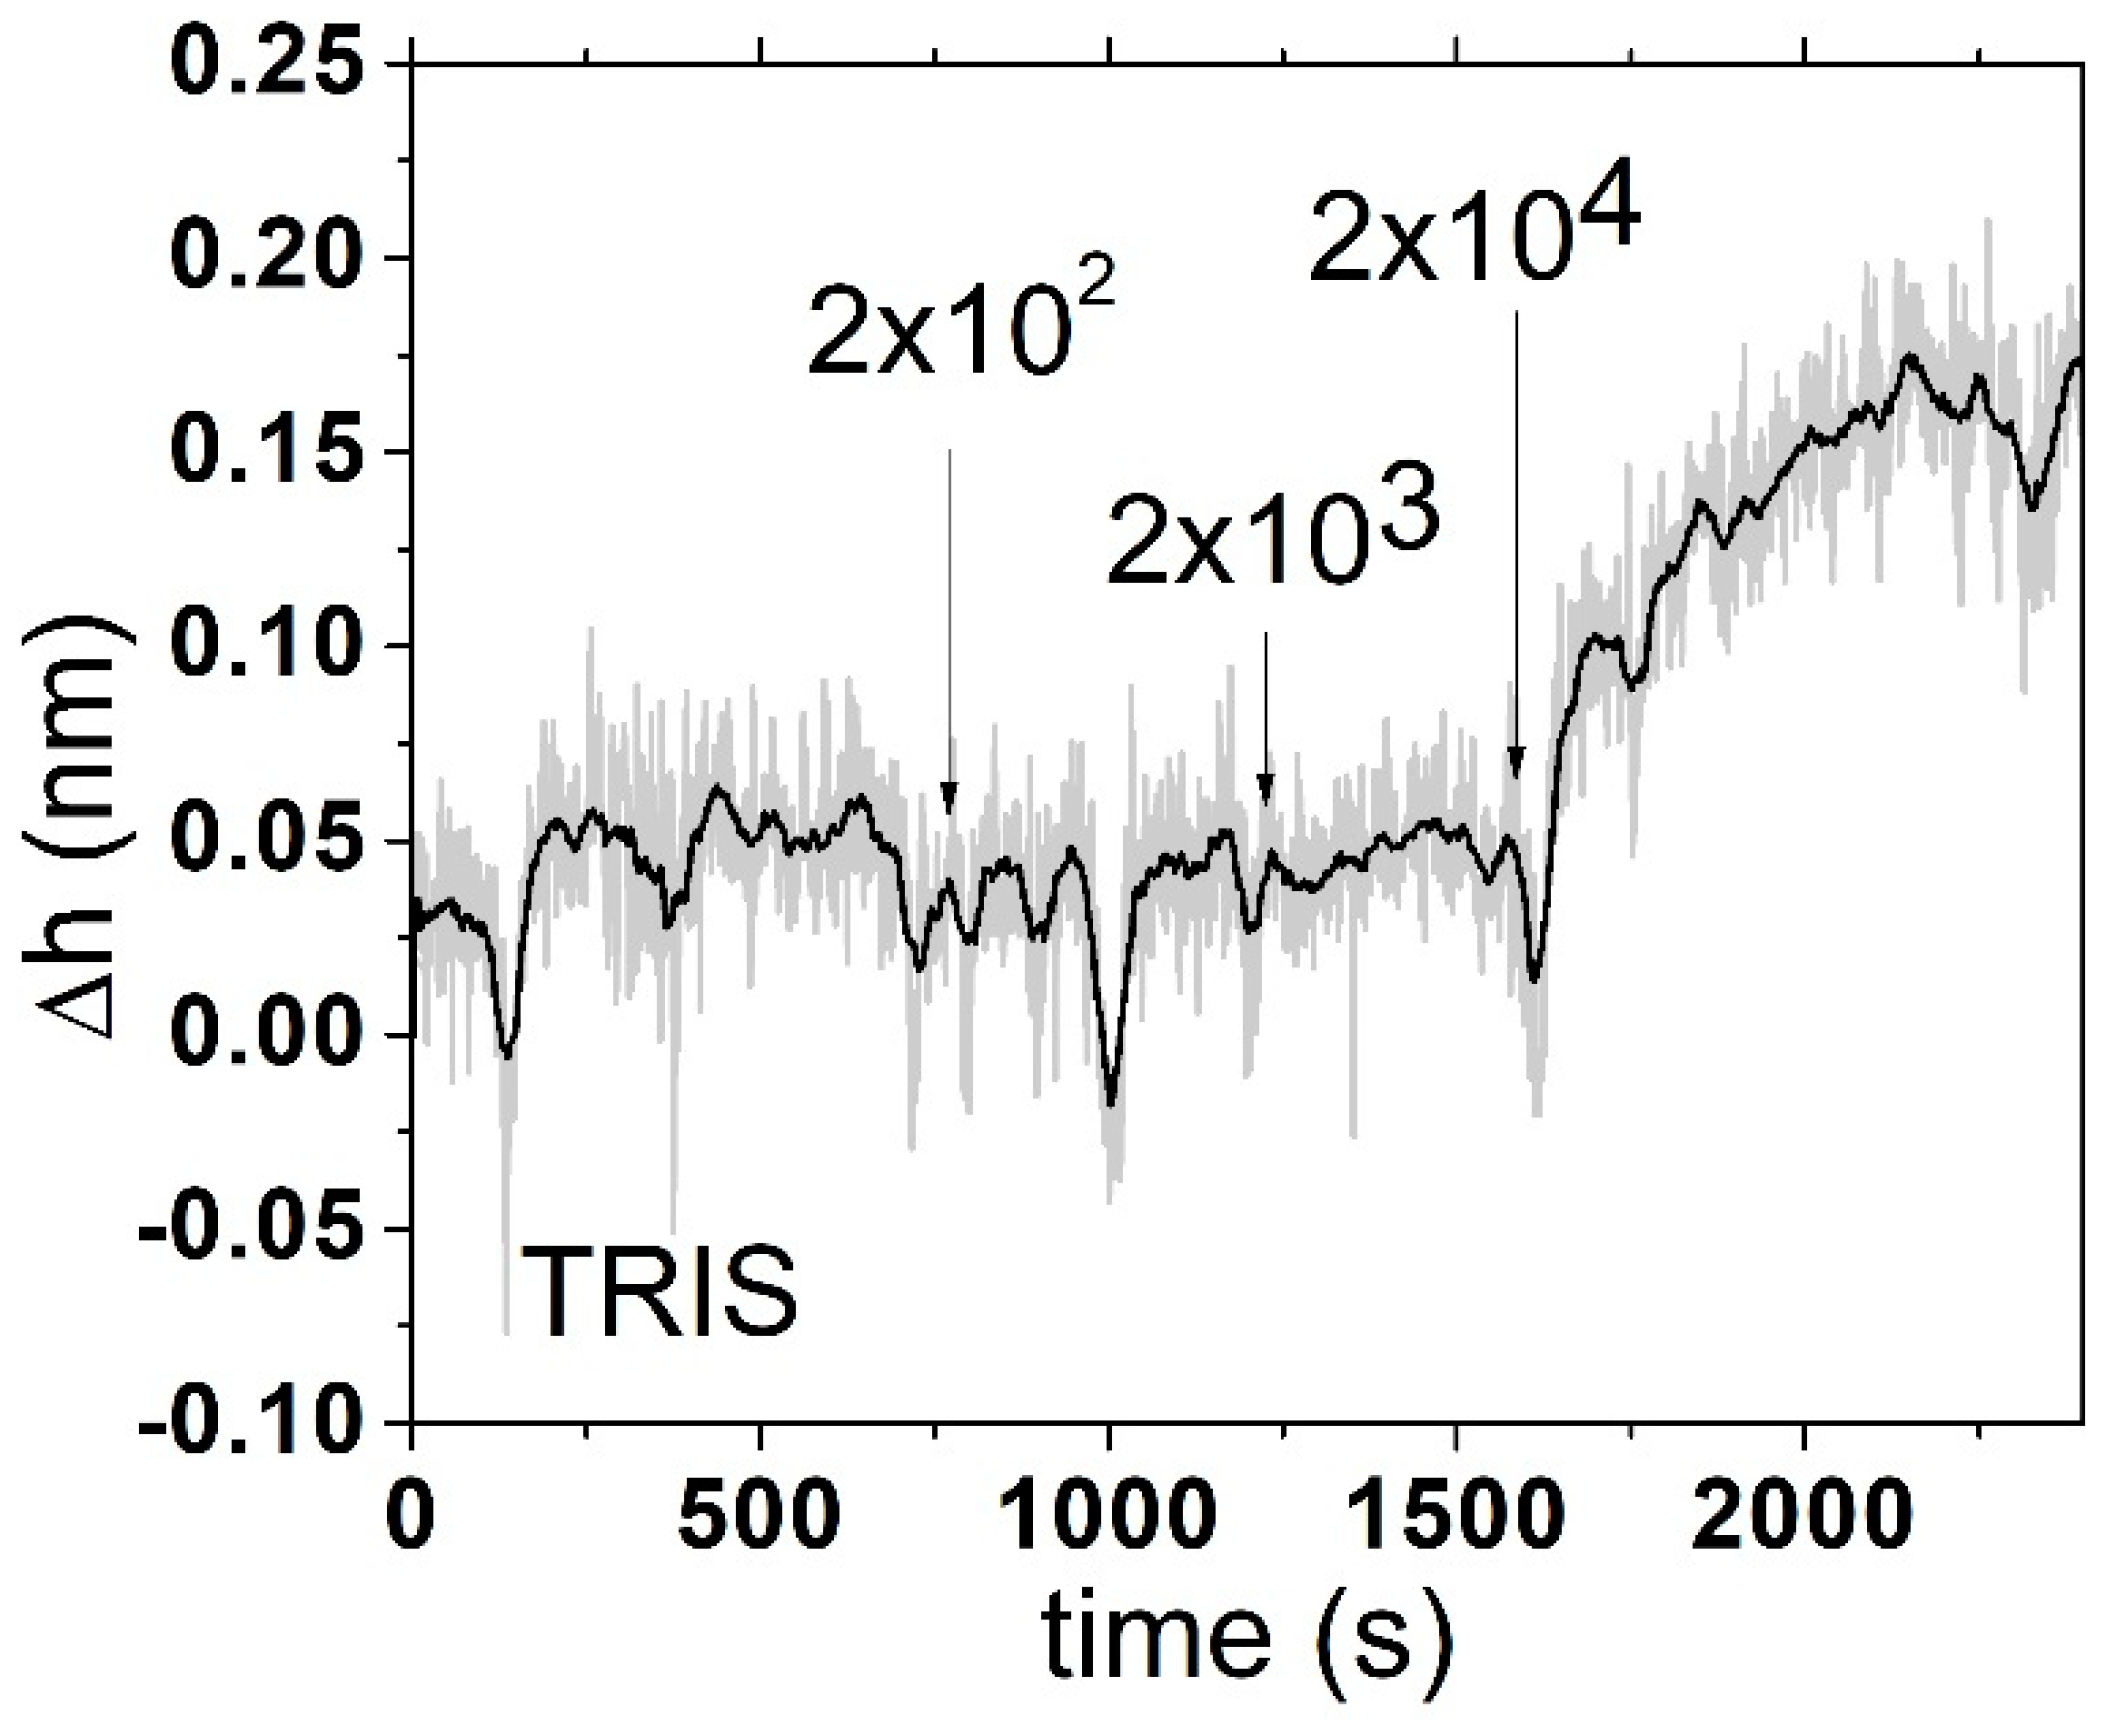
In the white light reflectometry method, we modified the silicon chip with an amino group-modified aptamers using APTES and a BS3 diester linker. Subsequently, we measured the reflection of white light from the surface of the silicon chip. After adding different concentrations of bacteria, we were able to monitor the change in the reflected spectrum and, using a mathematical model, we linked these changes to the variations in layer thickness. Typical kinetics related to changes in the thickness of naked silicon surface and those modified by aptamers (the naked SiO
2 surface was blocked by BSA) in the presence of
E. coli are shown in
Figure 3. An optical signal from bacteria can be seen for both surfaces; however, the kinetics for blocked surface were faster. After adding different concentrations of
E. coli to the surface, we observed a 0.01–1 nm shift in the thickness depending on the concentration of bacteria starting from 2 × 10
2 CFU/mL (
Figure 4).
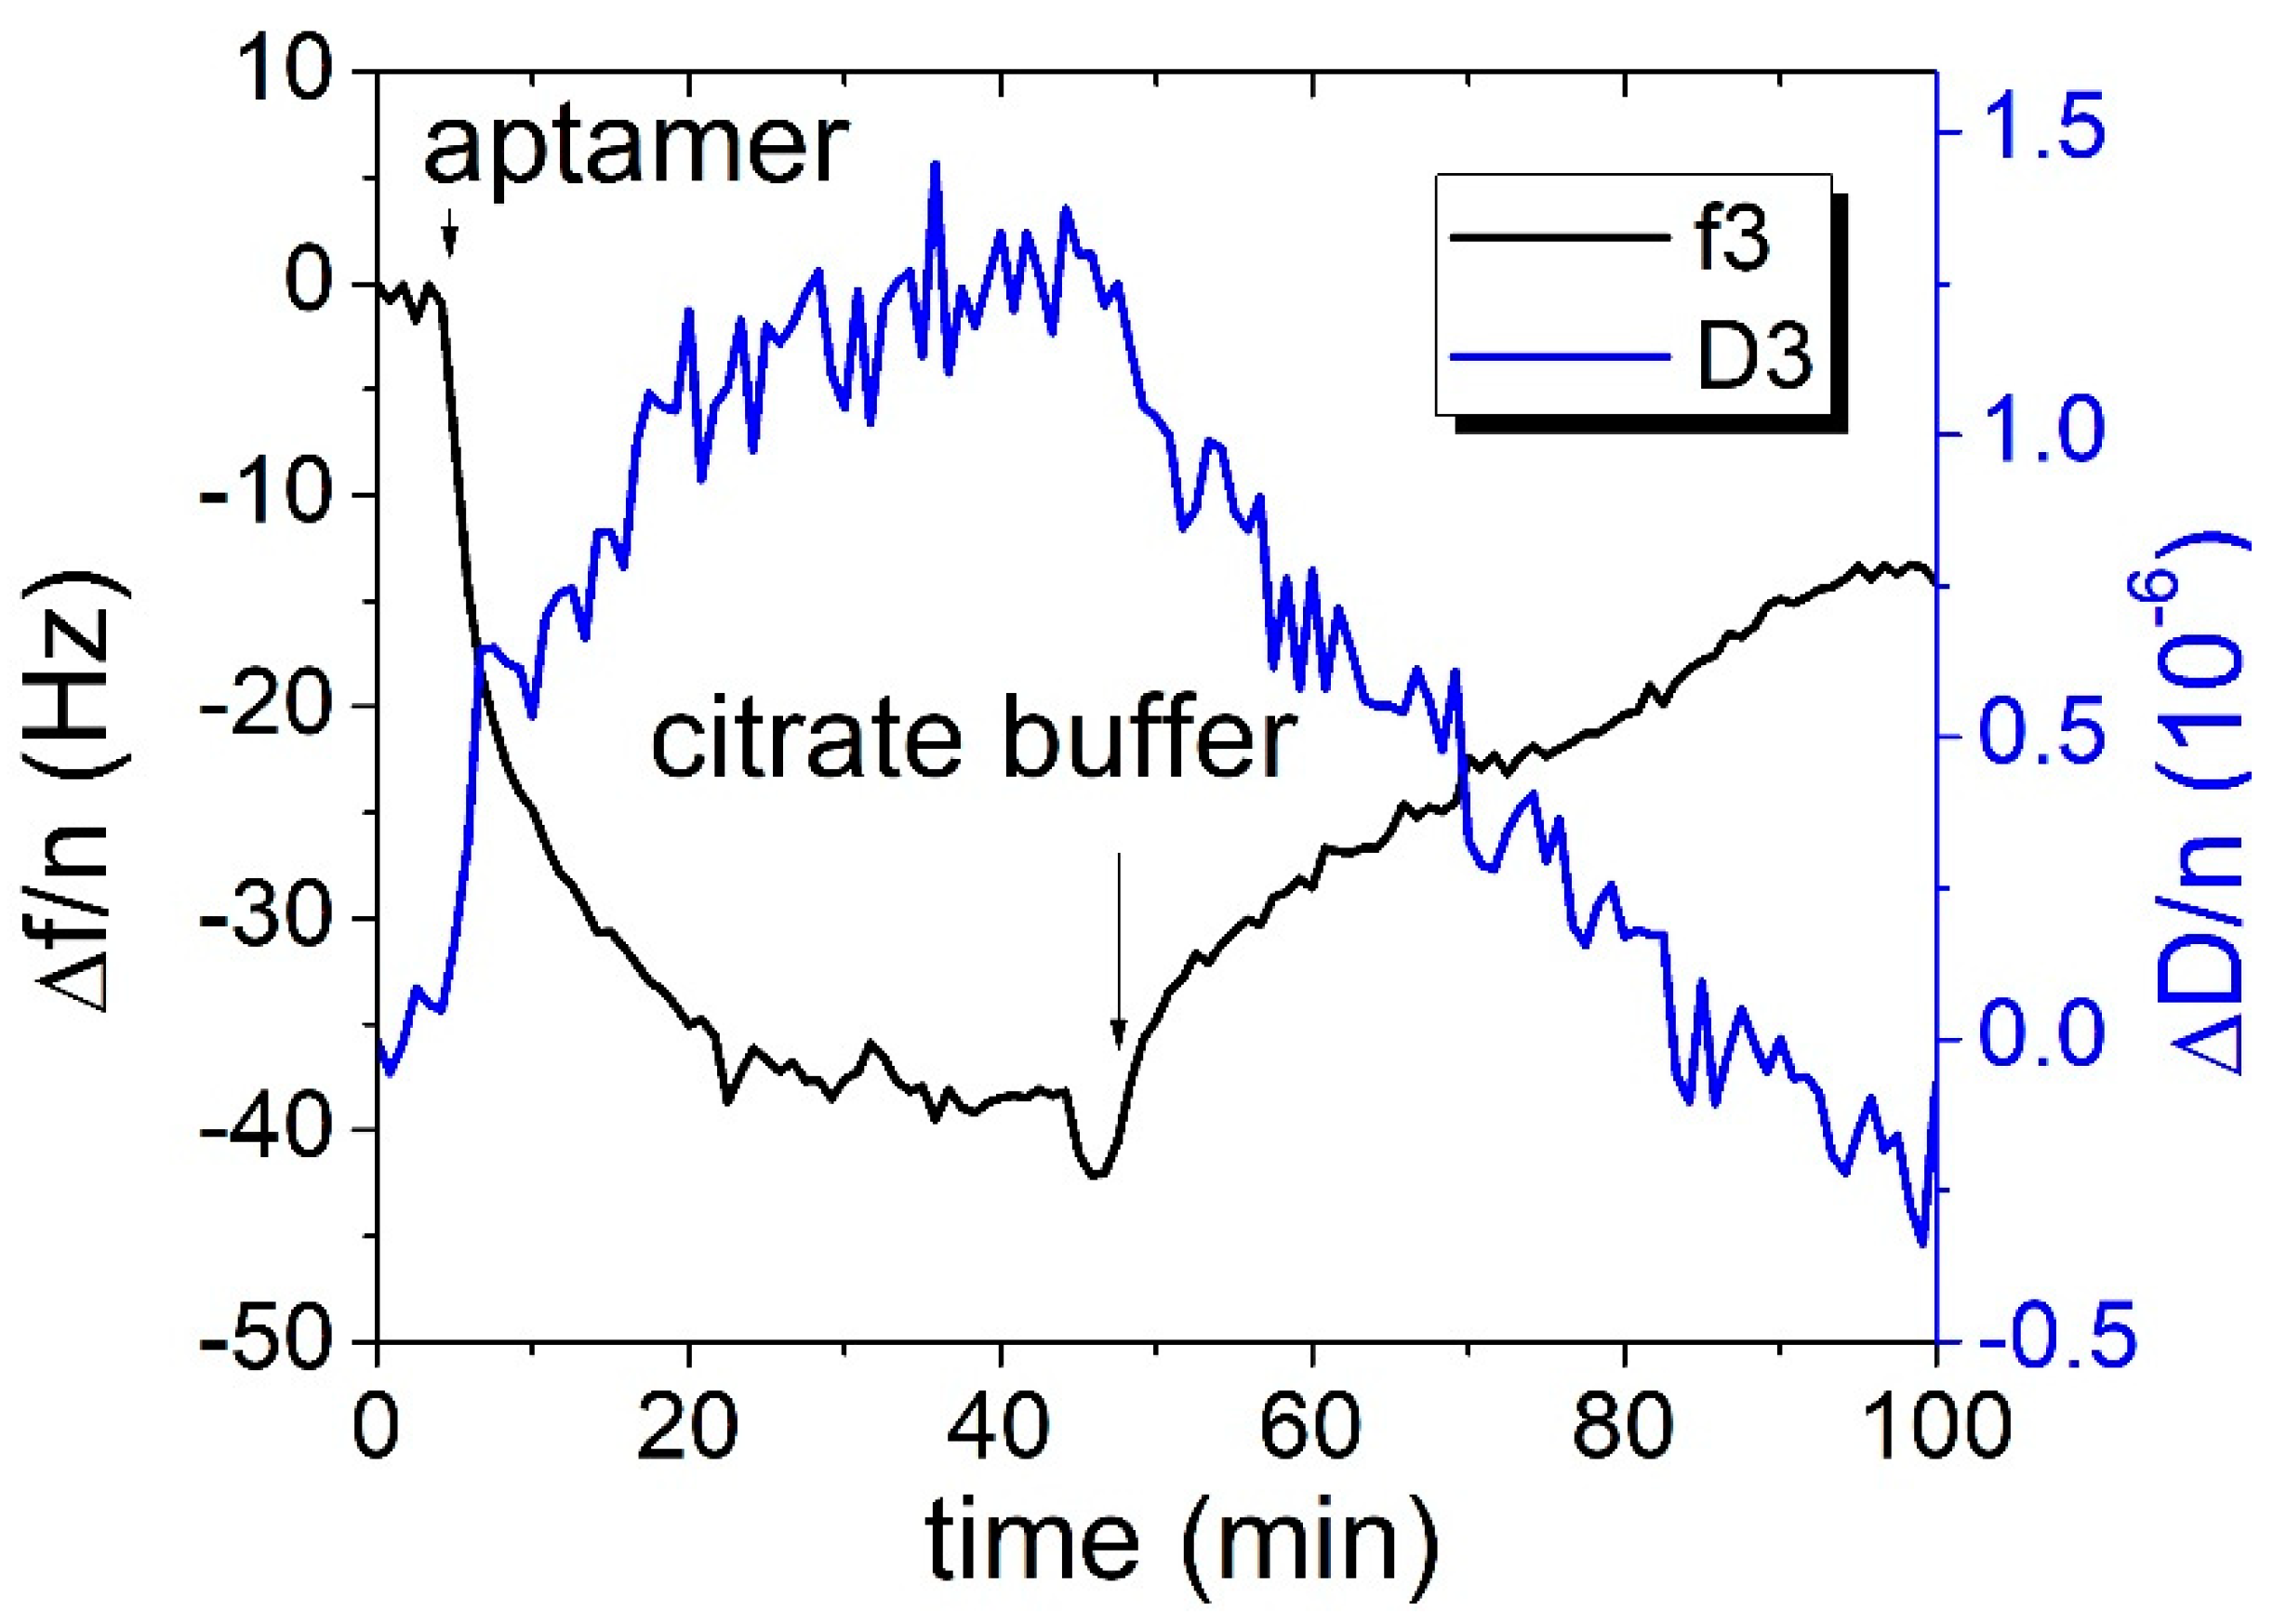
We also applied the QCM method for
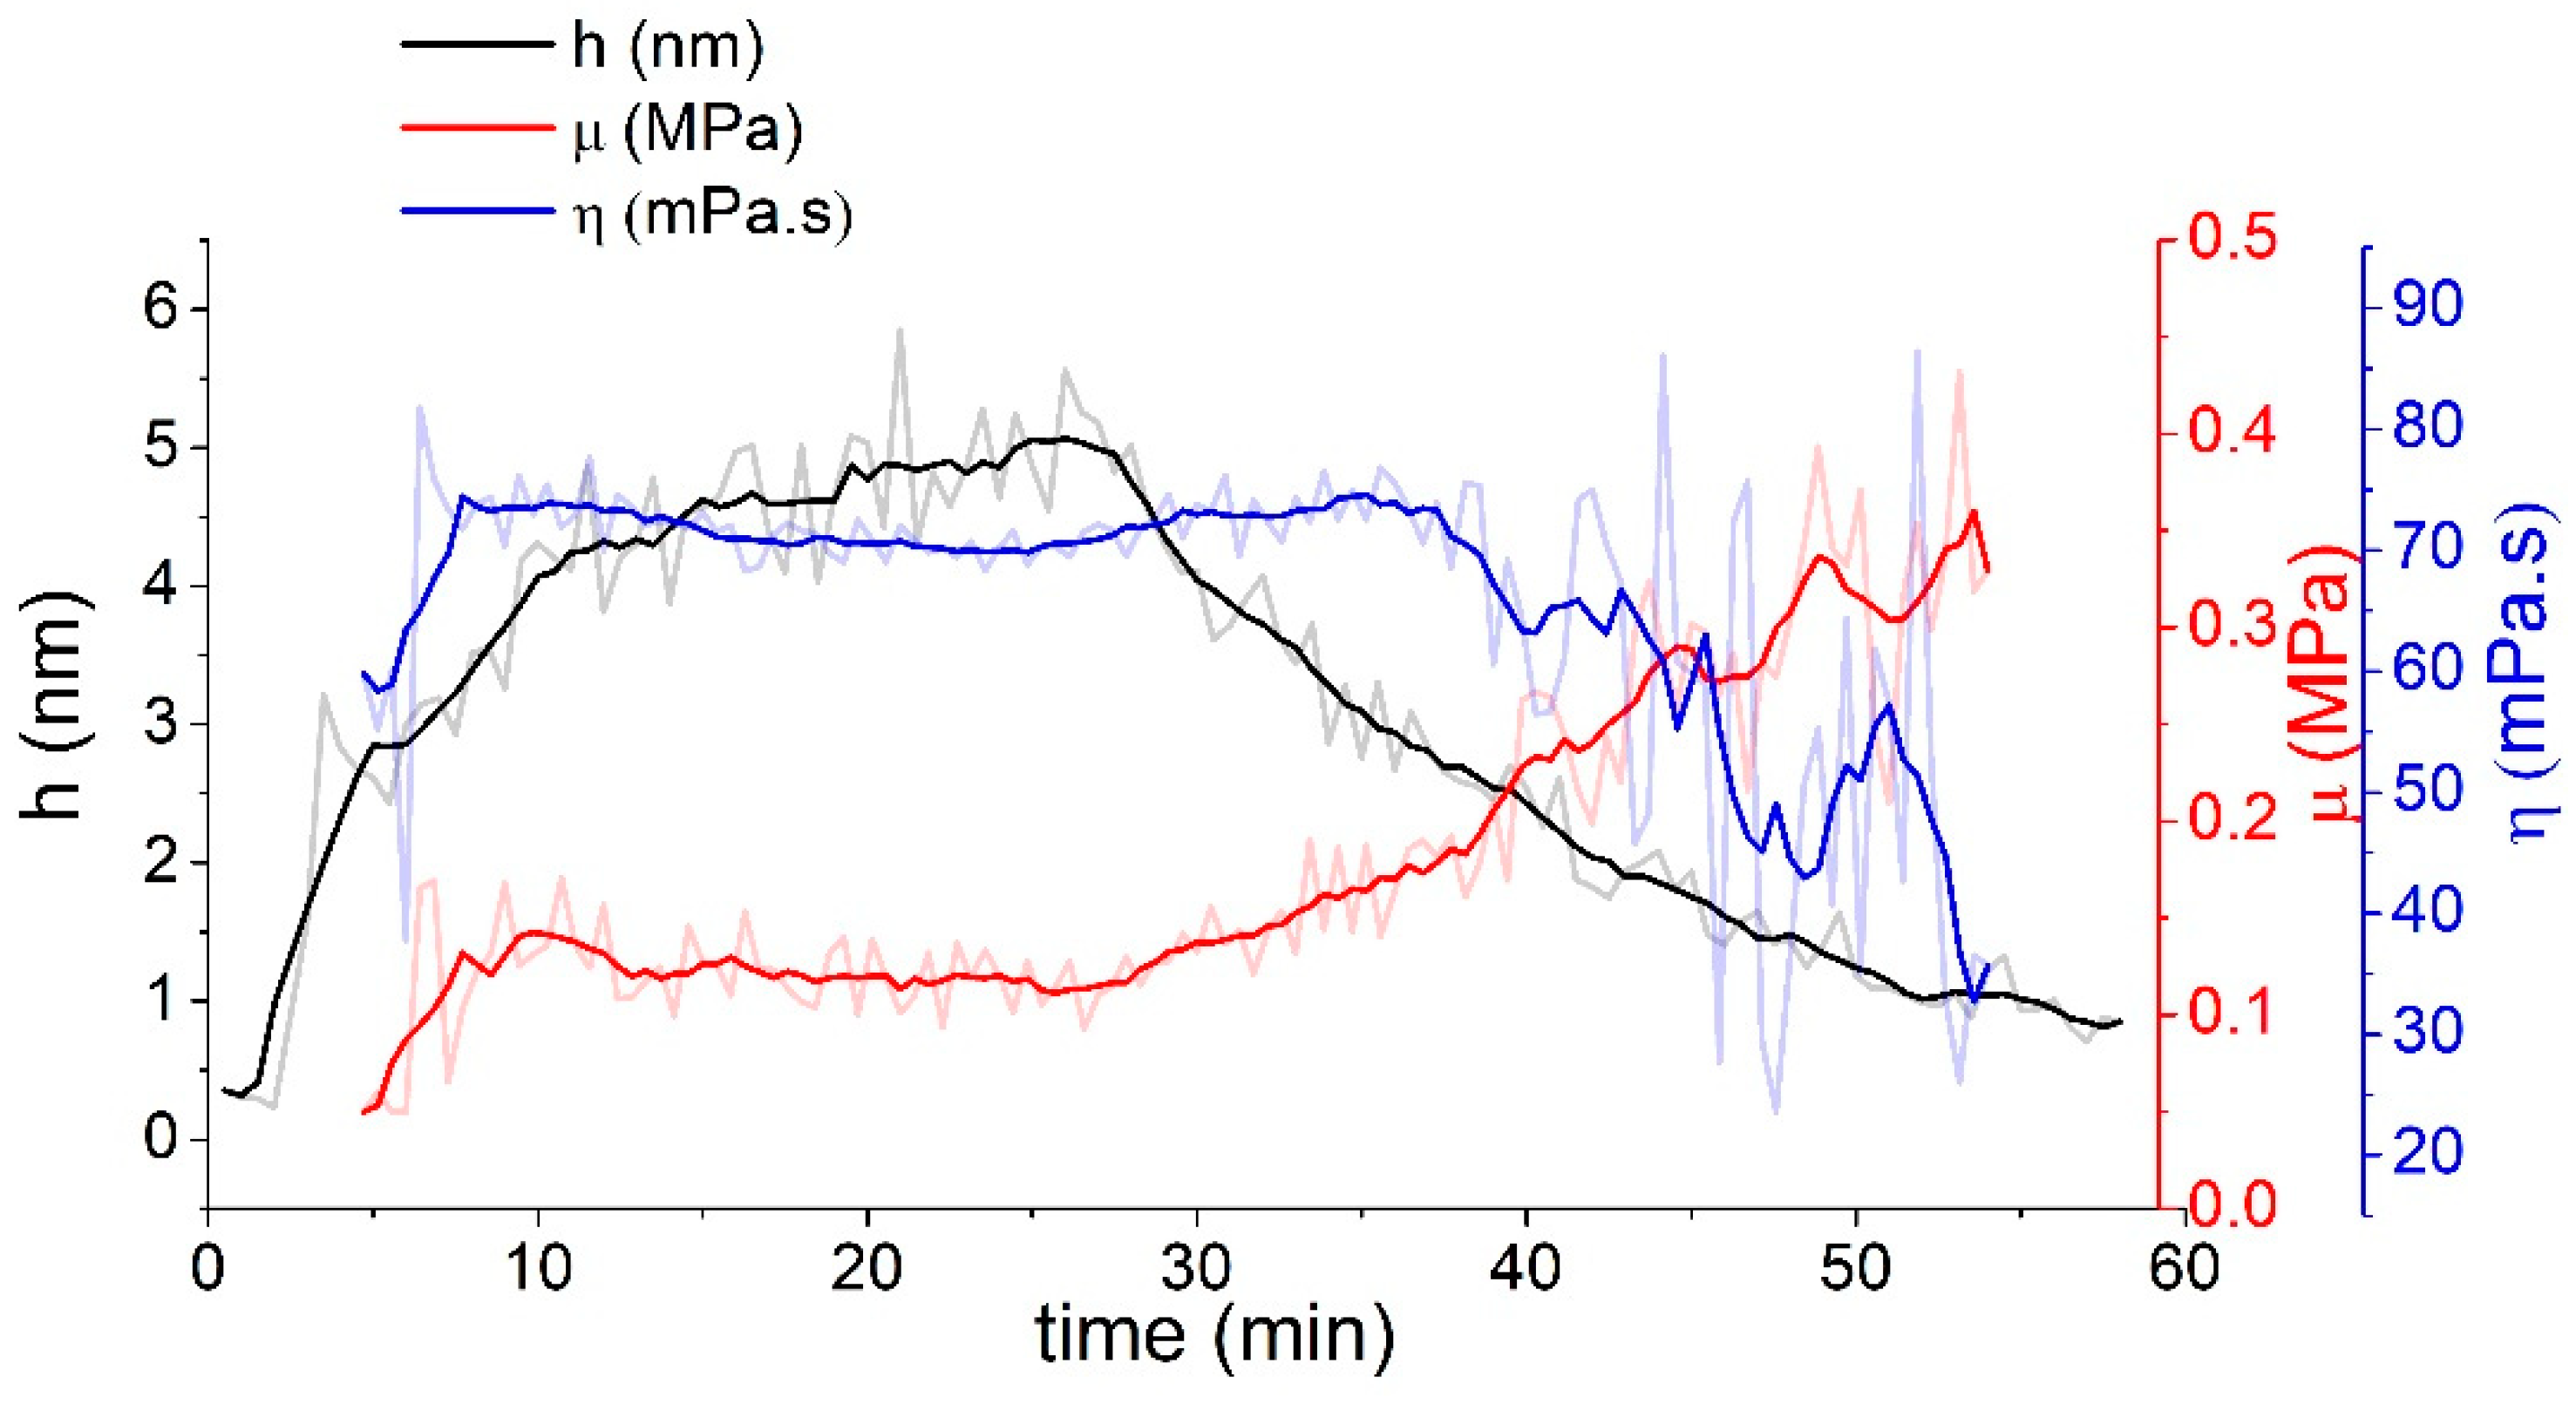
E. coli detection at the surface of piezo crystal modified by DNA aptamers. For thiolated aptamers, we observed that the surface binding was rather weak, and it was necessary to lower the pH leading to about a 10 Hz decrease in the resonant frequency in the flow following the addition of thiolated aptamer (
Figure 5). The resulting change in frequency after the addition of around 10
4 CFU/mL was hard to distinguish from the noise and drift of the QCM system. Viscoelastic analysis using the Voinova–Voigt viscoelastic model [
6] shows that the estimated height of this aptamer is about 5 nm at layer formation and that the resulting height is below 1 nm (
Figure 6). Equations used for Voinova model are presented below:
where ω = 2π
f0n,
,
q,
l, and
f subscripts are designations for quartz, liquid, and film, respectively.
The length of unfolded aptamer is around 15 nm, indicating that the aptamer at the crystal surface is likely to be in a different conformation than the denatured random. However, low altitude can also imply insufficient coverage (as it is an average height) or an aptamer lying on the surface. These results are also supported by the change in viscosity and elasticity. Shearing modulus, μ, increased after leaching from the layer, implying that the aptamer had a greater tendency to return, implying closer association with the layer. On the contrary, the viscosity decreased, which may mean that the aptamer is not in a tense conformation and, thus, lies on the surface of the gold electrode. To circumvent this problem, it is probably necessary to modify the layer with small thiol molecules in sufficient proportion to the aptamer so that the aptamer is in a more advantageous position and has room to bind bacteria. The optical method based on AuNPs had the highest estimated LOD. The light reflectometry method was able to measure
E. coli in the range of 10
3 to 10
4 CFU/mL; however, sensitivity as low as 100 CFU/mL can also be attained [
7]. The acoustic method provides advantages in the possibility of probing the viscoelastic changes in the surfaces; however, the bacteria can negatively or positively induce the changes in the frequency, which proves a challenge when it is used as a biosensor [
8,
9].


 and
and 