Proceeding Paper

Computational and Experimental Investigation of Microfluidic Chamber Designs for DNA Biosensors †

by
Sotiria D. Psoma
1,*,
Ihor Sobianin
1 and
Antonios Tourlidakis
2
1
School of Engineering & Innovation, The Open University, Milton Keynes MK7 6AA, UK
2
School of Engineering, University of Western Macedonia, 50100 Kozani, Greece
*
Author to whom correspondence should be addressed.
Presented at the 2nd International Electronic Conference on Biosensors, 14–18 February 2022; Available online: https://sciforum.net/event/IECB2022.
Eng. Proc. 2022, 16(1), 16; https://doi.org/10.3390/IECB2022-12252
Published: 14 February 2022
(This article belongs to the Proceedings of The 2nd International Electronic Conference on Biosensors)

Abstract

:
A critical characteristic for continuous monitoring using DNA biosensors is the design of the microfluidics system used for sample manipulation, effective and rapid reaction and an ultra-low detection limit of the analyte. The selection of the appropriate geometrical design and control of microfluidic parameters are highly important for the optimum performance. In the present study, a number of different shapes of microchambers are designed and computationally assessed using a Multiphysics software. Flow parameters such as pressure drop, and shear rates are compared. Three-dimensional printing was used to construct the designs and an experimental investigation is underway for the validation of the computational results.

1. Introduction

Continuous monitoring is actively used in the medical practice as it allows for the constant monitoring of biomarkers. This facilitates timely and accurate diagnosis, which is followed by medical treatment. Genome sequencing is a method that deciphers huge amounts of data that are present in a DNA samples and is vital for detecting mutations and pathogens [1]. The analyte can be studied with the utilisation of a biosensor, a device which converts biochemical reaction into readable signal [2].
There are many methods of sample manipulation [3] used in laboratories, one of which is microfluidics. It has gained significant interest over recent years and has become an integral part of modern biosensors [4]. Among the many advantages of microfluidics are rapid reaction and ultra-low detection limit of the analyte [5].
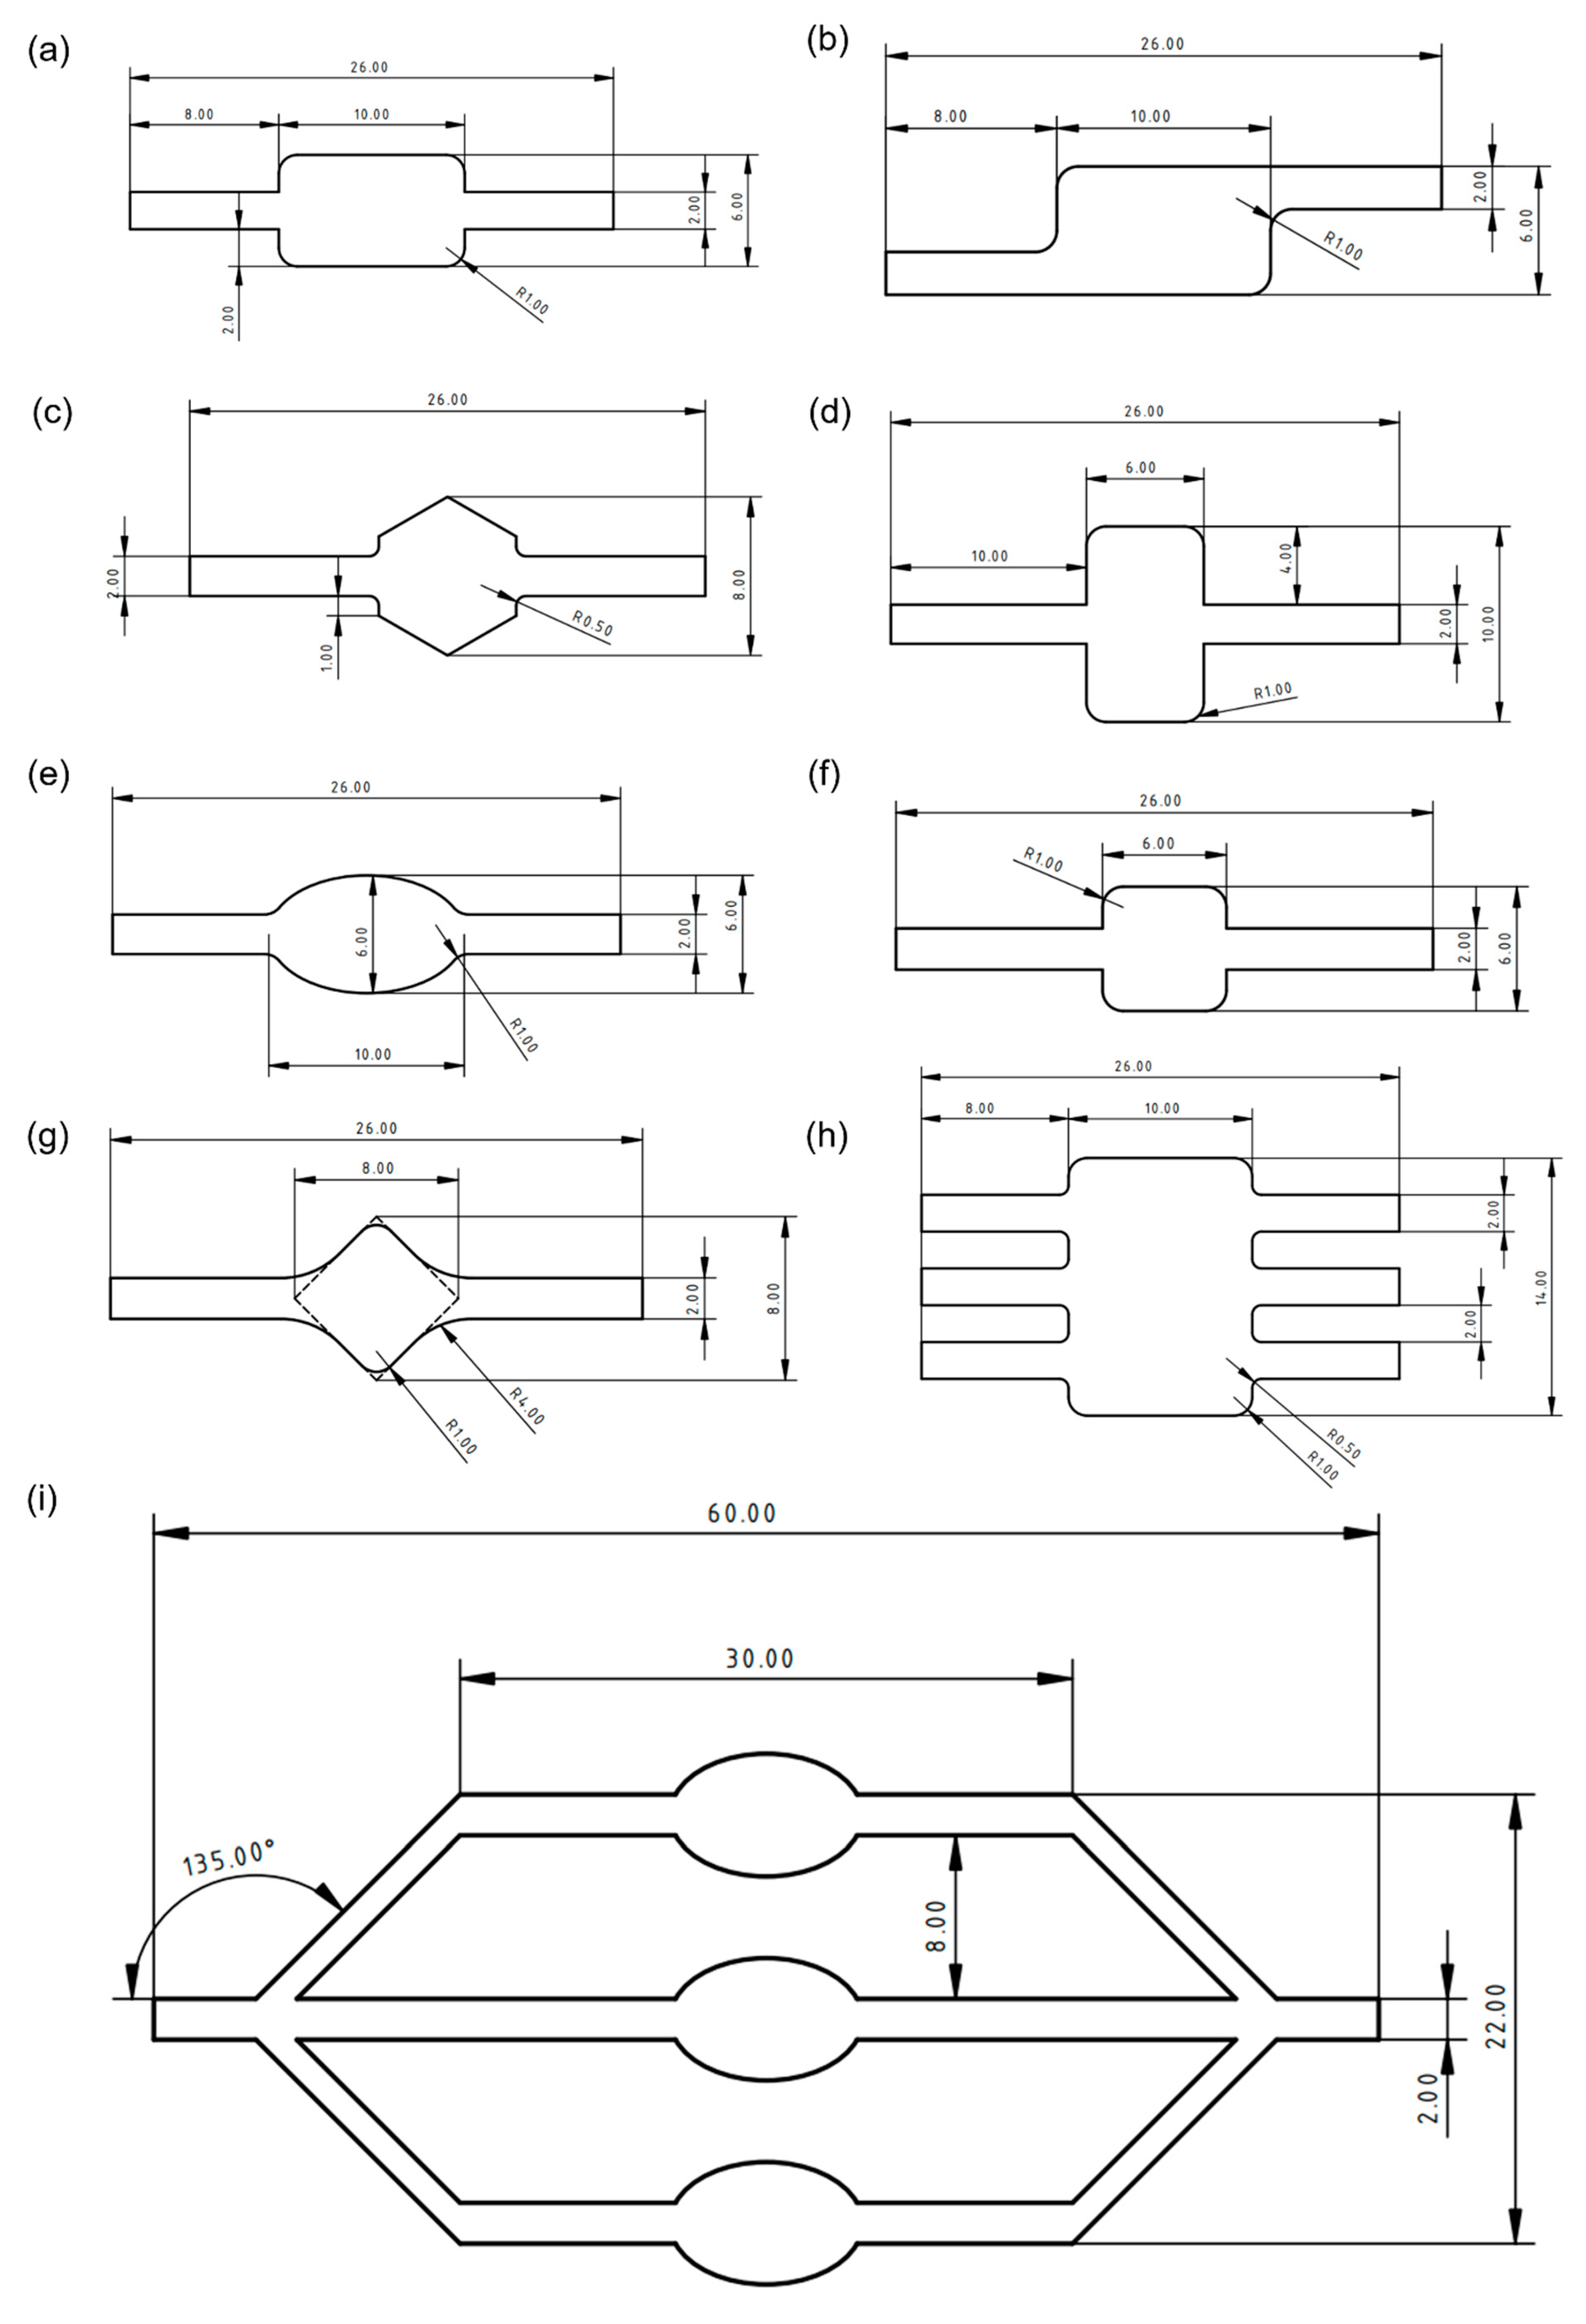
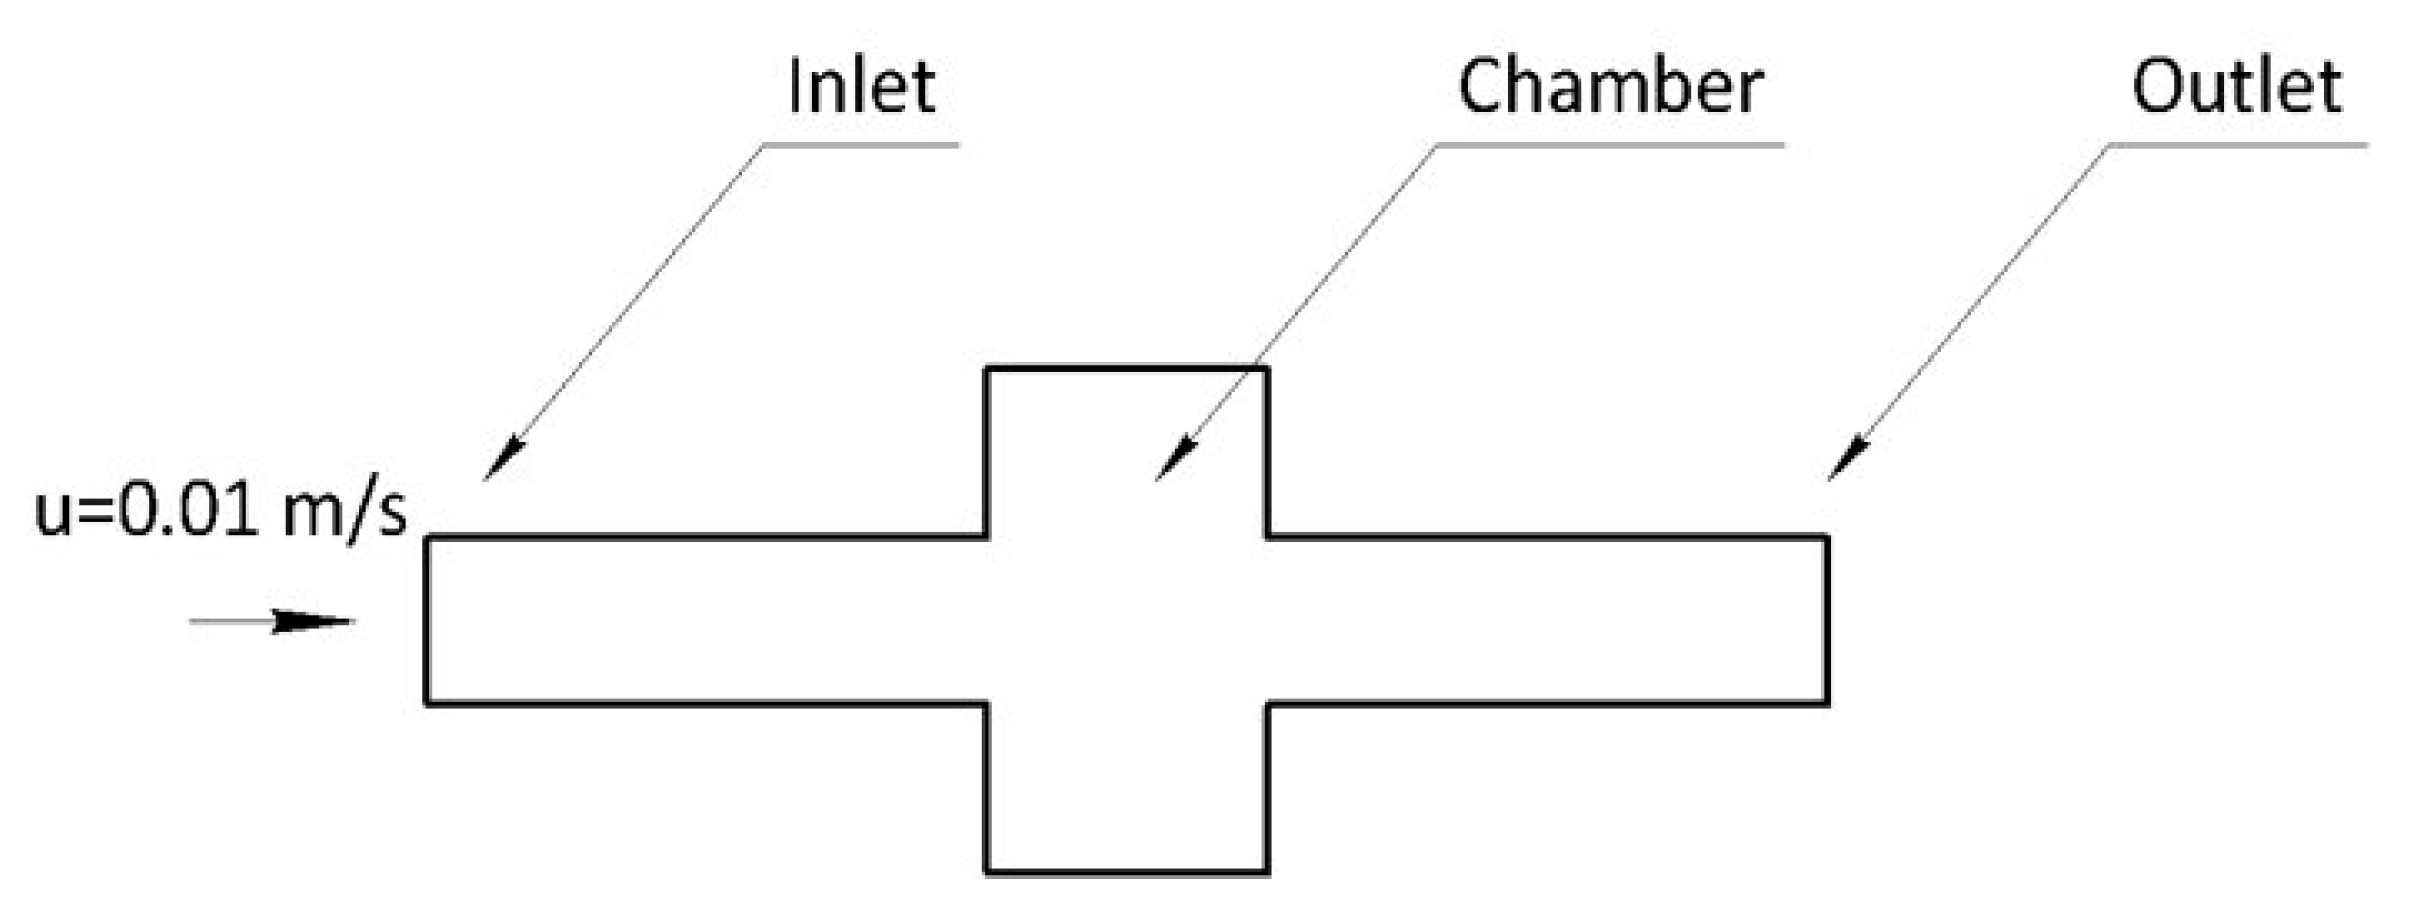
In order to conduct the analysis, the microfluidic structure should provide a uniform fluid flow. One way of achieving this is changing the internal geometry of a microfluidic chamber. In this study, several computational simulations in COMSOL Multiphysics were conducted to assess how different chamber shapes influence the flow parameters. Based on the results, a number of recommendations regarding the microfluidics chamber design are proposed.

2. Materials and Methods

In the present work, nine different chamber designs were simulated and compared quantitatively as shown in Figure 1.
The physical domain that was analysed for every chamber design consisted of a typical microfluidic domain with an inlet section, a chamber and an outlet section as it is depicted in Figure 2. In the simulations, the fluid flow had an initial velocity of 0.01 m/s and was considered to be laminar. The fluid used in this scenario had a density of 1080 kg/m3 and a dynamic viscosity of 1.75 mPa·s. The total length of all microfluidics configurations that were analysed was constant and equal to 26 mm, except for the focus flow chamber design which had a length of 100 mm. The thickness of all domains was equal to 2 mm and sharp edges were smoothened using fillets with radii of 1 mm. Seven cases were analysed for determining the influence of the chamber design, one case featured the trifurcation of chambers and one case included multiplication of inlets and outlets.

Computational Domain and Boundary Conditions

The fluid flow is governed by the system of the Reynolds-Averaged Navier–Stokes partial differential equations and can be solved numerically using the finite element method [6,7,8]. In this work, the commercial software COMSOL Multiphysics was utilised in order to analyse the flow and obtain data regarding the distribution of the flow parameters inside the microfluidics circuit. To achieve this, the Laminar flow module with a Stationary time-independent study was selected. Inlet boundary condition (BC) was assigned to the respective inlet, Outlet BC was assigned to the outlet, while all remaining faces were auto-assigned with Wall BC. For the flow analysis, the computational domain was discretised using a mesh which was automatically generated and optimised for providing accuracy. The results of simulations were post-processed and visualised using the COMSOL Multiphysics postprocessor.

3. Results and Discussion

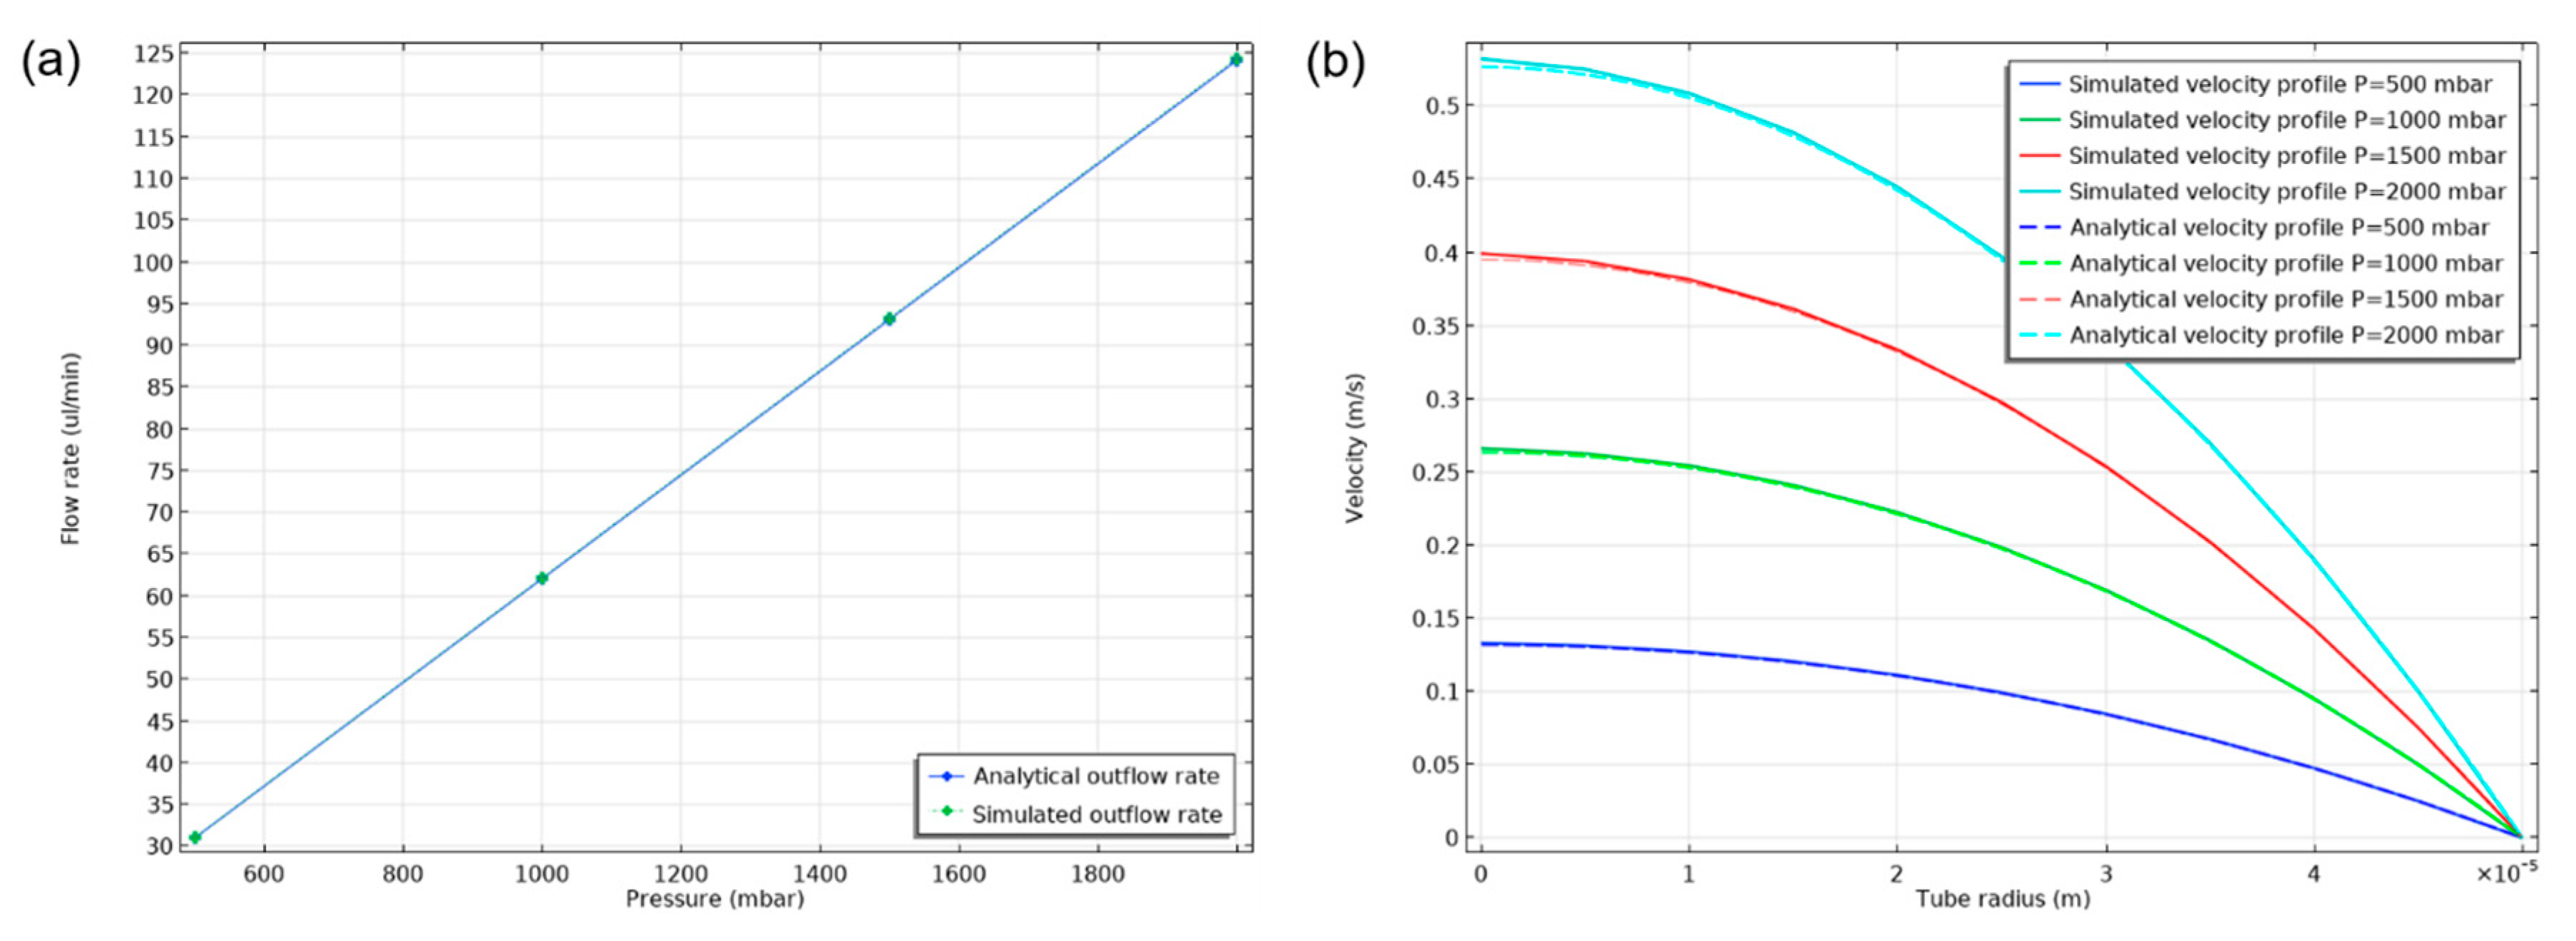
The laminar flow inside a circular pipe can be described analytically. The flow rate is linked to the pressure drop inside the pipe through the following equation:
Q = Δp(πR4)/(8ηl)
where Q is the fluid flow rate, Δp is the pressure drop between inlet and outlet of the channel, R is the channel radius, η is the fluid dynamic viscosity and l is the channel length.
The radial velocity distribution of the fully developed flow inside the cylindrical channel is described as:
u(r) = Δp (R2 − r2)/(4ηl)
where r is the radial distance from the axis.
In order to validate the results of the selected mathematical model, a two-dimensional axisymmetric case of a 235 mm long and 100 um diameter cylindrical channel was simulated and compared with the analytical results of Equations (1) and (2). Inlet, outlet and wall boundary conditions were used in the domain boundaries. A fully developed flow was imposed at the inlet where different static pressure values were fixed from 500 mbar to 2000 mbar with a step of 500 mbar. Results from the parametric simulation are presented in Figure 3. An excellent agreement between the computed and analytical flow rate–static pressure relation (Equation (1)) and of the velocity profiles (Equation (2)). The velocity profiles show a tendency to overestimate the analytical values near the axis of the channel and the difference is greater as the pressure drop increases. These results validate the accuracy of the selected computational model in this range of laminar flow conditions inside microchannels.
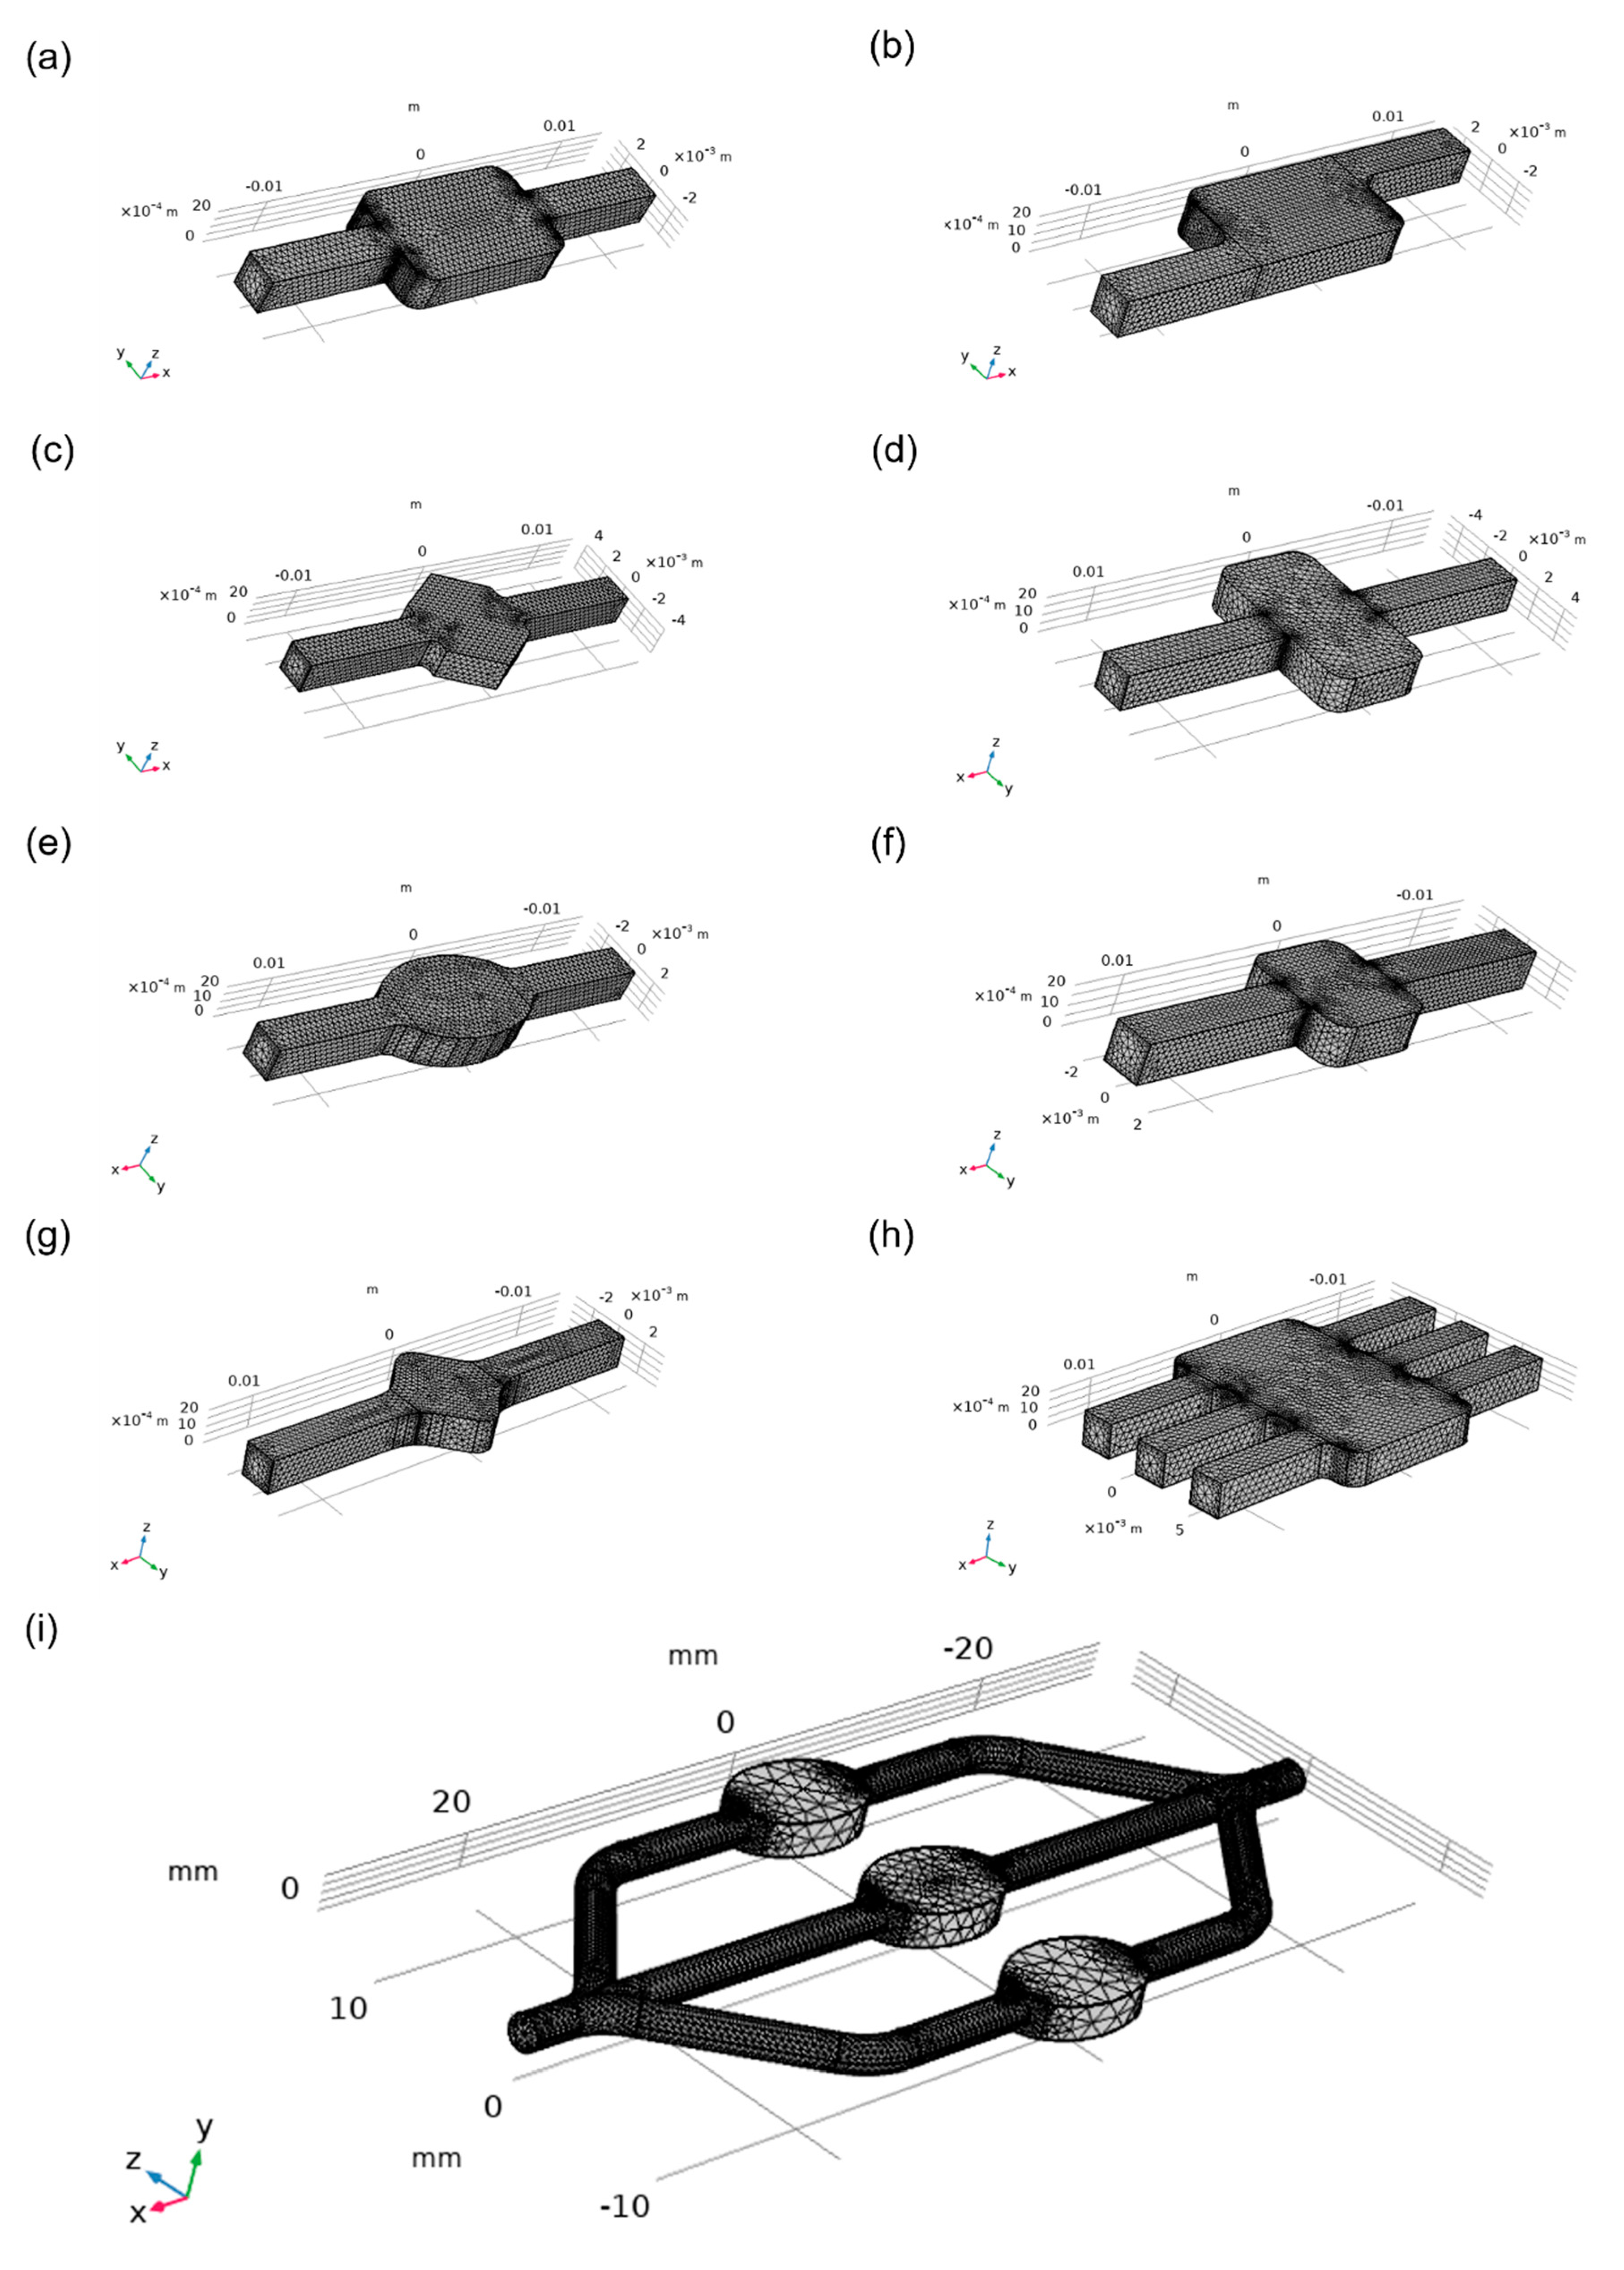
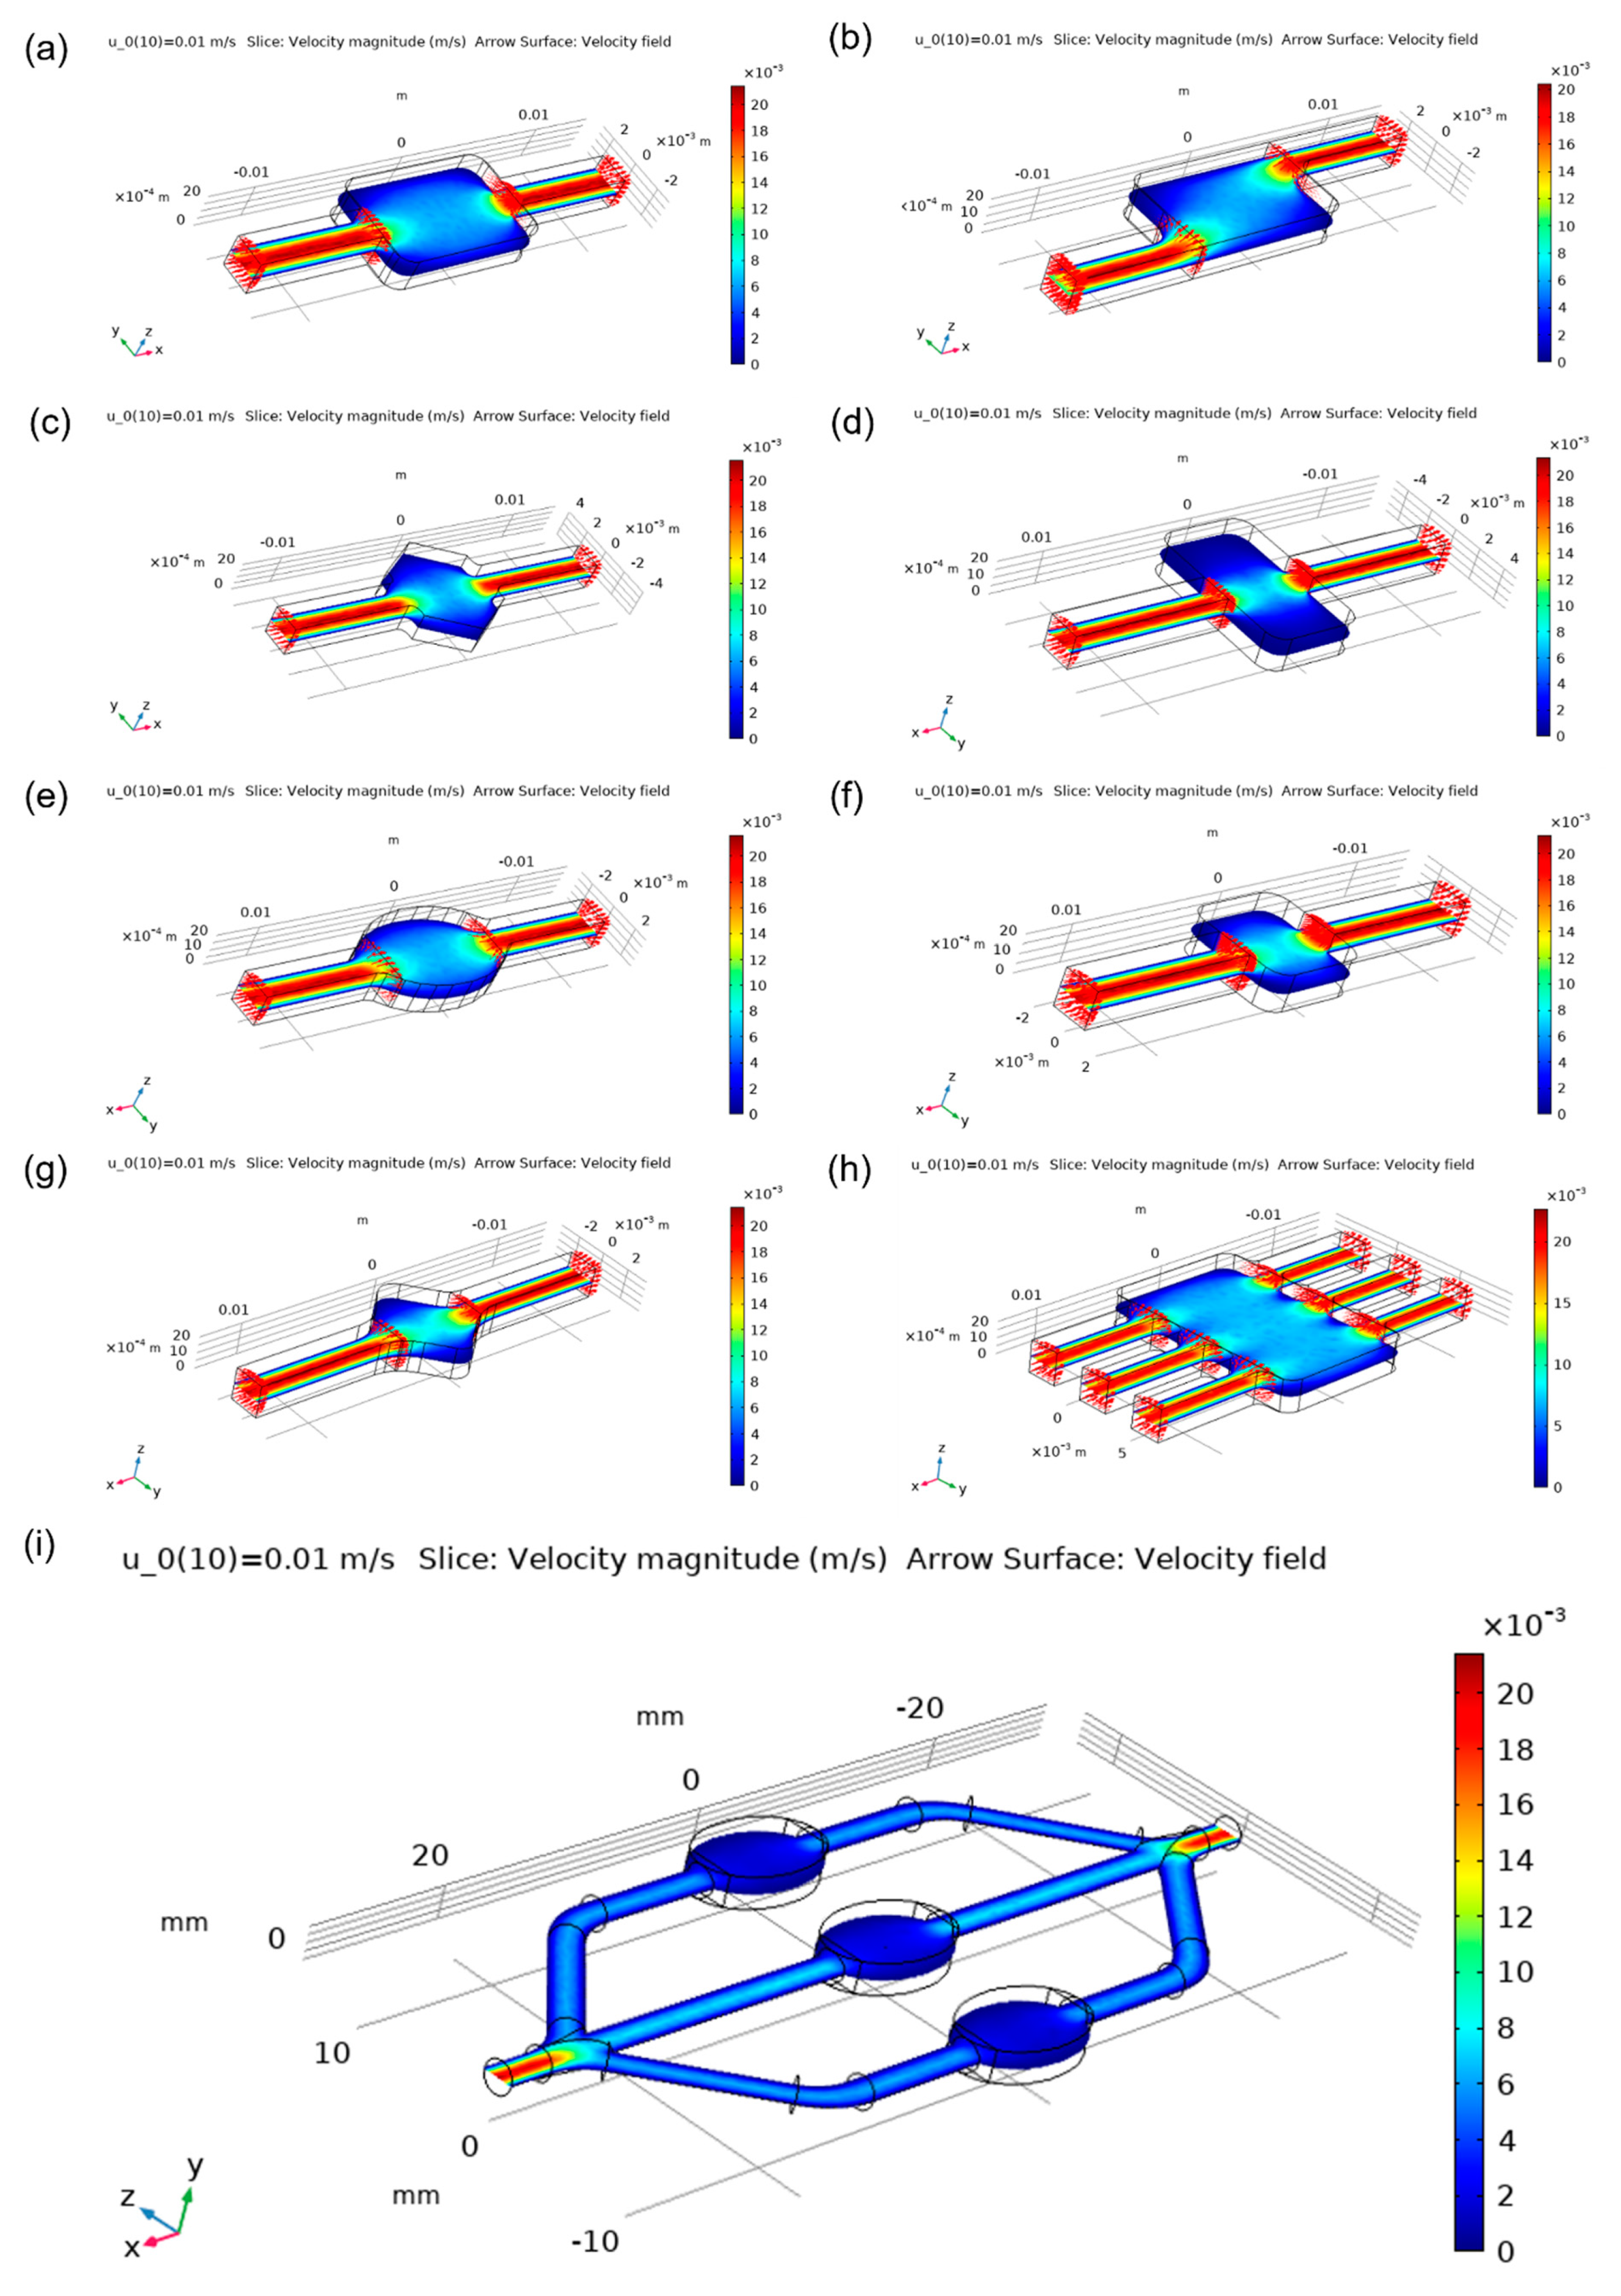
One of the most important characteristics of the microfluidic chamber is its ability to maintain a homogenous flow. Meshes that were used for simulations were generated by COMSOL automatically and are shown in 
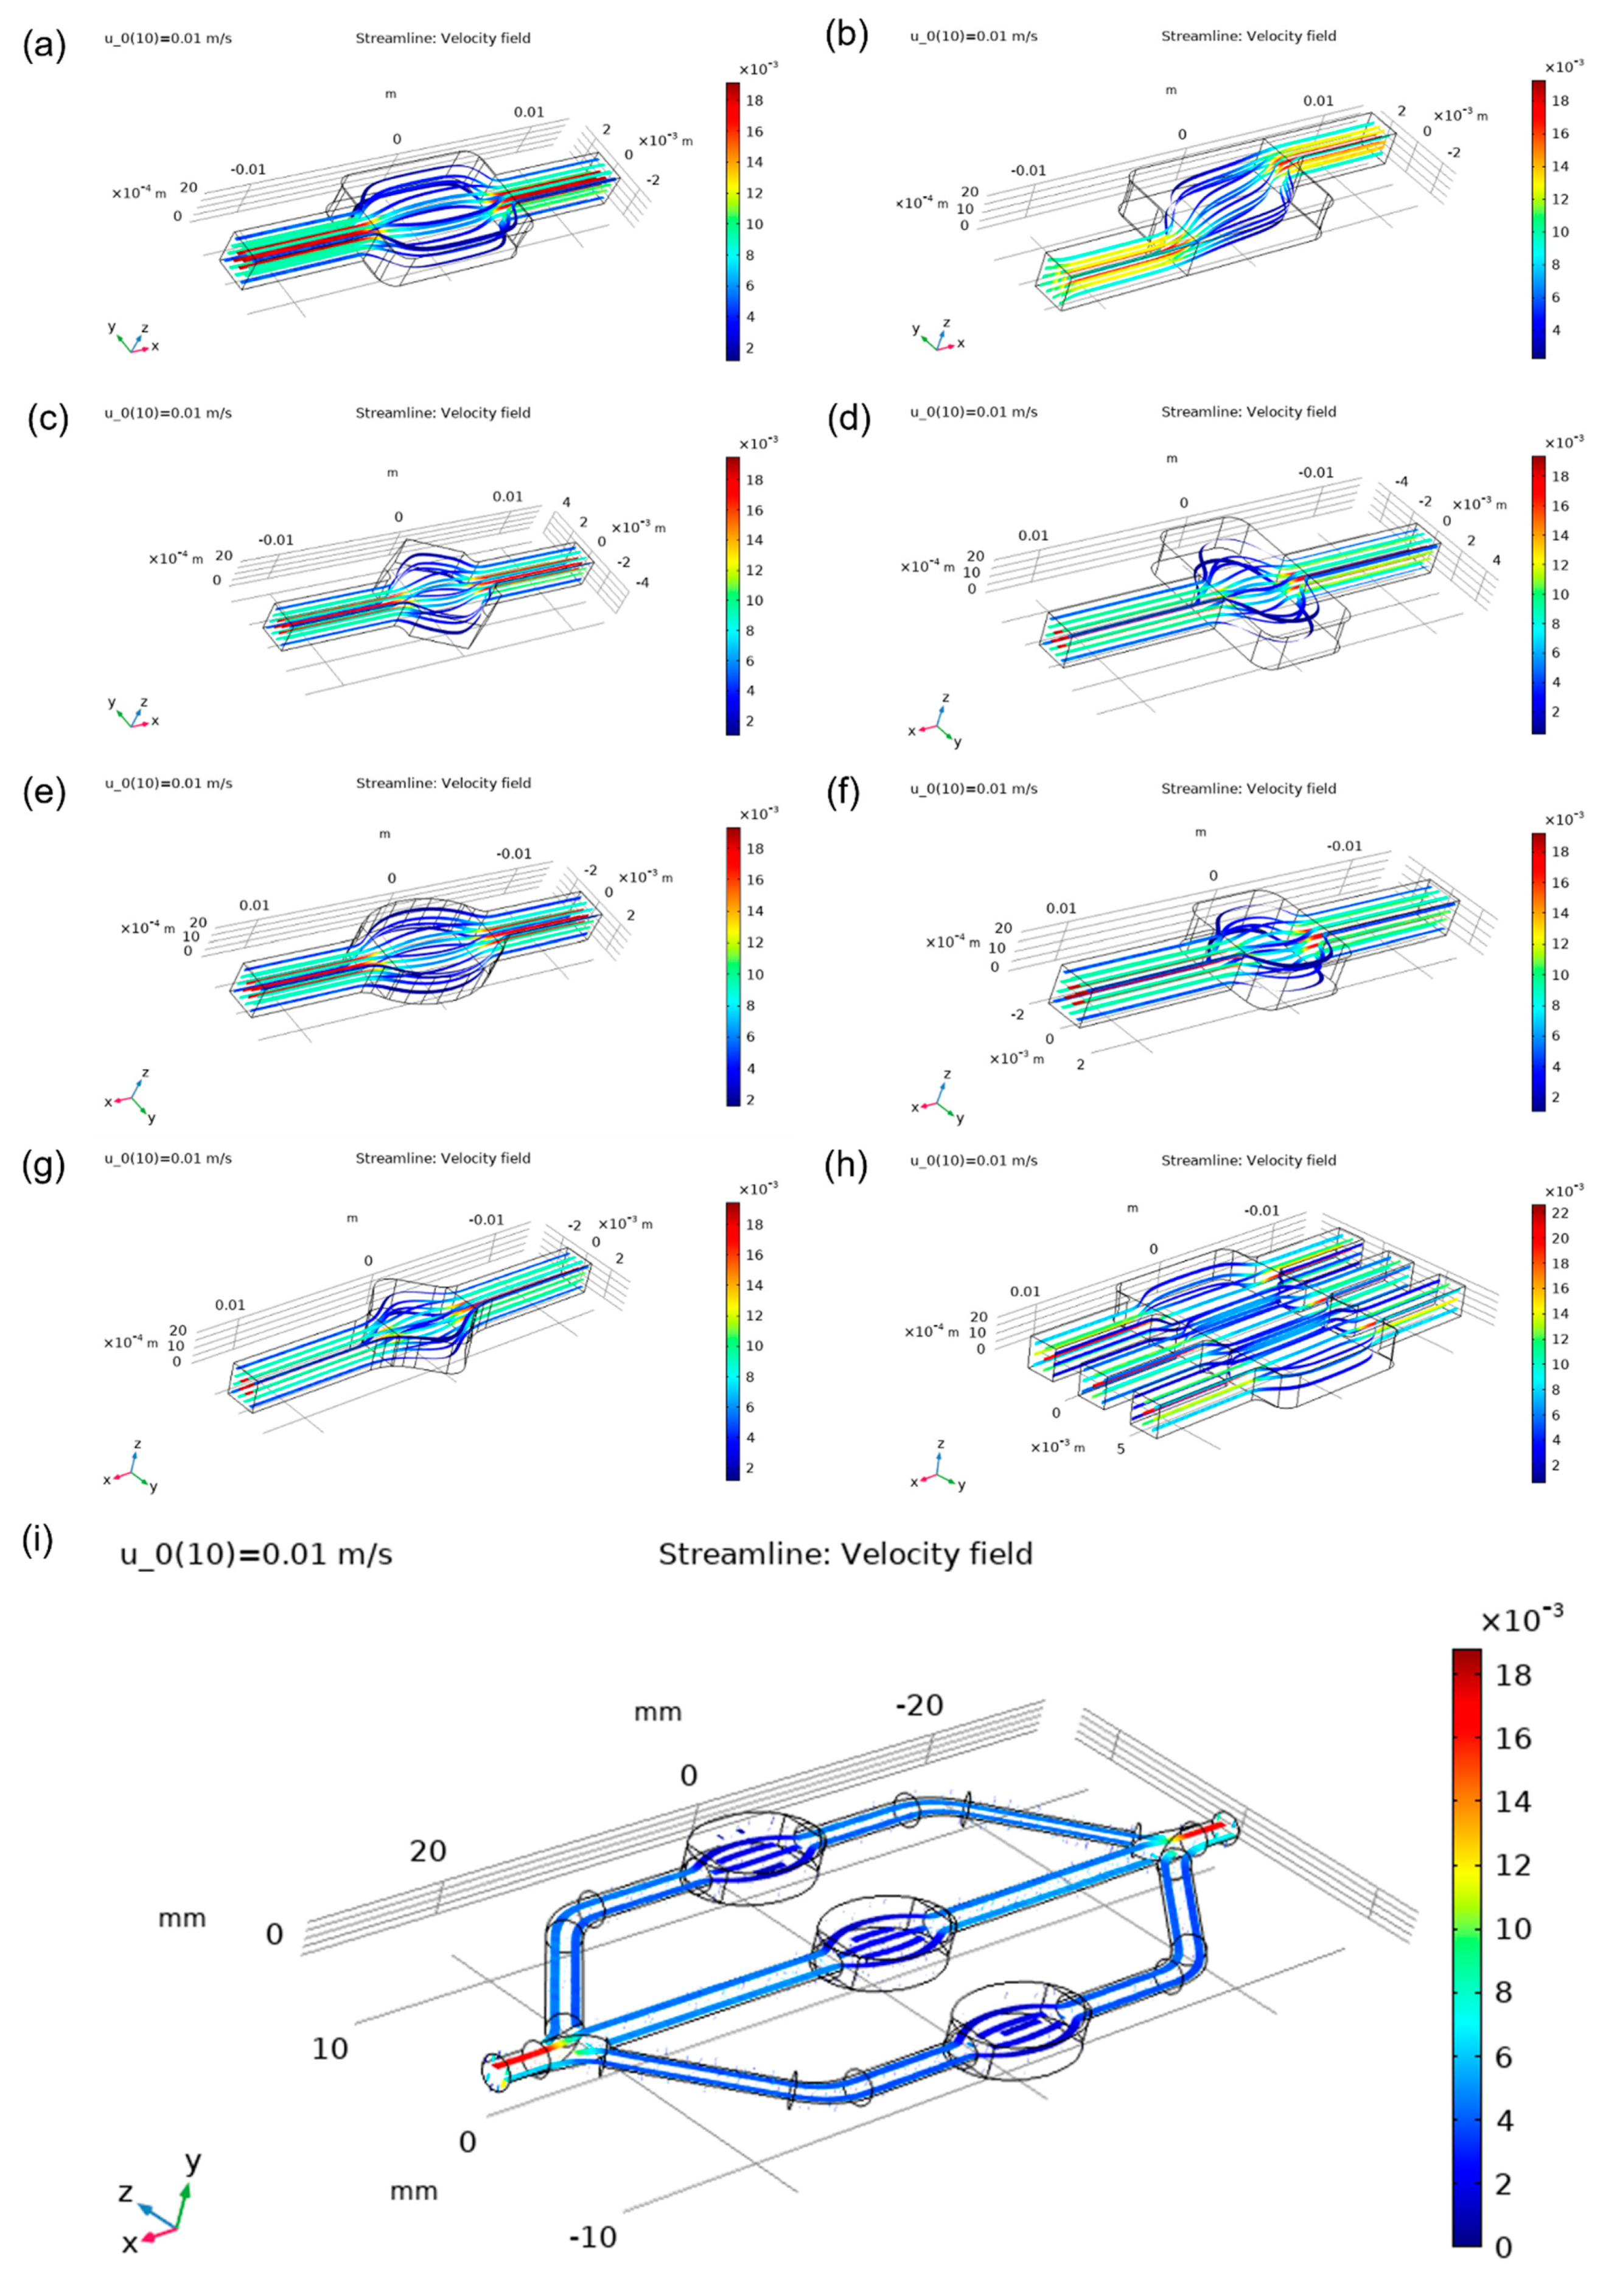
Figure 4. Designs were compared based on velocity magnitude inside the chamber, 
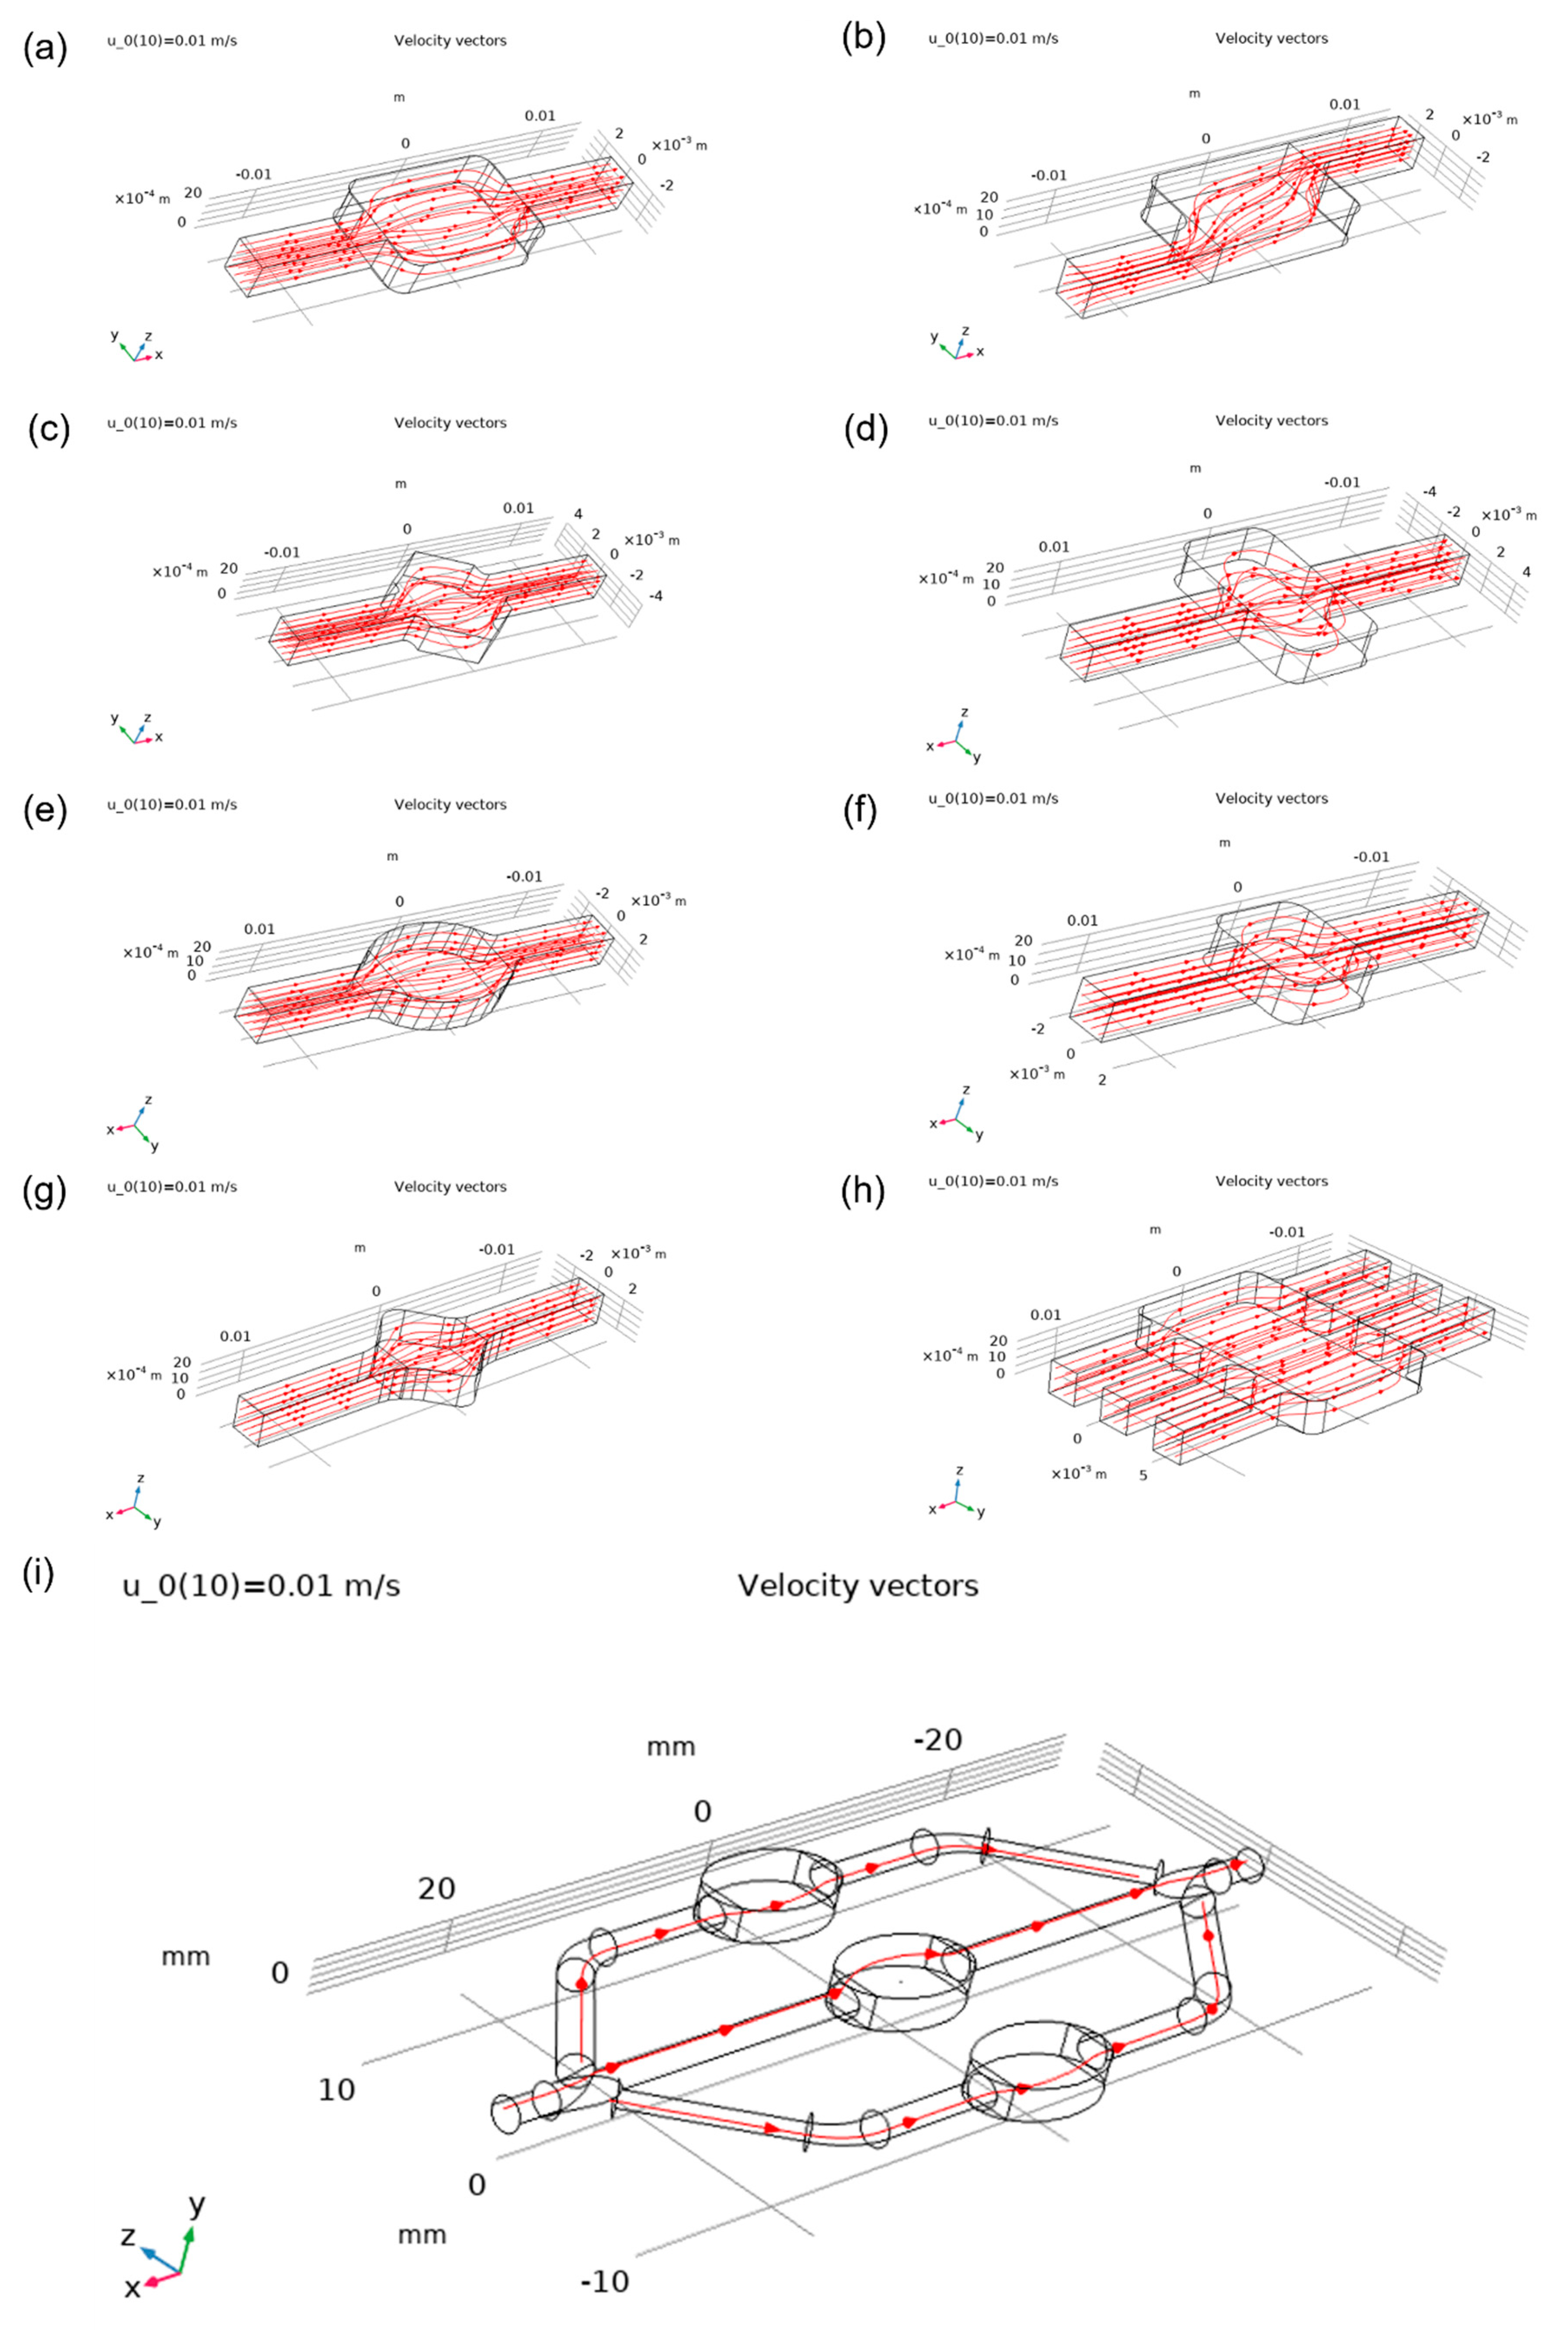
Figure 5. More cyan colouring of the chamber means a more even distribution of the analyte. Square and wide rectangular chambers showed large difference between the middle of the chamber and its side walls, thus making them less effective than other designs. The oval-shaped chamber presented one of the most homogenous flows, while the commonly used rectangular chamber showed good results but had some flow homogeneity around sharp corners. Asymmetric designs had a good behaviour which could be enhanced by optimising the design of the corners. The angled square resulted in a worse distribution than the hexagonal chamber design, while the latter showed relatively even distribution. The design with three inlets and outlets had one of the best distributions overall. The focus flow chamber design appeared to have a better distribution at the central chamber, while side chambers had a little less homogenous flow. Streamlines of the analyte as it moves inside the chambers can be visualised in Figure 6, and velocity vectors are presented in 
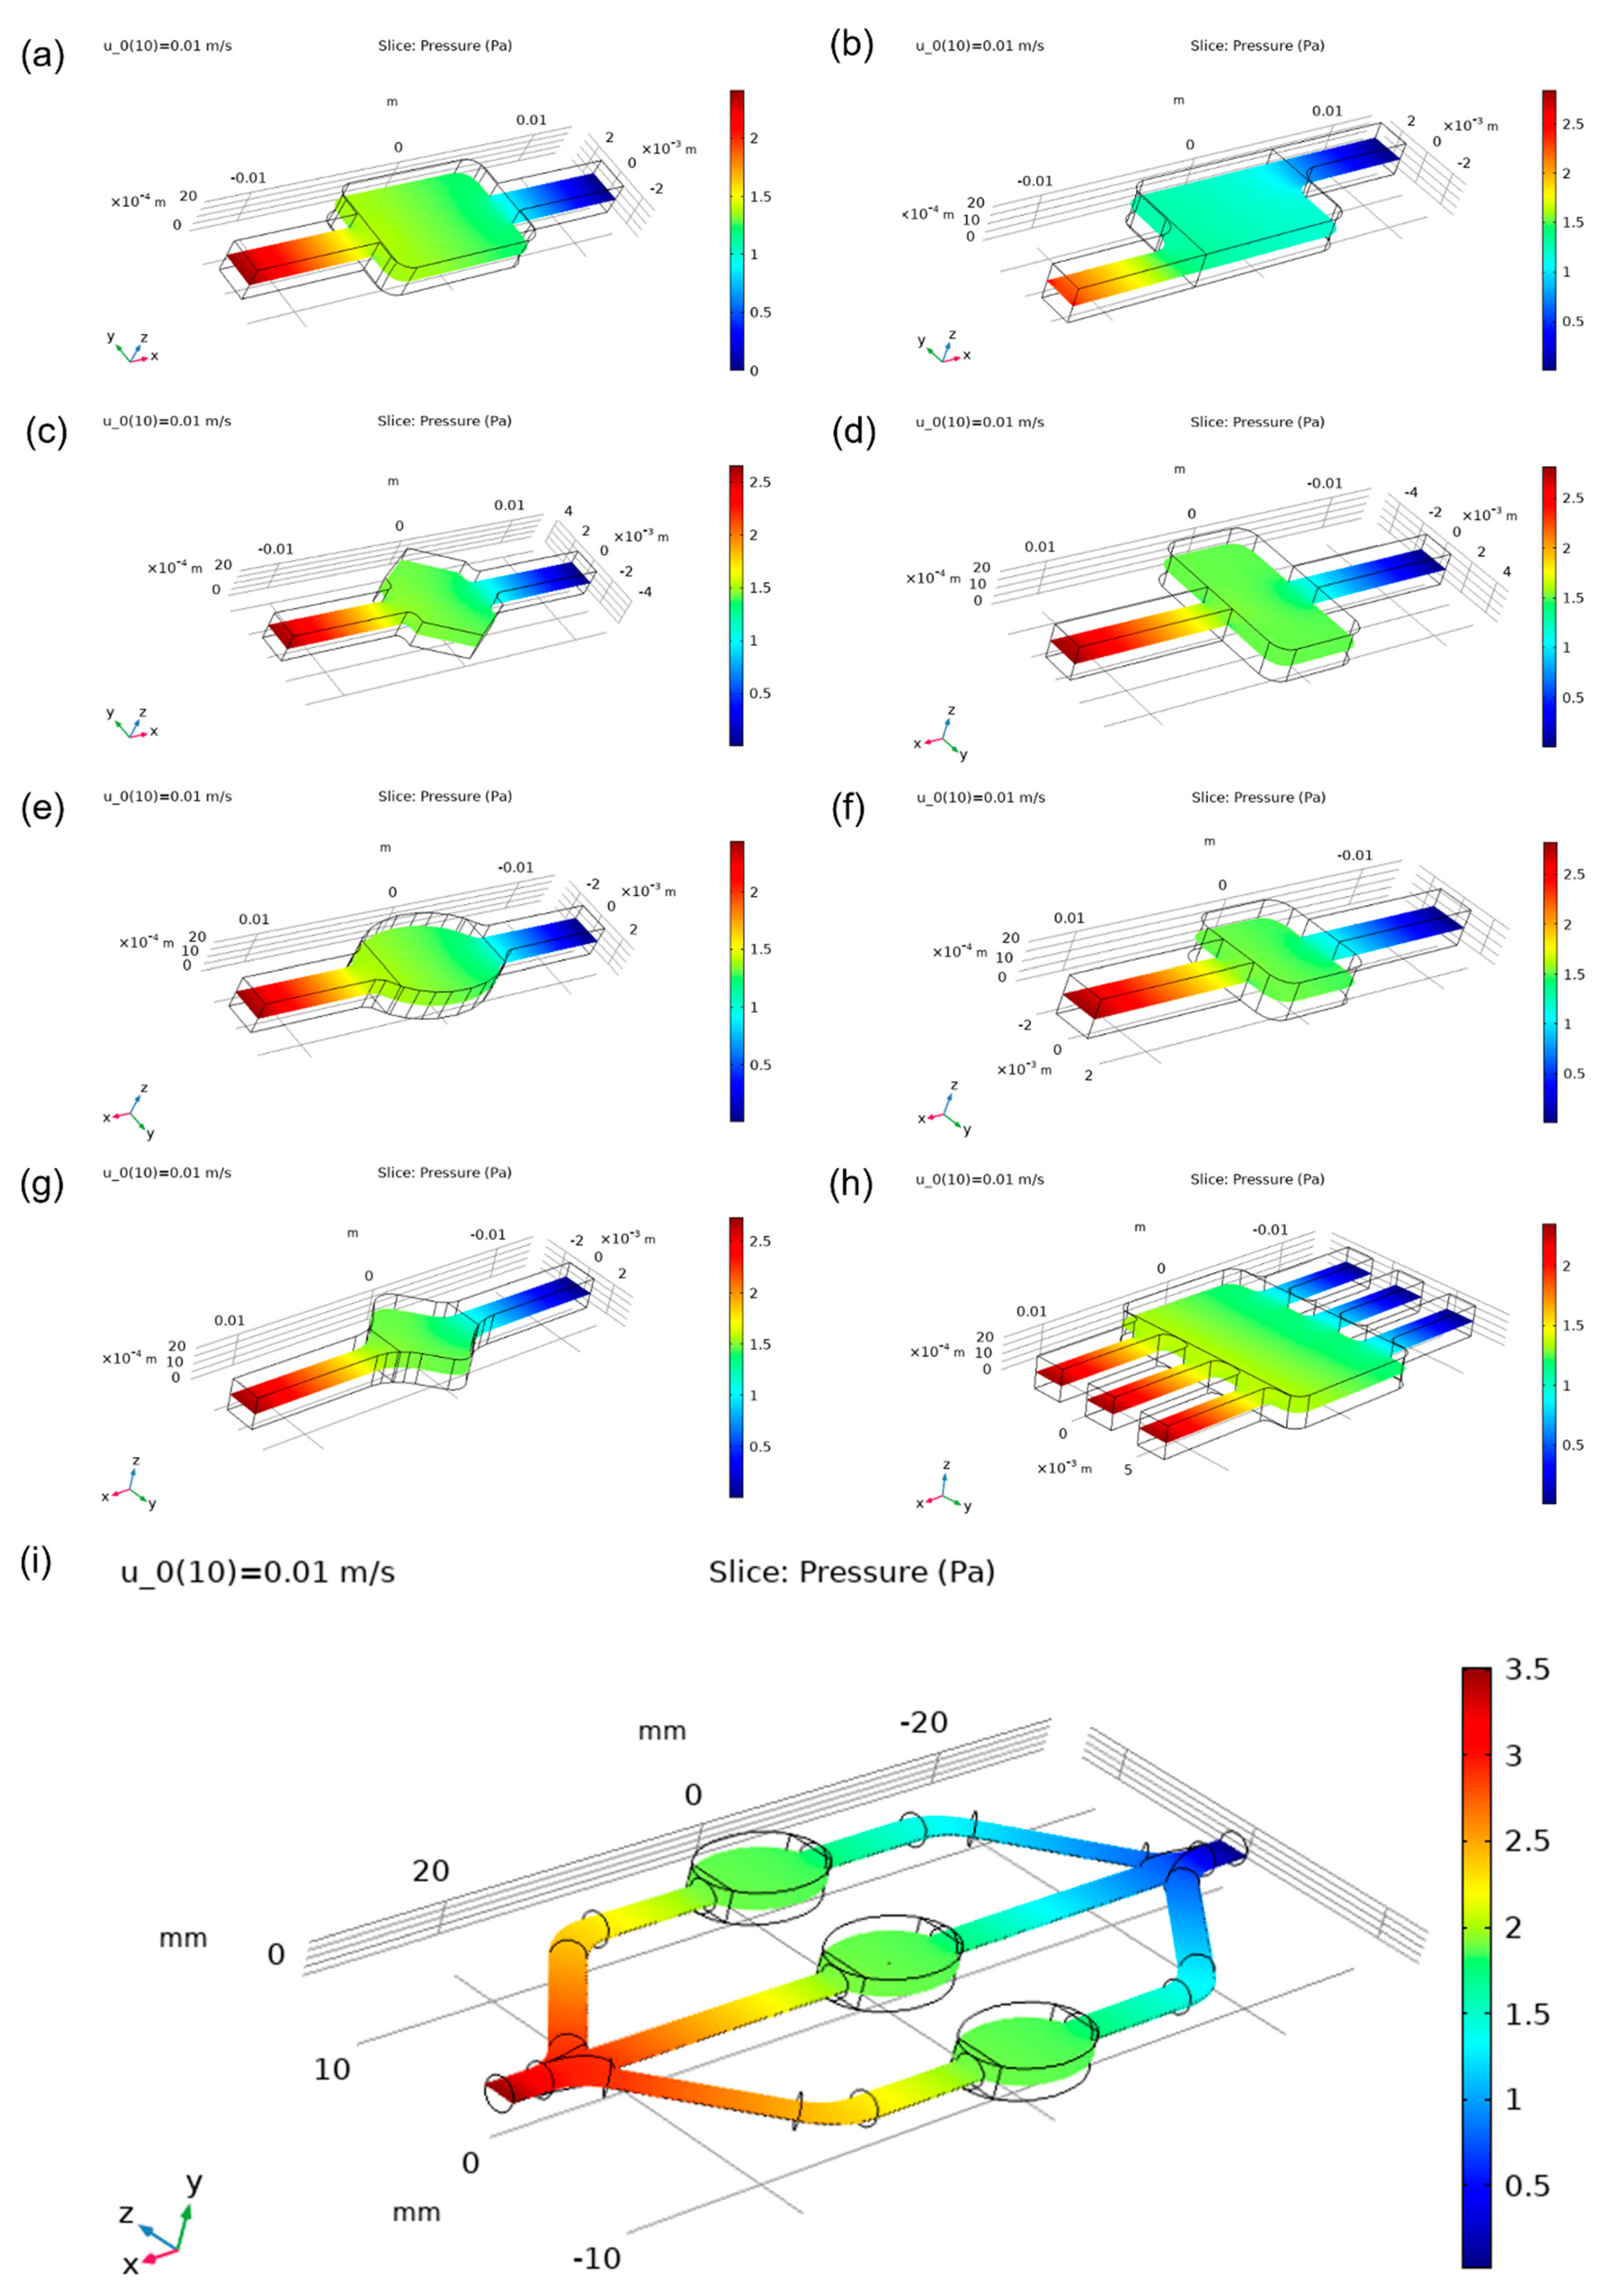
Figure 7. In addition, static pressure variation plots are presented in Figure 8 and show an even distribution of static pressure inside all chambers aside from the asymmetric one. Interestingly enough, it has a slightly lower relative value of pressure inside its chamber than other designs.
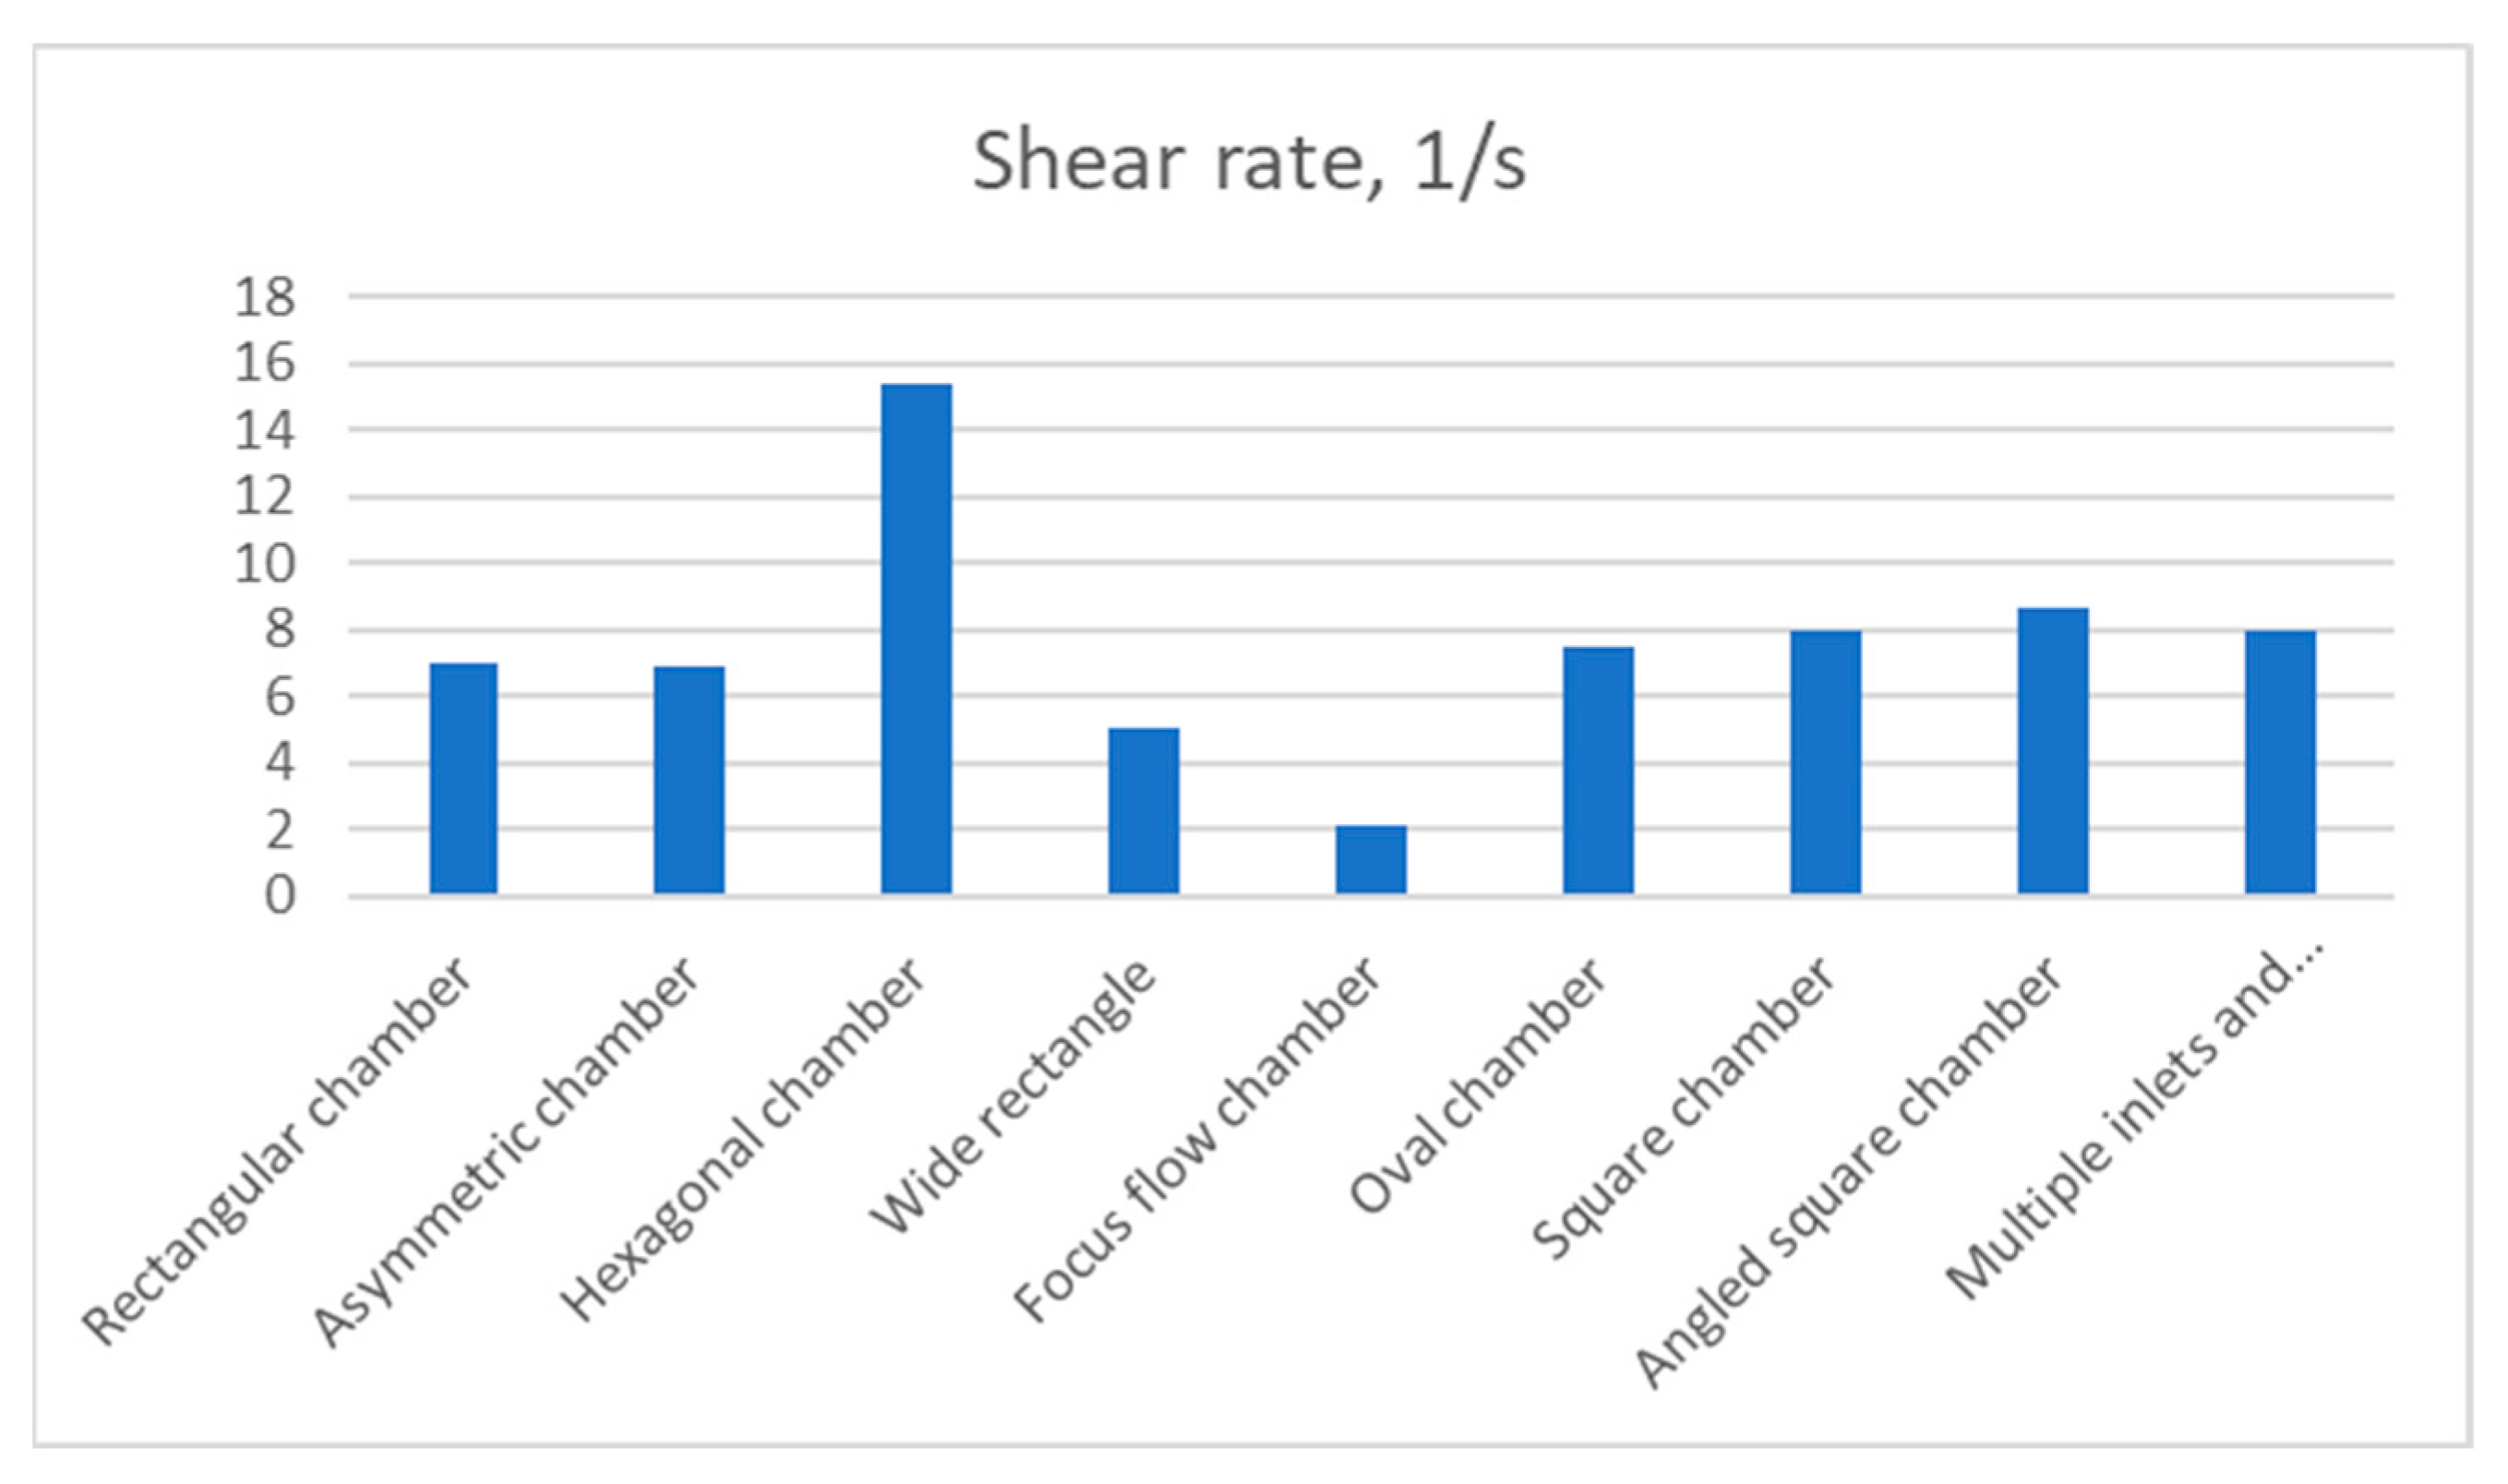
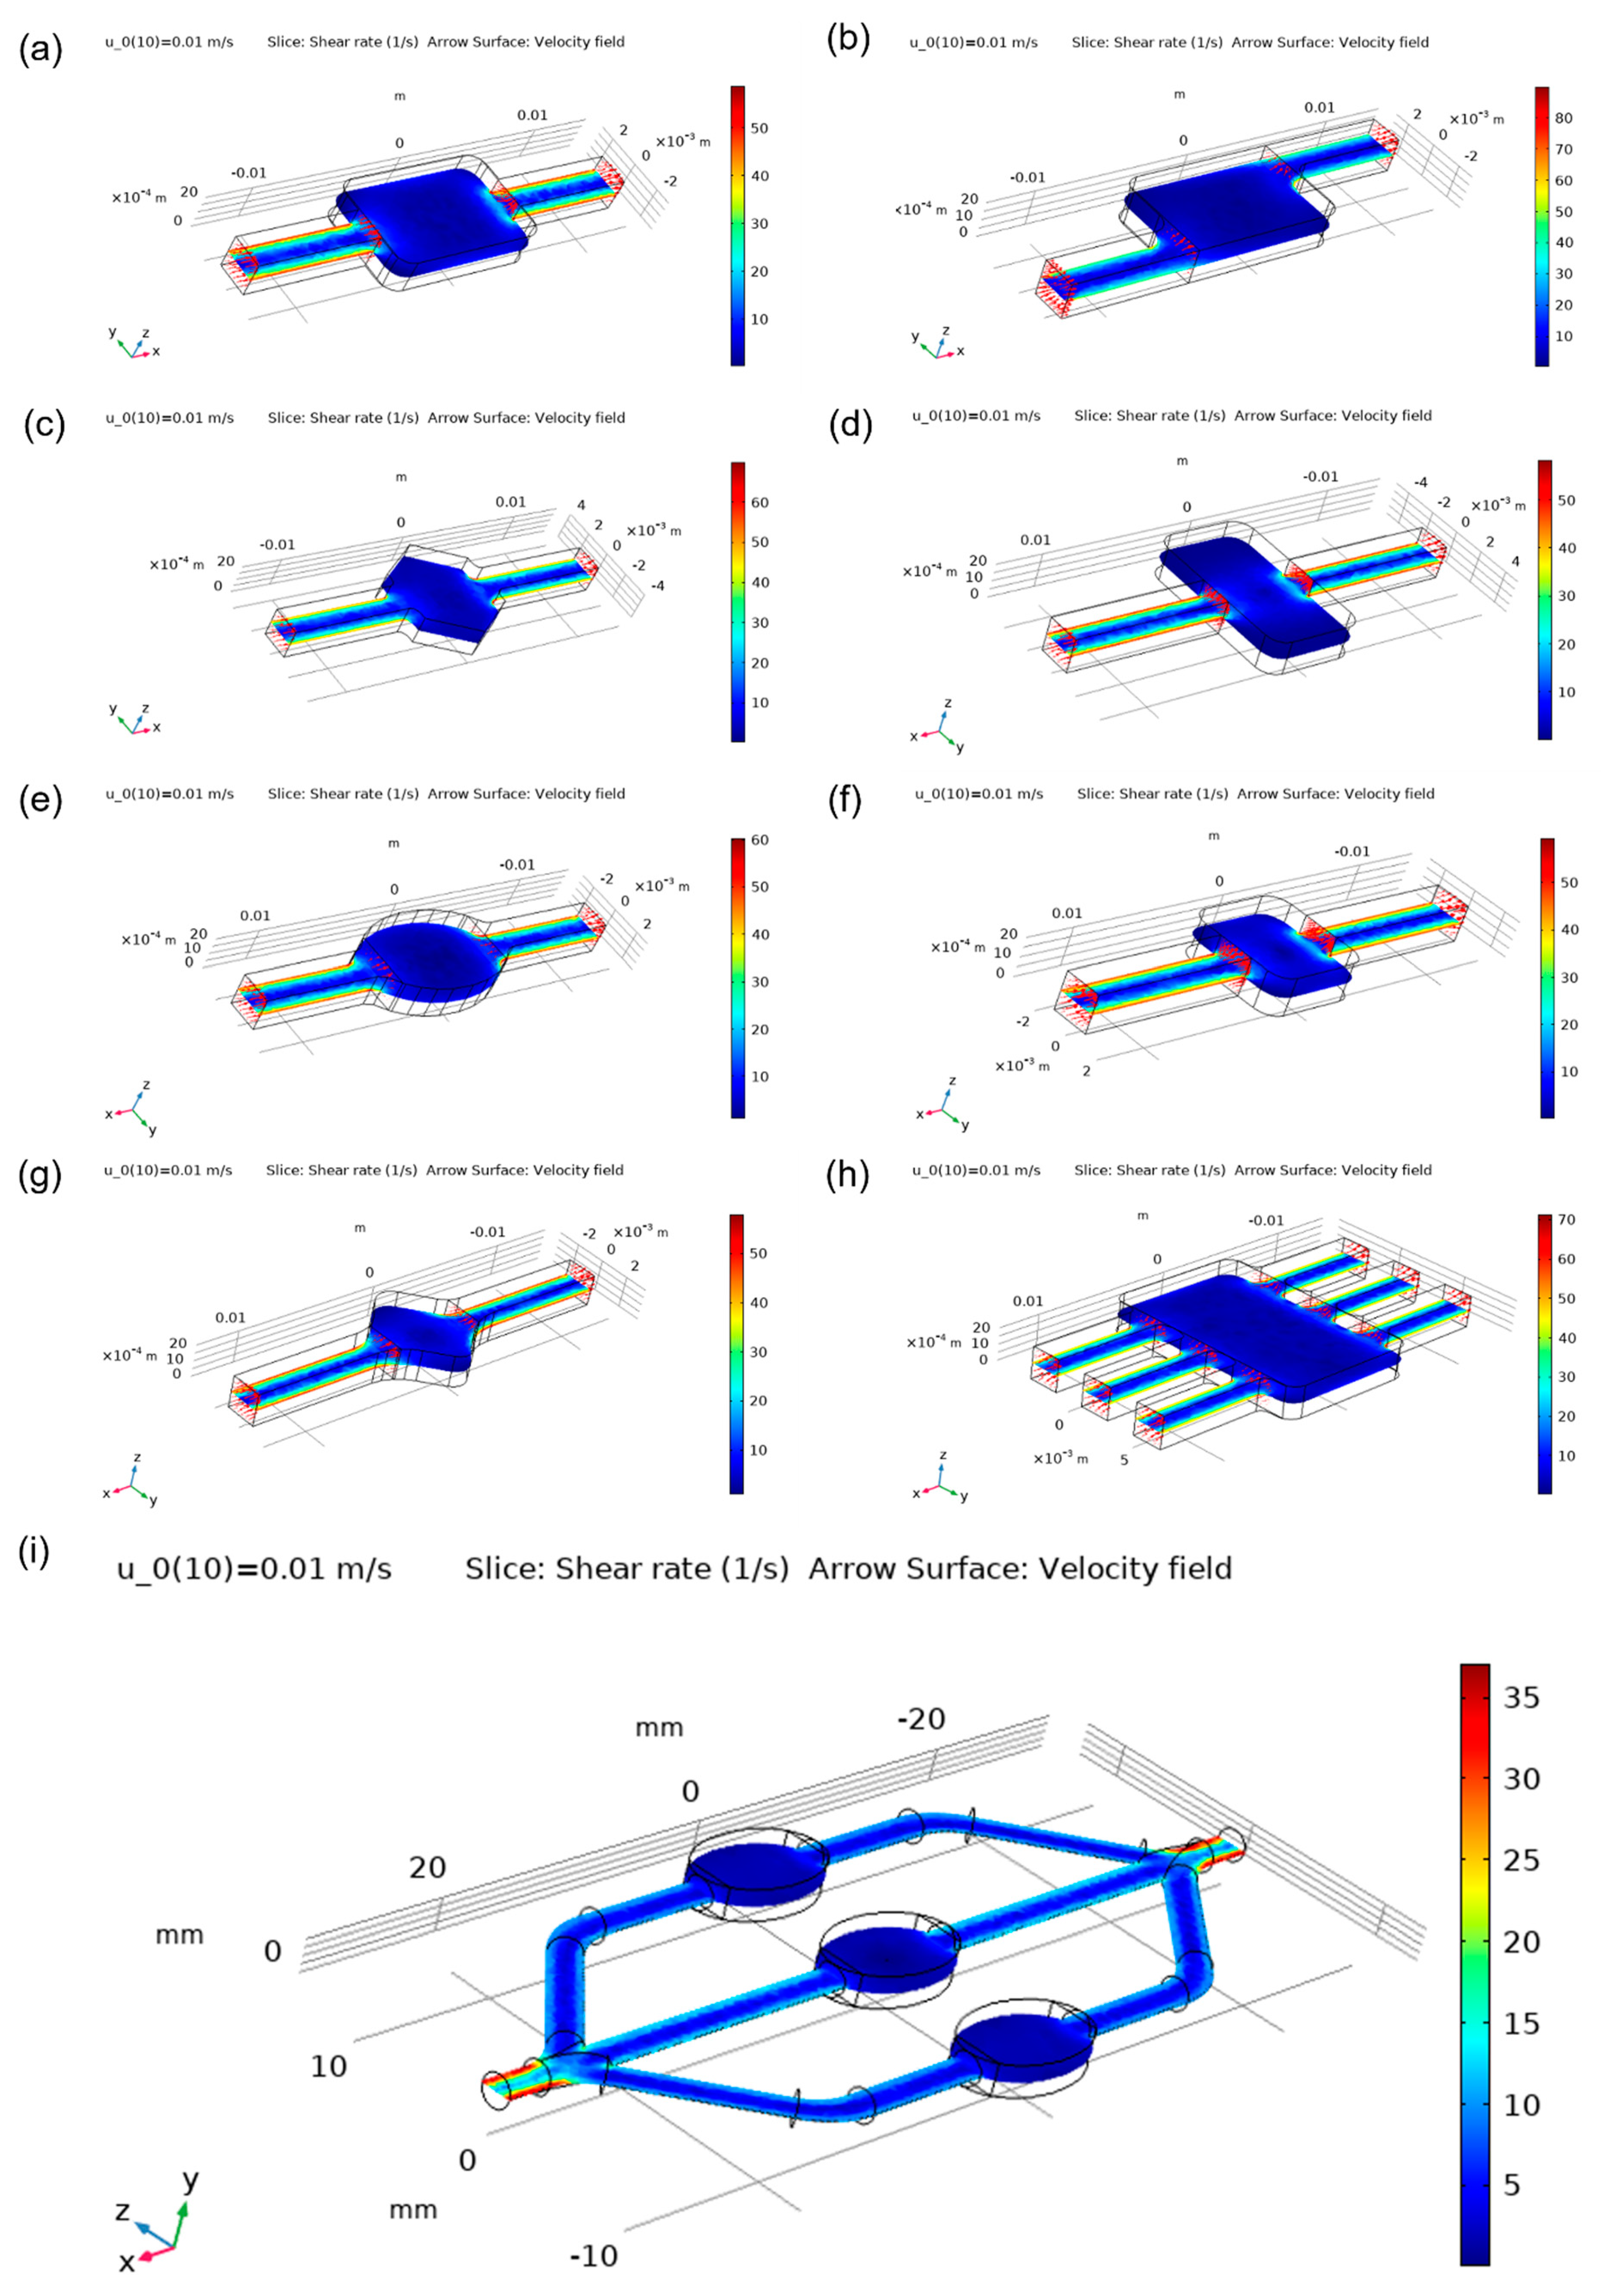
A useful flow quantity which can be used to assess the tendency of deformation that can be caused to the analyte molecules, is the shear rate which is calculated from the velocity gradients that are present inside the chamber. The shear rate distribution is presented in Figure 9 and shows that the asymmetric chamber, the oval chamber and its focus flow derivative are a good selection for moving the analyte though the microfluidic system without significant angular deformation effects. The hexagonal chamber, on the other hand, seems to have a distribution of high shear rate inside its domain.
In order to quantitively assess each design, the following parameters were compared in Table 1:
  • Average shear rate in the chamber;
  • Average pressure in the chamber;
  • Pumping power.
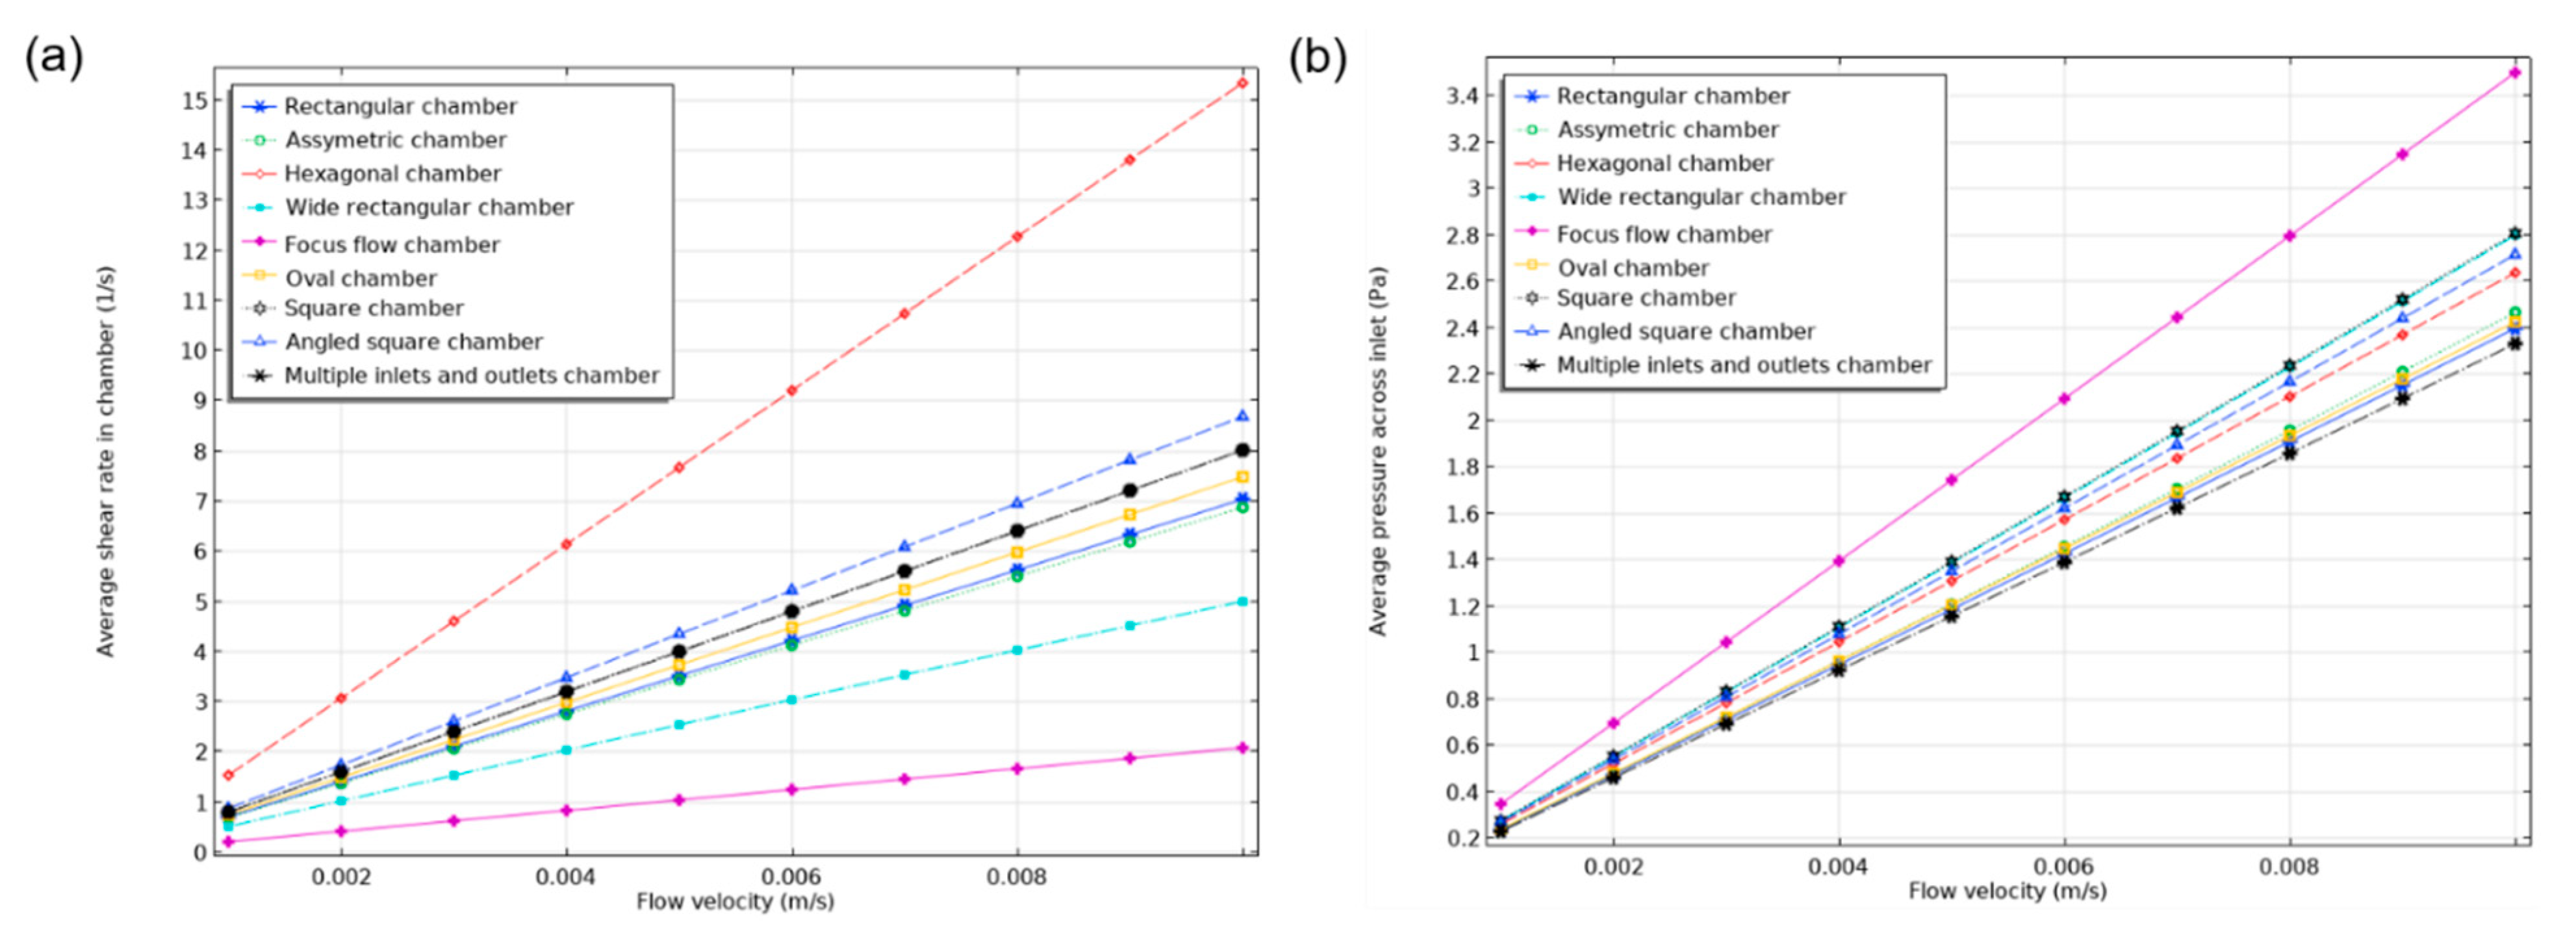
The hexagonal chamber demonstrated the highest value of shear rate (15.349 1/s) in relation to other designs, Figure 10. Consequently, the design with multiple inlets and outlets demonstrated an average value of shear that was similar to square and oval chambers and was slightly worse than the angled square chamber. The focus flow chamber design was the least favourable choice in terms of shear rate value. Surprisingly, the rectangular chamber and its asymmetric design were almost equivalent, with shear rates of 7.0423 1/s and 6.8807 1/s, respectively.
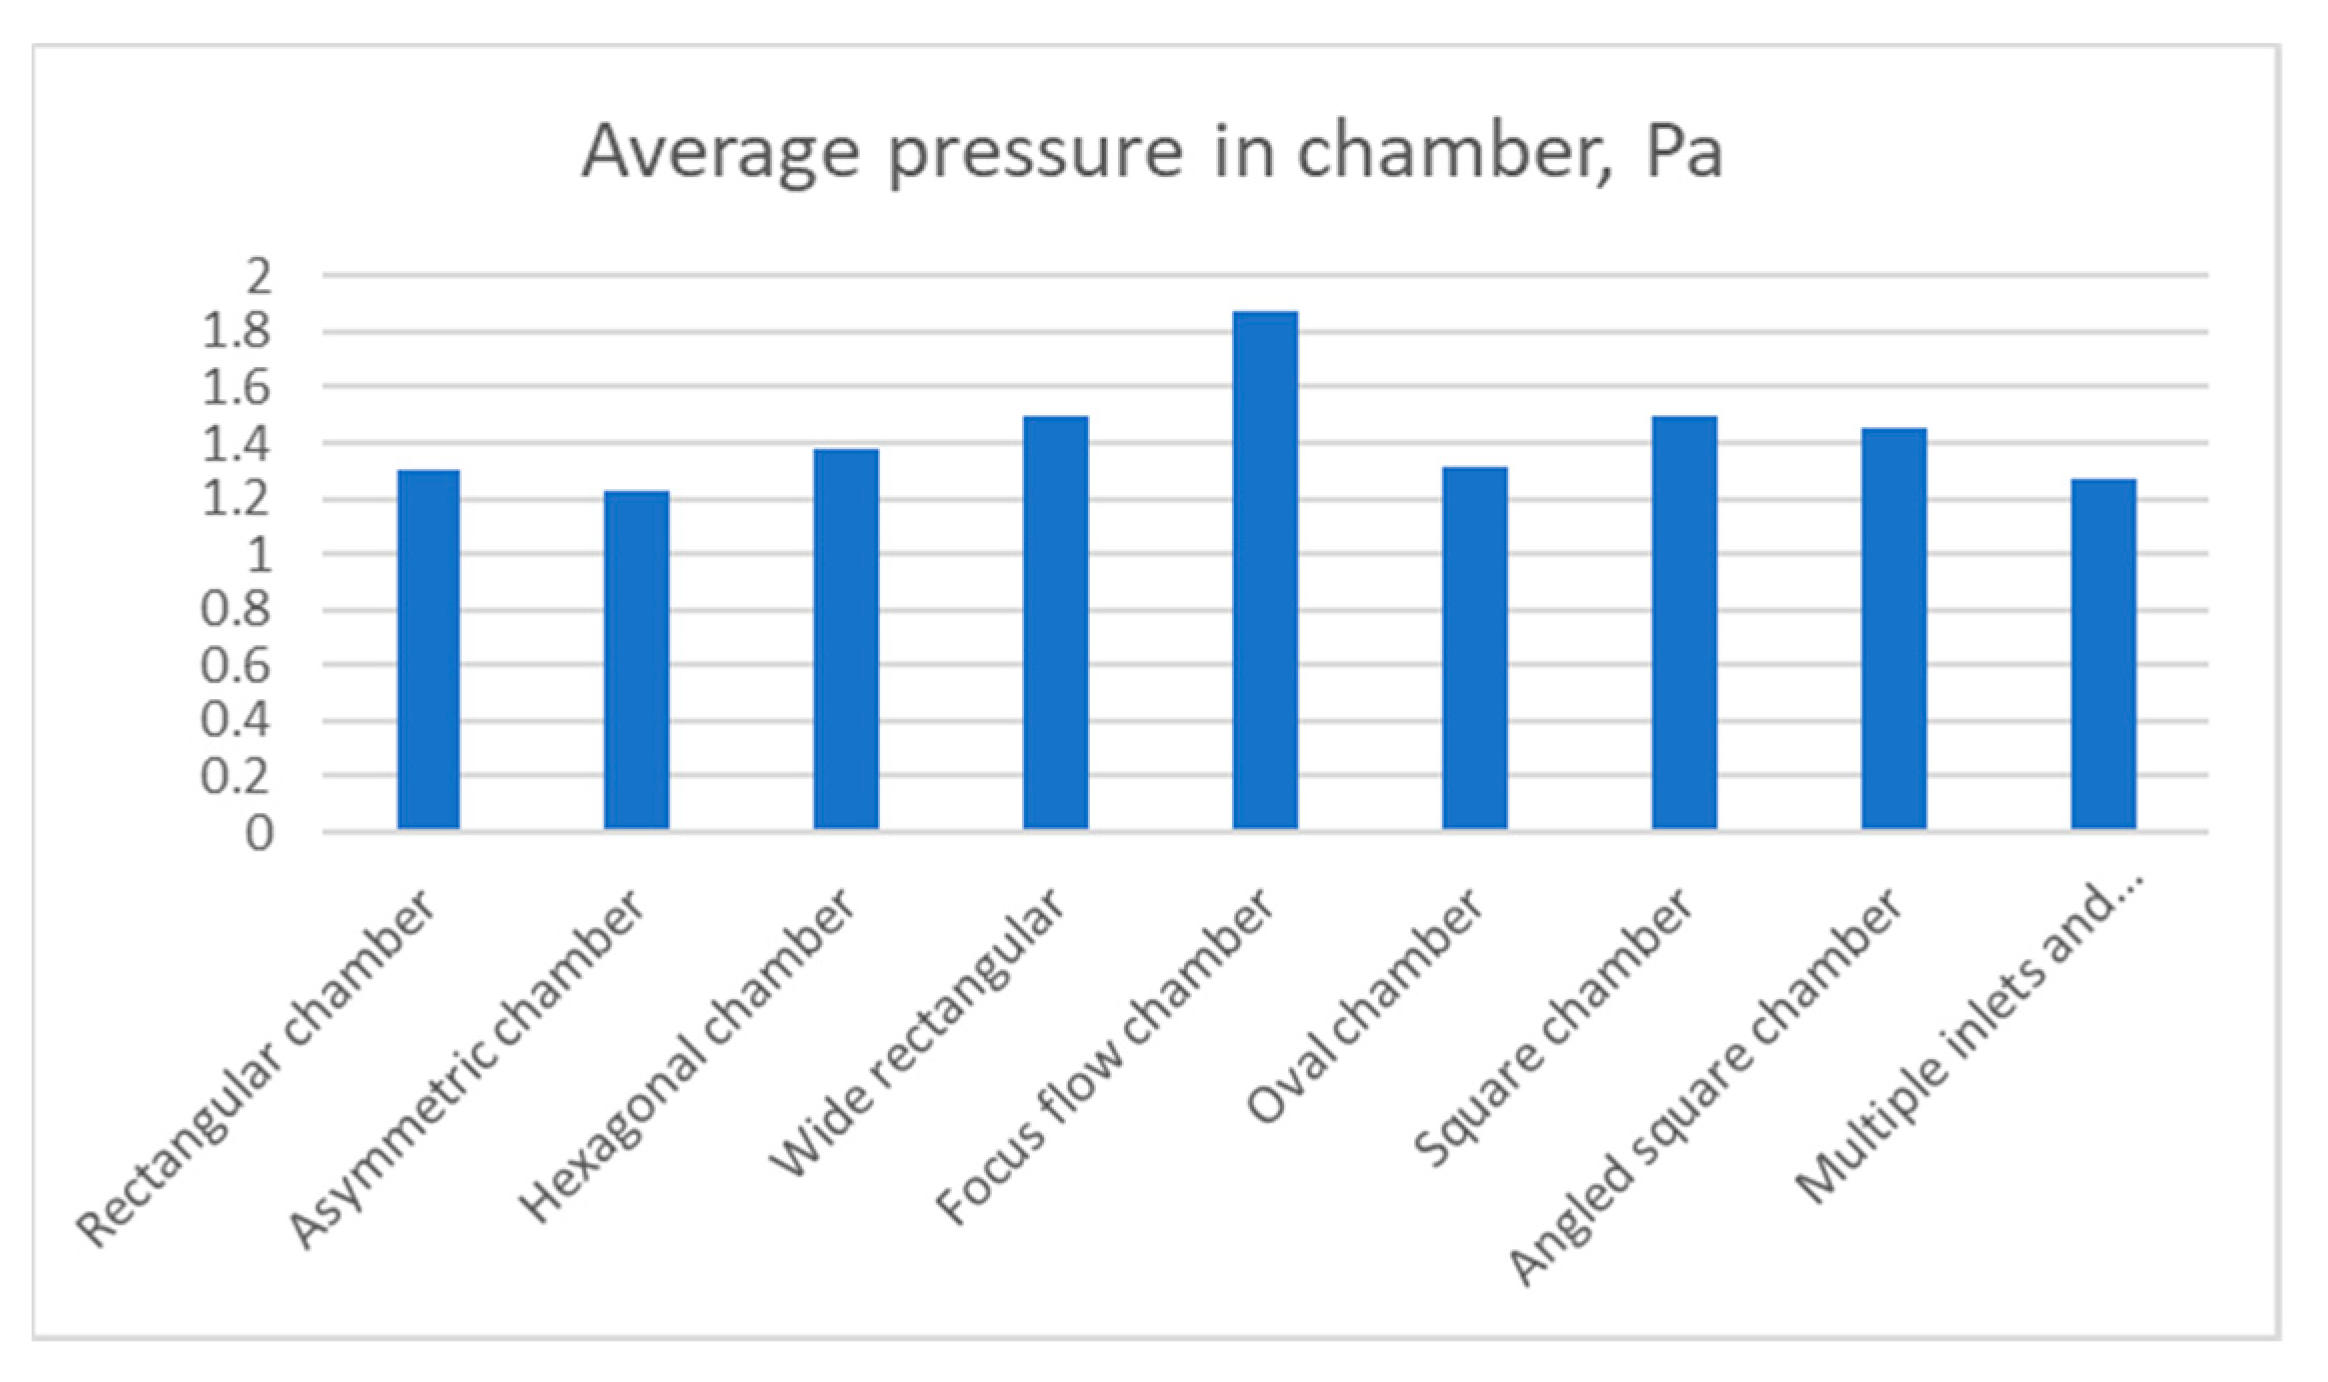
Due to the relatively large dimensions of the focus flow chamber design, an increased average pressure was present across all its chambers, Figure 11. On the other hand, other designs showed similar results. Approximately 1.5 Pa was registered in the square, angled square and wide chambers. Oval and rectangular chambers showed almost identical results of 1.3 Pa while the lowest result was attributed to asymmetric chamber. The hexagonal chamber had the lowest pressure from all other designs.
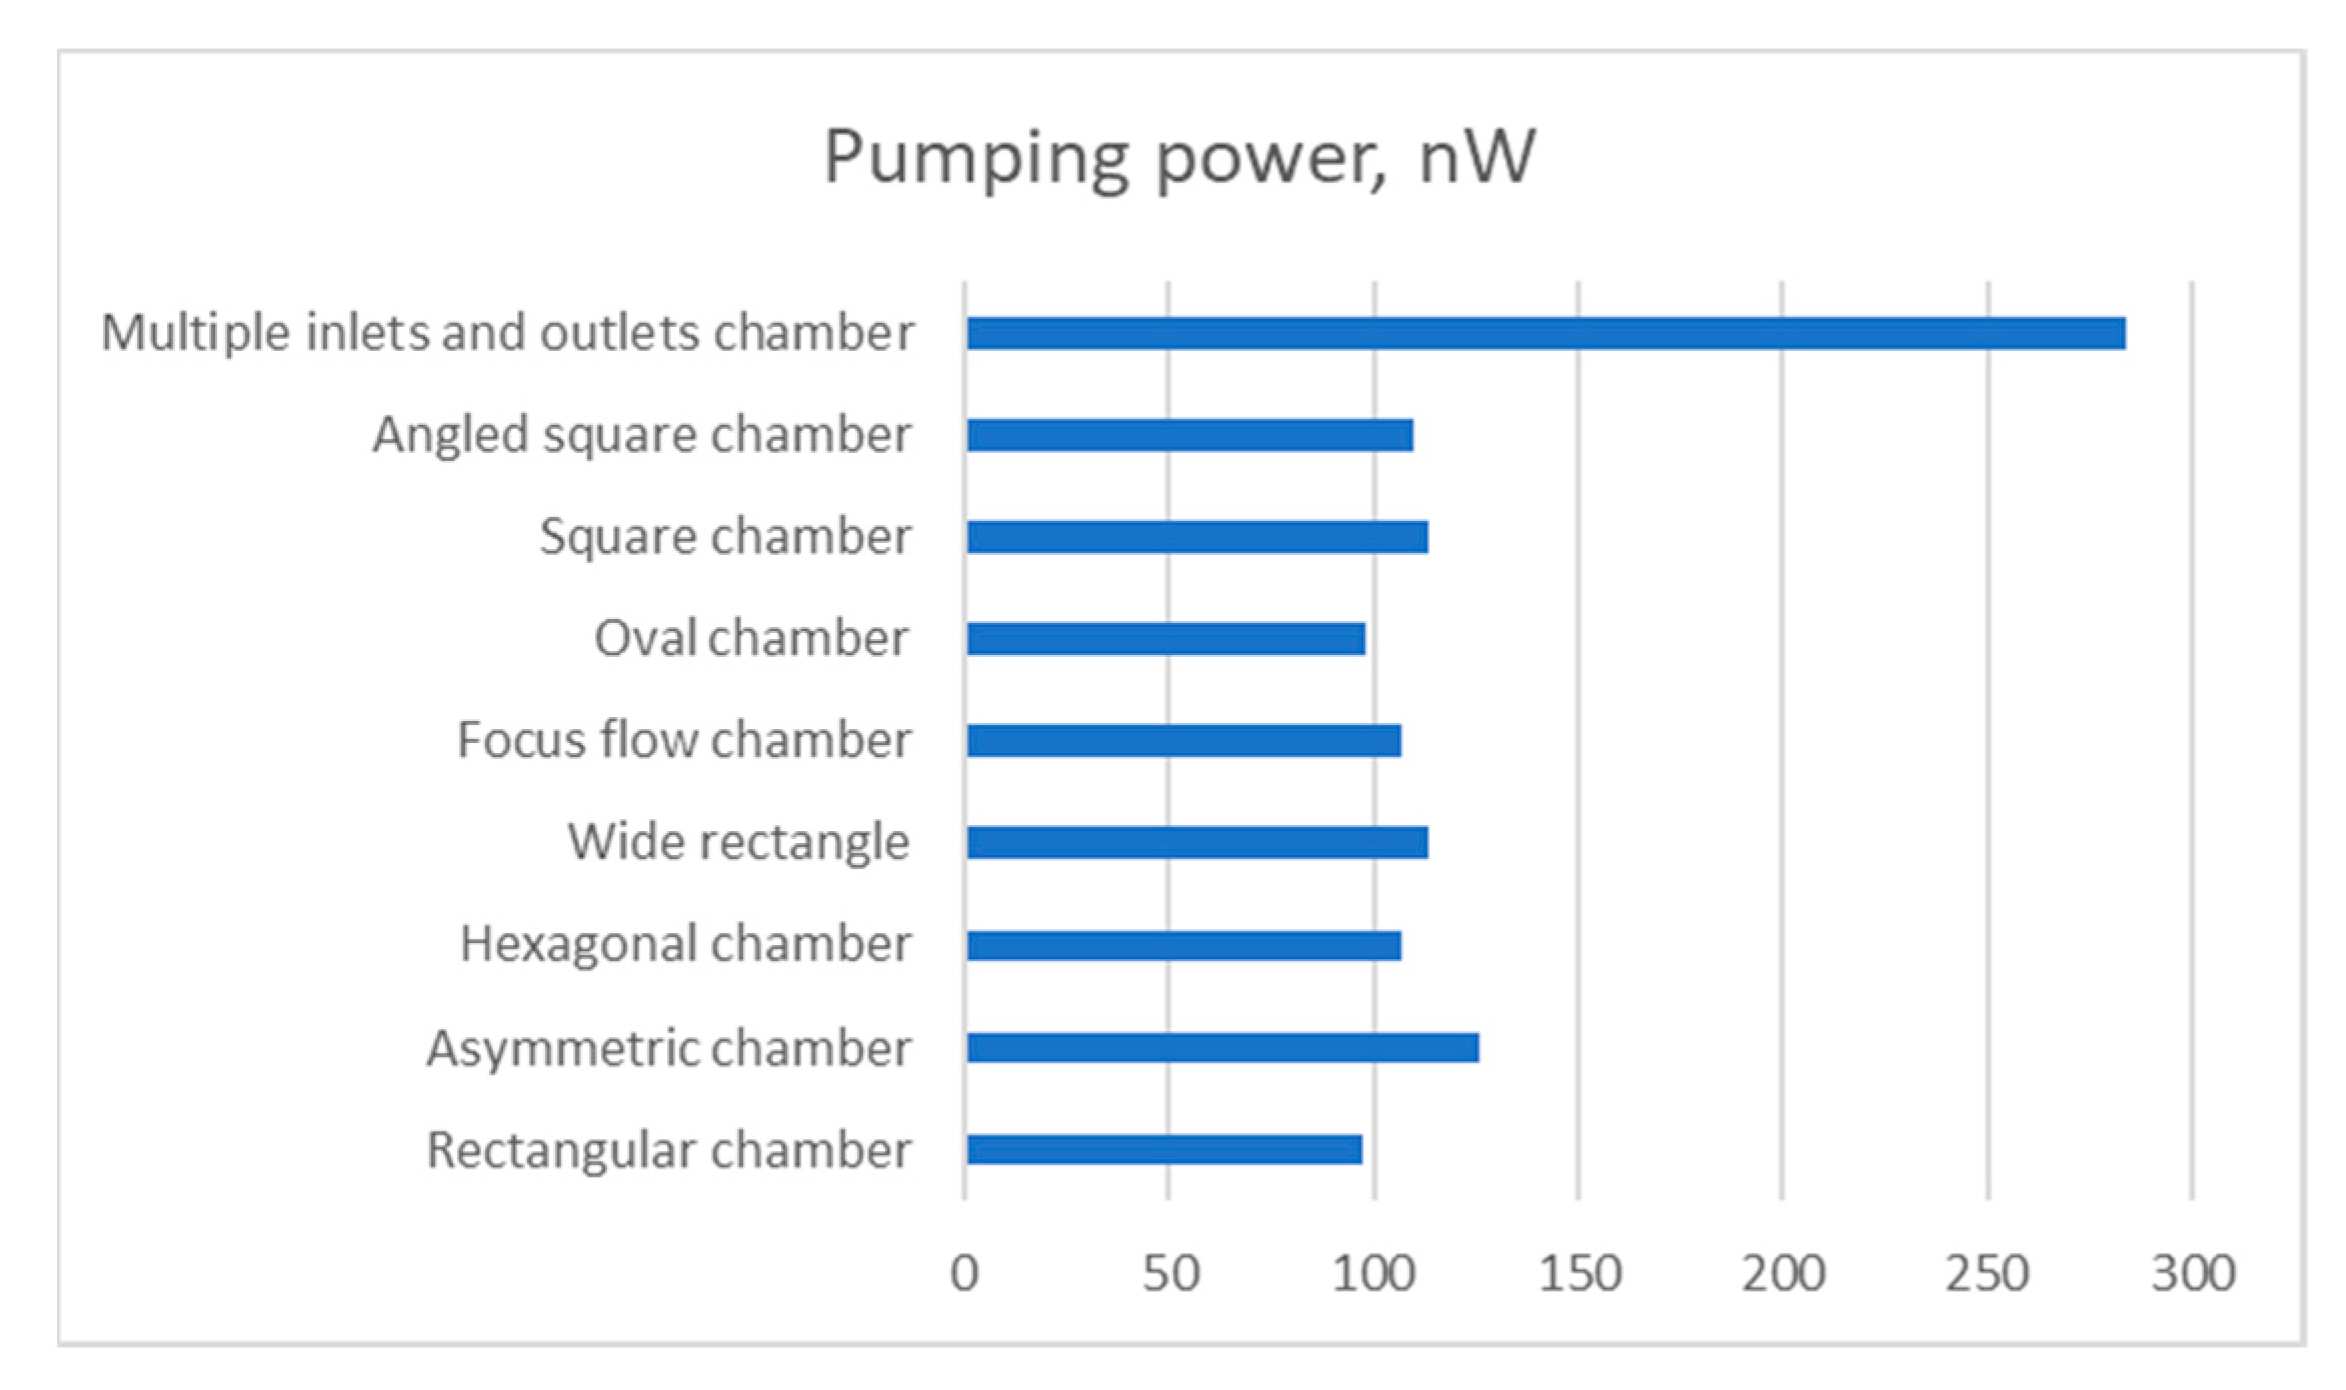
Lastly, the mechanical power that is required by a mechanical pump in order to sustain the specified flow rate, is compared in Figure 12. The power, N, is calculated by the following relation:
W = Δp × Q,
From the results, it can be observed that the multiple inlets and outlets design consumed much more power than other designs. In fact, it consumed slightly less power than the three rectangular chambers. The second power demanding design is the asymmetric chamber at 125.58 nW. Again, the wide, square and angled square chambers show similar characteristics. The rectangular chamber requires approximately 1 nW less power than the oval chamber. Surprisingly, the focus flow chamber design required the least amount of power (82.63 nW).
In order to determine the effect of inlet flow rate on the shear rate and the pressure drop, a parametric study was undertaken by changing the inlet flow velocity. The inlet velocity changed from 0.001 m/s to 0.01 m/s with a step of 0.001 m/s. As can be deduced from the results in Figure 13, both the shear rate and pressure drop changed linearly for all the studied designs as is anticipated in this type of laminar flows.
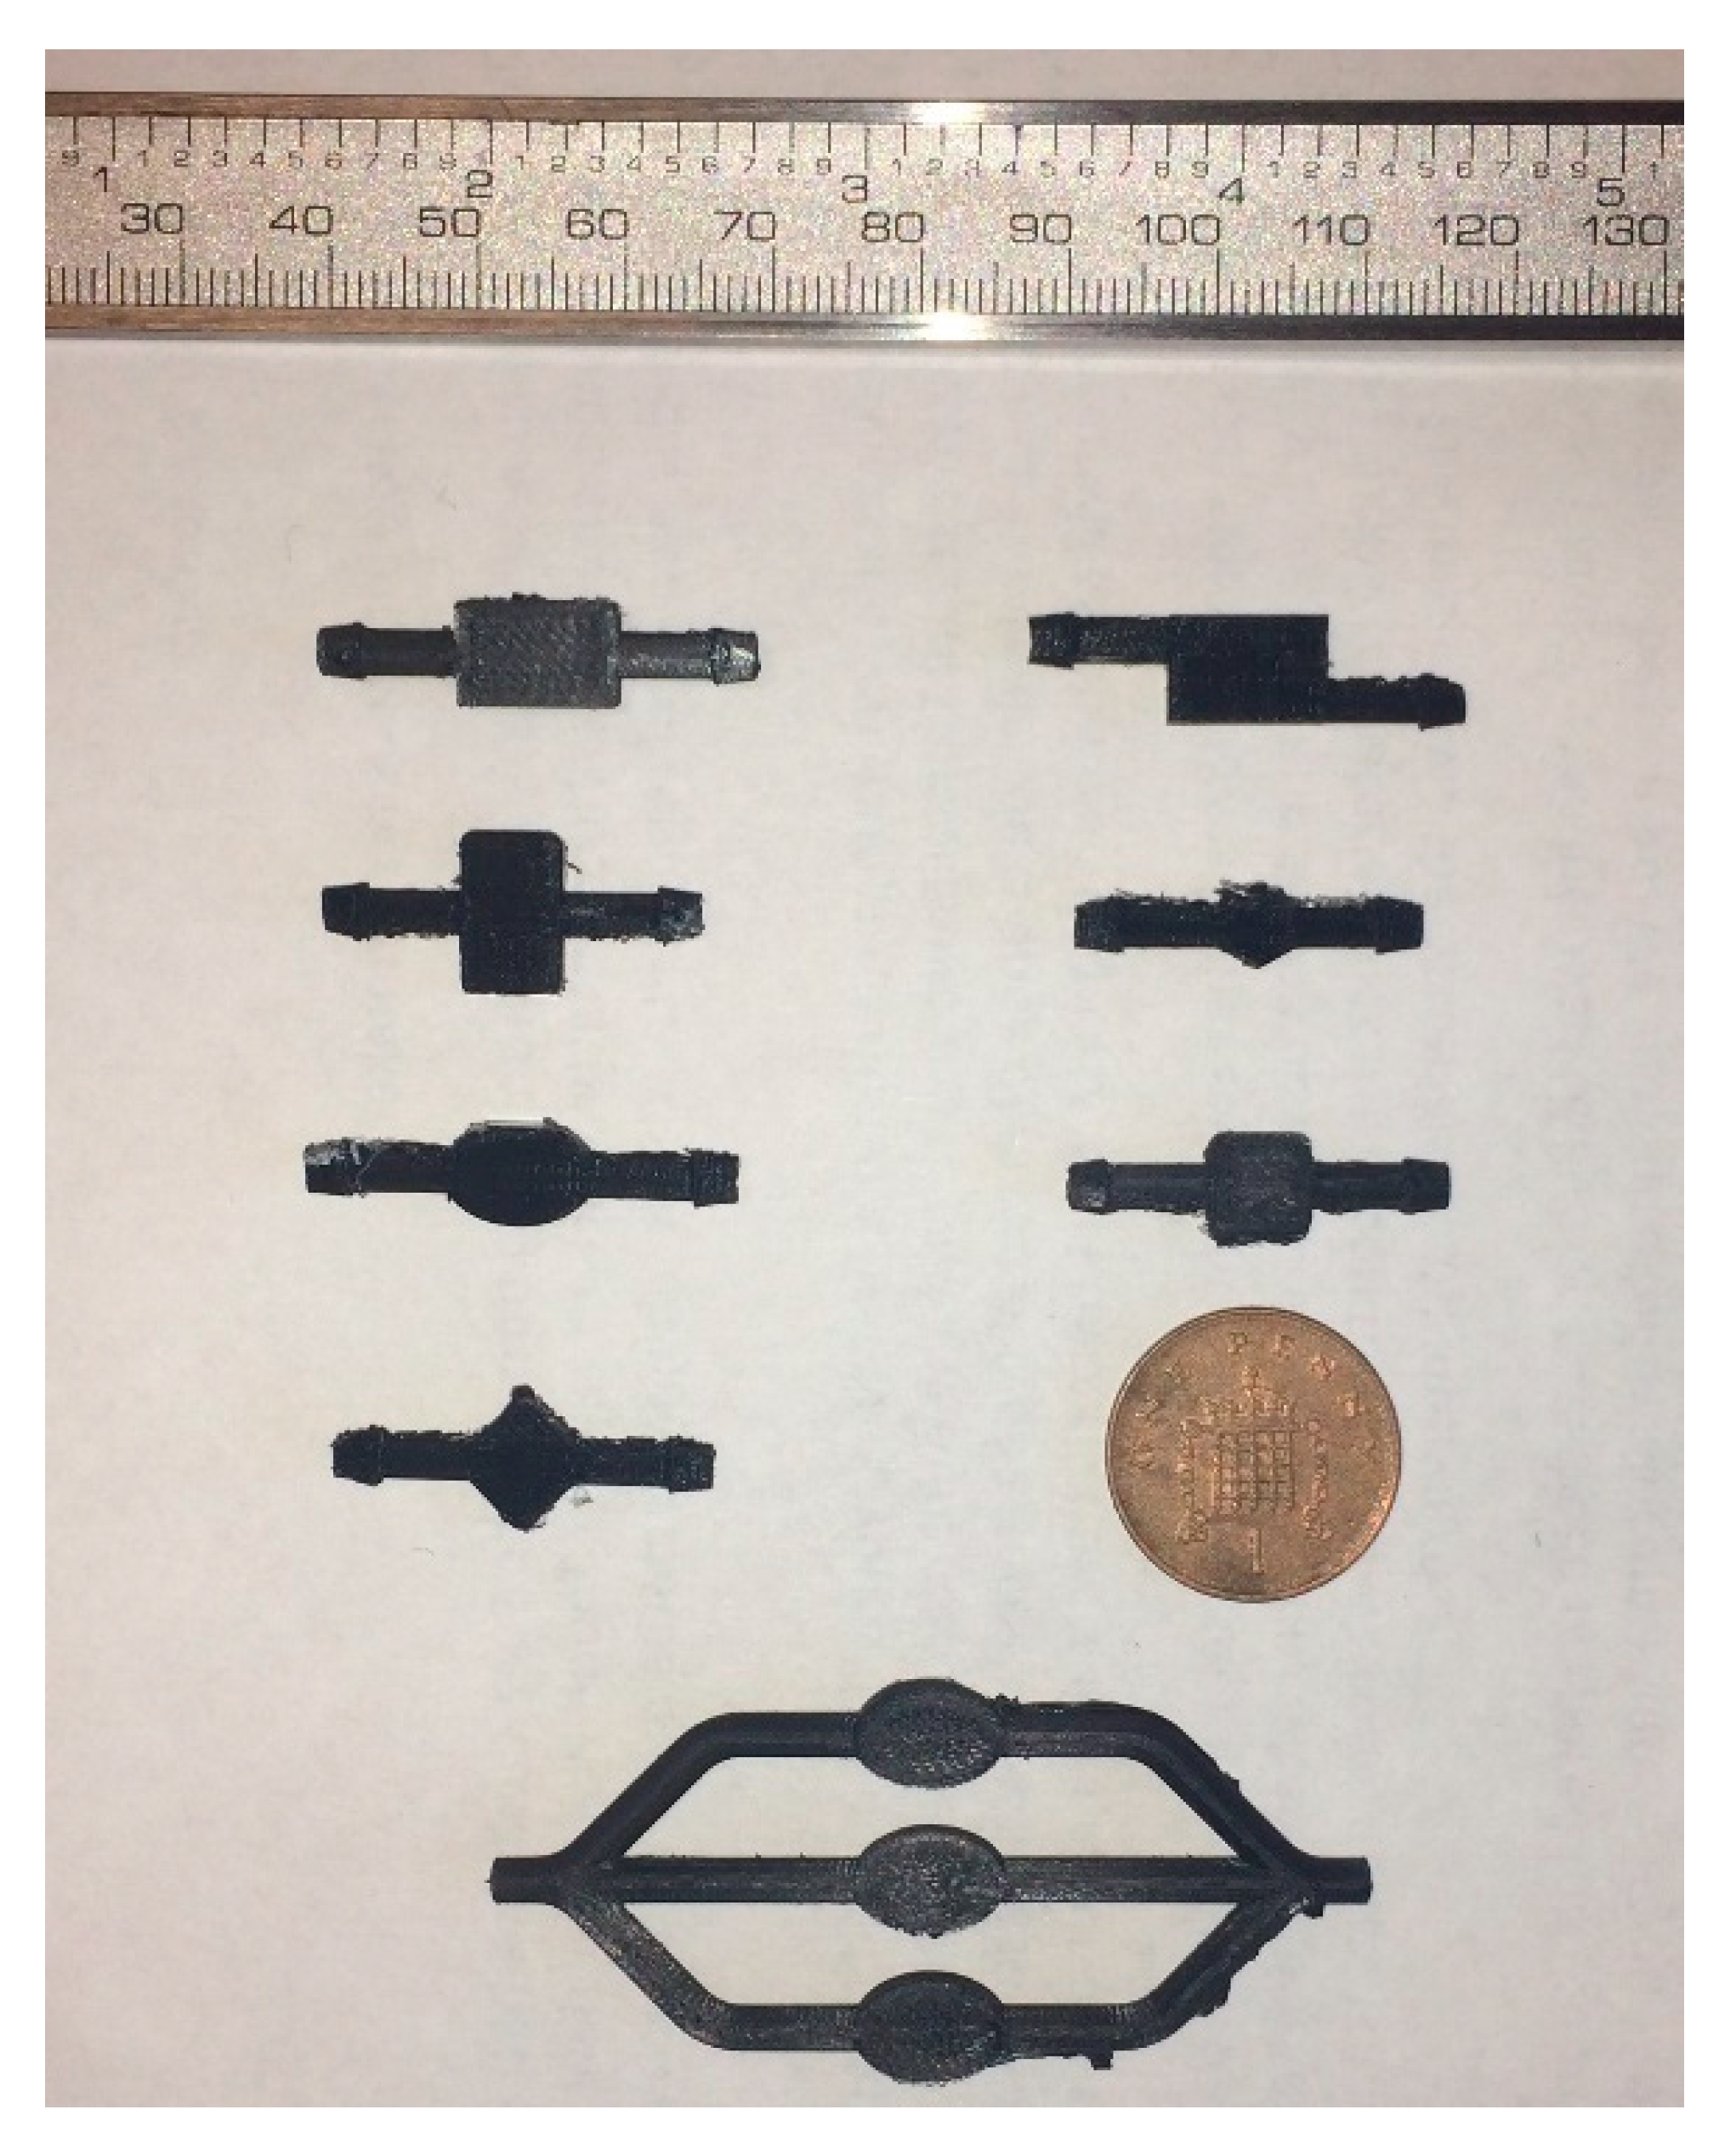
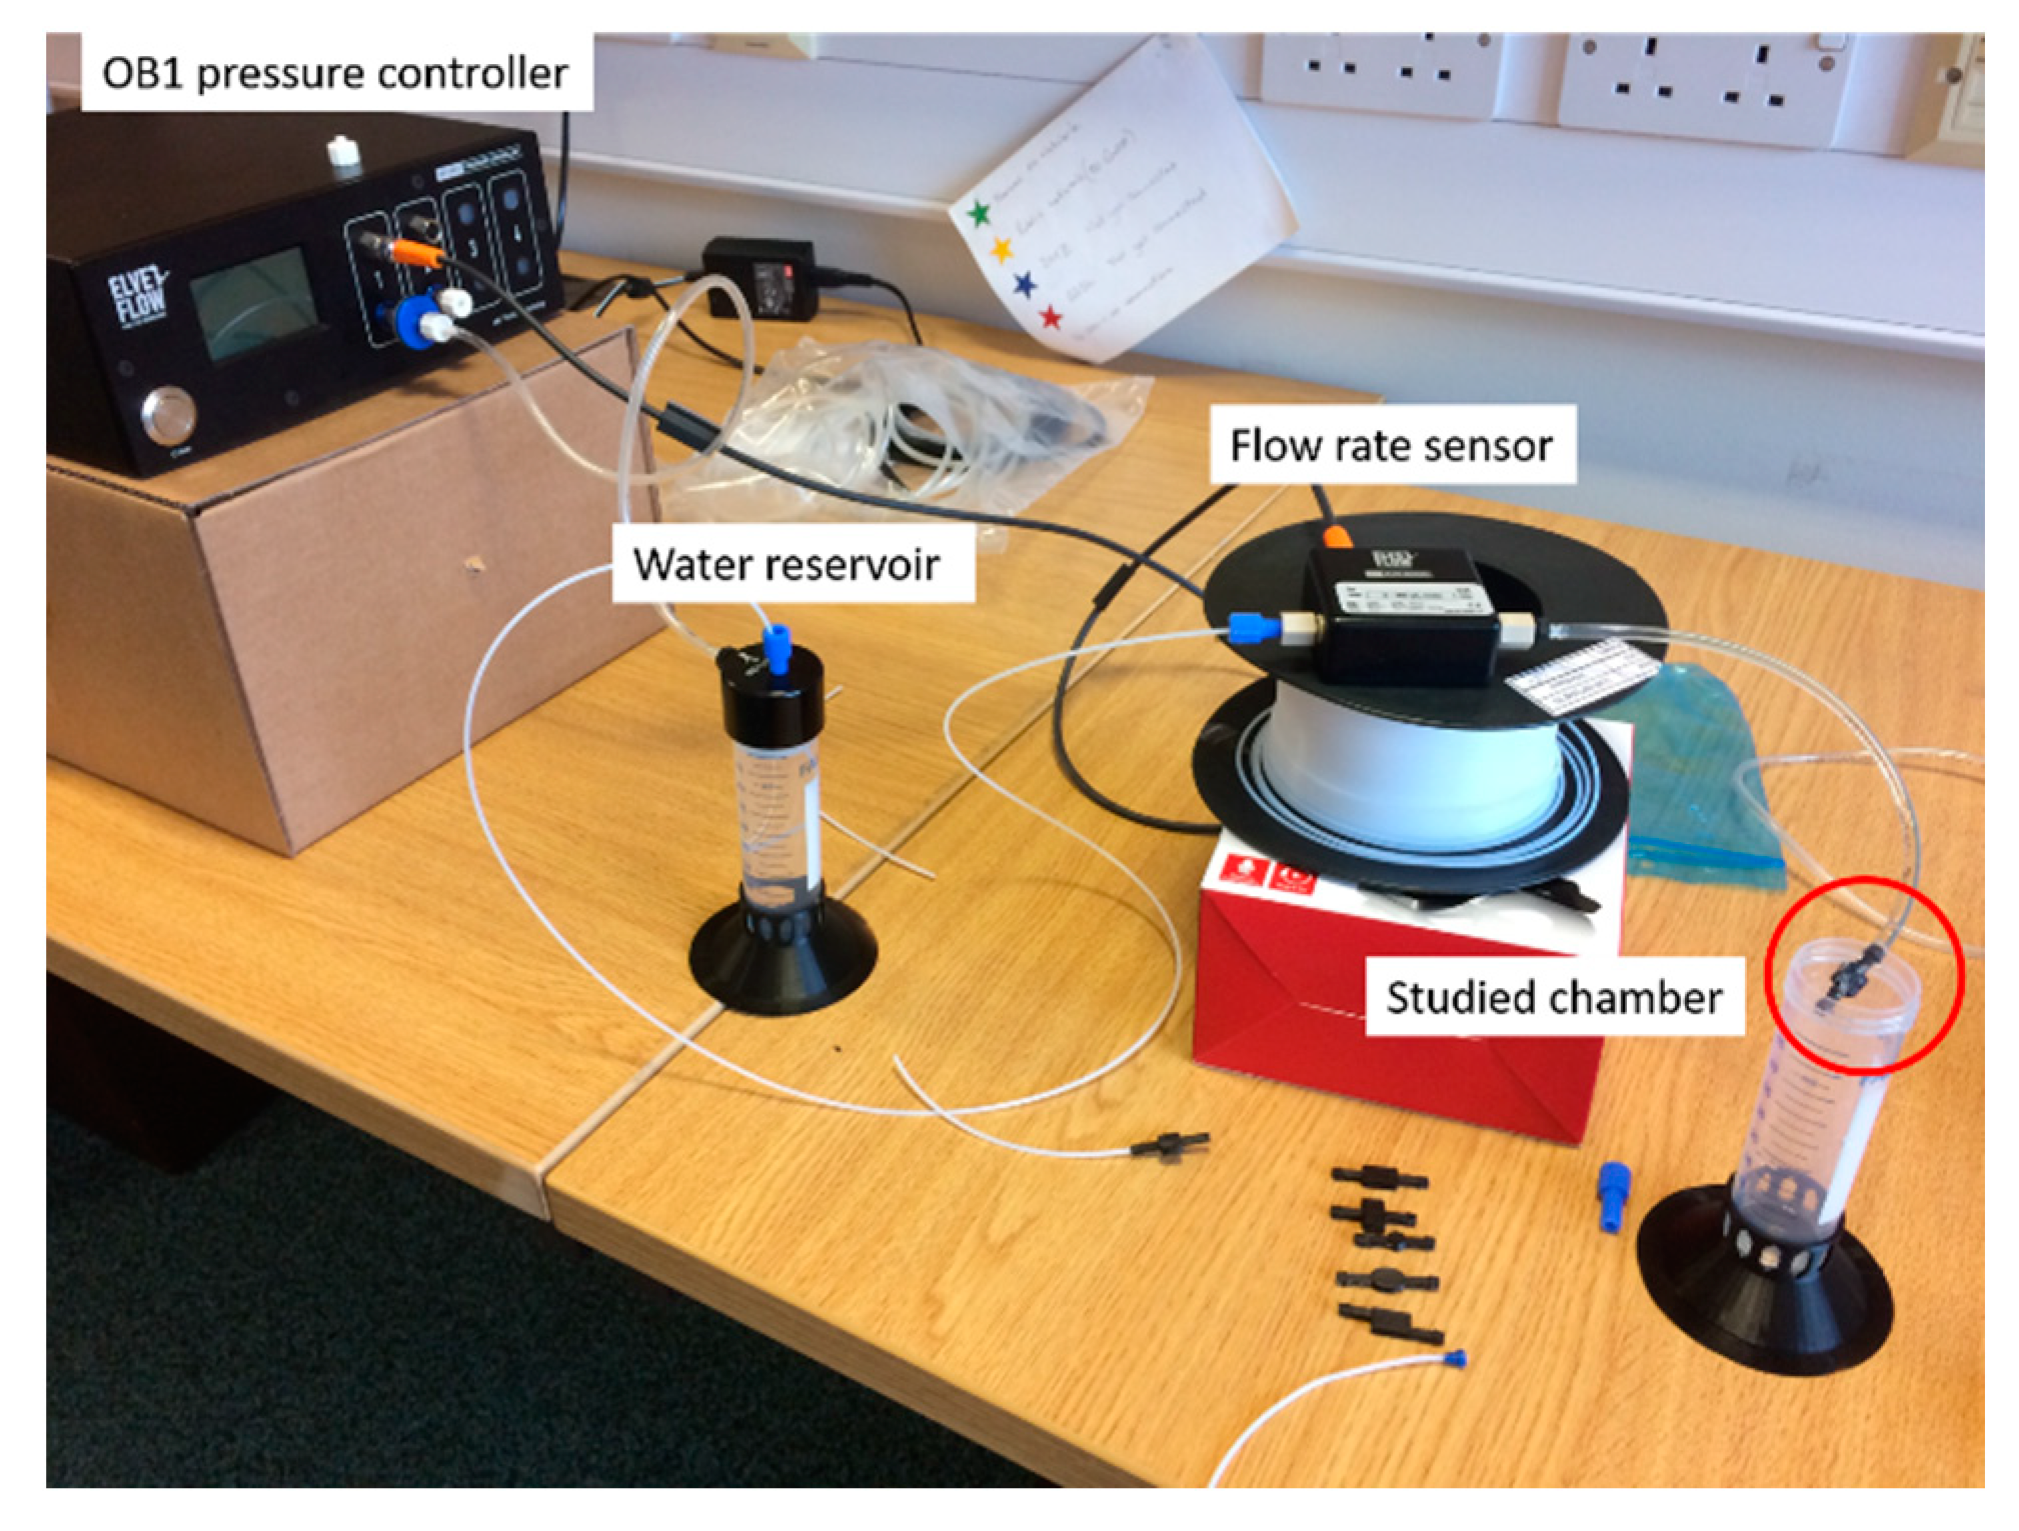
The chambers that were designed and simulated chambers were 3D printed using Ultimaker S5 and black PLA material, Figure 14. These designs are intended to be assessed in conjunction with an Elveflow Microfluidics kit which consists of an 8 bar Jun-Air air compressor, OB1 flow controller, water reservoir, flow-rate sensor and tubing, as shown in Figure 15.

4. Conclusions

In this work, seven chamber designs, a focus flow chamber design and a design with three inlets and outlets were investigated. The oval-shaped chamber possessed the best velocity profile, making it a good overall choice for the microfluidics. However, the commonly used rectangular shape had the lowest pumping power requirement of 97.31 nW and the lowest pressure of 1.2978 Pa. The hexagonal shape demonstrated the highest value of shear rate at 15.349 1/s out of all designs. The focus flow chamber design showed a good scaling of the results that were obtained by the oval chamber. Yet, the middle chamber had the most homogenous flow out of three. The best velocity profile was attributed to the three inlets design at the cost of 283.94 nW, which is almost three times more than the rectangular chamber.

Author Contributions

Conceptualization, methodology, A.T. and S.D.P.; computational investigation, data analysis, I.S. and A.T.; writing—original draft preparation, visualization, I.S. and S.D.P.; writing—review and editing, supervision, project administration, funding acquisition, S.D.P. All authors have read and agreed to the published version of the manuscript.

Funding

This research received no external funding.

Data Availability Statement

Not applicable.

Conflicts of Interest

The authors declare no conflict of interest.

References

  1. Teles, F.R.R.; Fonseca, L.P. Trends in DNA biosensors. Talanta 2008, 77, 606–623. [Google Scholar] [CrossRef]
  2. Luka, G.; Ahmadi, A.; Najjaran, H.; Alocilja, E.; DeRosa, M.; Wolthers, K.; Malki, A.; Aziz, H.; Althani, A.; Hoorfar, M. Microfluidics Integrated Biosensors: A Leading Technology towards Lab-on-a-Chip and Sensing Applications. Sensors 2015, 15, 30011–30031. [Google Scholar] [CrossRef] [PubMed] [Green Version]
  3. Gao, J.; Sin, M.L.; Liu, T.; Gau, V.; Liao, J.C.; Wong, P.K. Hybrid electrokinetic manipulation in high-conductivity media. Lab Chip 2011, 11, 1770–1775. [Google Scholar] [CrossRef] [PubMed] [Green Version]
  4. Rackus, D.; Shamsi, M.; Wheeler, A. Electrochemistry, biosensors and microfluidics: A convergence of fields. Chem. Soc. Rev. 2015, 44, 5320–5340. [Google Scholar] [CrossRef] [PubMed]
  5. Khan, N.I.; Song, E. Lab-on-a-Chip Systems for Aptamer-Based Biosensing. Micromachines 2020, 11, 220. [Google Scholar] [CrossRef] [PubMed] [Green Version]
  6. Acharya, A.; Packirisamy, M. Microchambers flow simulation for immunoassay-based biosensing applications. Photon. North 2007, 6796, 679628. [Google Scholar]
  7. Islamov, M.; Sypabekova, M.; Kanayeva, D.; Rojas-Solórzano, L. CFD Modeling of Chamber Filling in a Micro-Biosensor for Protein Detection. Biosensors 2017, 7, 45. [Google Scholar] [CrossRef] [PubMed] [Green Version]
  8. Tan, S.J.; Lao, I.K.; Ji, H.M.; Agarwal, A.; Balasubramanian, N.; Kwong, D.L. Microfluidic design for bio-sample delivery to silicon nanowire biosensor—A simulation study. J. Phys. Conf. Ser. 2006, 34, 626. [Google Scholar] [CrossRef]
Figure 1. Studied designs. (a) Rectangular chamber; (b) Asymmetric chamber; (c) Wide rectangular chamber; (d) Hexagonal chamber; (e) Oval chamber; (f) Square chamber; (g) Angled square chamber; (h) Multiple inlets and outlets chamber; (i) Focus flow chamber.
Engproc 16 00016 g001
Figure 2. The physical problem.
Engproc 16 00016 g002
Figure 3. Comparison study results: (a) Relationship between the values of analytical pressure drop and flow rate against simulated values; (b) Comparison of analytical velocity profiles against simulated values.
Engproc 16 00016 g003
Figure 4. Generated meshes. (a) Rectangular chamber; (b) Asymmetric chamber; (c) Wide rectangular chamber; (d) Hexagonal chamber; (e) Oval chamber; (f) Square chamber; (g) Angled square chamber; (h) Multiple inlets and outlets chamber; (i) Focus flow chamber.
Engproc 16 00016 g004
Figure 5. Velocity magnitude: (a) Rectangular chamber; (b) Asymmetric chamber; (c) Wide rectangular chamber; (d) Hexagonal chamber; (e) Oval chamber; (f) Square chamber; (g) Angled square chamber; (h) Multiple inlets and outlets chamber; (i) Focus flow chamber.
Engproc 16 00016 g005
Figure 6. Streamlines: (a) Rectangular chamber; (b) Asymmetric chamber; (c) Wide rectangular chamber; (d) Hexagonal chamber; (e) Oval chamber; (f) Square chamber; (g) Angled square chamber; (h) Multiple inlets and outlets chamber; (i) Focus flow chamber.
Engproc 16 00016 g006
Figure 7. Velocity vectors: (a) Rectangular chamber; (b) Asymmetric chamber; (c) Wide rectangular chamber; (d) Hexagonal chamber; (e) Oval chamber; (f) Square chamber; (g) Angled square chamber; (h) Multiple inlets and outlets chamber; (i) Focus flow chamber.
Engproc 16 00016 g007
Figure 8. Pressure distribution: (a) Rectangular chamber; (b) Asymmetric chamber; (c) Wide rectangular chamber; (d) Hexagonal chamber; (e) Oval chamber; (f) Square chamber; (g) Angled square chamber; (h) Multiple inlets and outlets chamber; (i) Focus flow chamber.
Engproc 16 00016 g008
Figure 9. Shear rate: (a) Rectangular chamber; (b) Asymmetric chamber; (c) Wide rectangular chamber; (d) Hexagonal chamber; (e) Oval chamber; (f) Square chamber; (g) Angled square chamber; (h) Multiple inlets and outlets chamber; (i) Focus flow chamber.
Engproc 16 00016 g009
Figure 10. Average shear rate across chambers.
Engproc 16 00016 g010
Figure 11. Average pressure in chamber.
Engproc 16 00016 g011
Figure 12. Mechanical pumping power.
Engproc 16 00016 g012
Figure 13. Comparative assessment of performance: (a) Relationship between the flow velocity and average shear rate in chamber; (b) Relationship between the flow velocity and the pressure drop.
Engproc 16 00016 g013
Figure 14. 3D printed chambers.
Engproc 16 00016 g014
Figure 15. Experimental setup.
Engproc 16 00016 g015
Table 1. Simulation results.
Design VariantShear Rate, 1/sAverage Pressure in Chamber, PaPumping Power, nW
Rectangular chamber7.04231.297897.31
Asymmetric chamber6.88071.2312125.58
Hexagonal chamber15.3491.3771106.67
Wide rectangle5.00431.5001113.12
Focus flow chamber2.08221.875107.12
Oval chamber7.49031.31598.283
Square chamber8.02351.4972113.45
Angled square chamber8.69251.4536110.13
Focus flow chamber8.021.2672283.94
Publisher’s Note: MDPI stays neutral with regard to jurisdictional claims in published maps and institutional affiliations.

