1. Introduction
In the field of wireless communications and their applications, estimating directions of arrival (DoA) is a very necessary task of paramount interest. For RADARs, SONARs, radio signal processing and smart antenna arrays, the beam-forming reflects the antenna performance; however, beam-forming cannot be achieved without estimating directions of arrival which makes it easier to focus the radiation in the desired direction while minimizing it in other directions [
1,
2]. In addition, new telecommunications standards ensure a good quality of service resulting from the extreme precision of the estimated directions of arrival.
Direction of arrival algorithms are used, in general, to estimate the number of incident plane waves on the antenna array and their angles of incidence. Several DOA estimation approaches have been designed, and their performances have been investigated thoroughly over the years; in addition, intensive studies in the area of DOA estimation were carried out to pinpoint the most convenient algorithm for the application of interest [
3,
4]. The most popular are: the Bartlett method [
5], which is also known as the method of averaged periodograms; the Capon method [
6], which determines an angular spectrum for each direction by minimizing the noise and the interference from other directions; the Maximum entropy method [
7], which is based on the extrapolation of the covariance matrix; the Multiple Signal Classification (MUSIC) method [
8], which determines the signal and noise subspaces and then searches the spectrum to find DOAs; the Minimum Norm technique [
3], which is generally considered to be a high-resolution method that assumes a uniform linear antenna array geometry; and Estimation of Signal Parameters via Rotational Invariance Techniques (ESPRIT) [
9] that determines the signal subspace from which the DOAs are determined in closed form.
Generally, the resolution of DOA algorithms that use a covariance matrix depends on the number of samples and the SNR level. Furthermore, despite having stepped in to face the limitations of the Bartlett method, such as to increase the resolving power of two sources spaced closer than a beamwidth [
10], the traditional Capon method remains sensitive to the problem of limited samples and low SNR because it is based upon whole covariance matrix inversion. The presence of source correlation degrades the performance of Capon as compared to the MUSIC algorithm, which uses only an orthogonal projection to the signal subspace of the covariance matrix for estimating the DOA of incident signals.
The paper is organized in the following way. In the next section, we give the signal model and briefly describe the conventional Capon approach. The proposed algorithm is introduced in
Section 3. The simulation results and analysis are given in
Section 4. The last section deals with the conclusion.
2. Problem Formulation
This section firstly describes the general signal model that is considered for the DOA estimation problem and secondly, reviews the conventional DOA Capon algorithm.
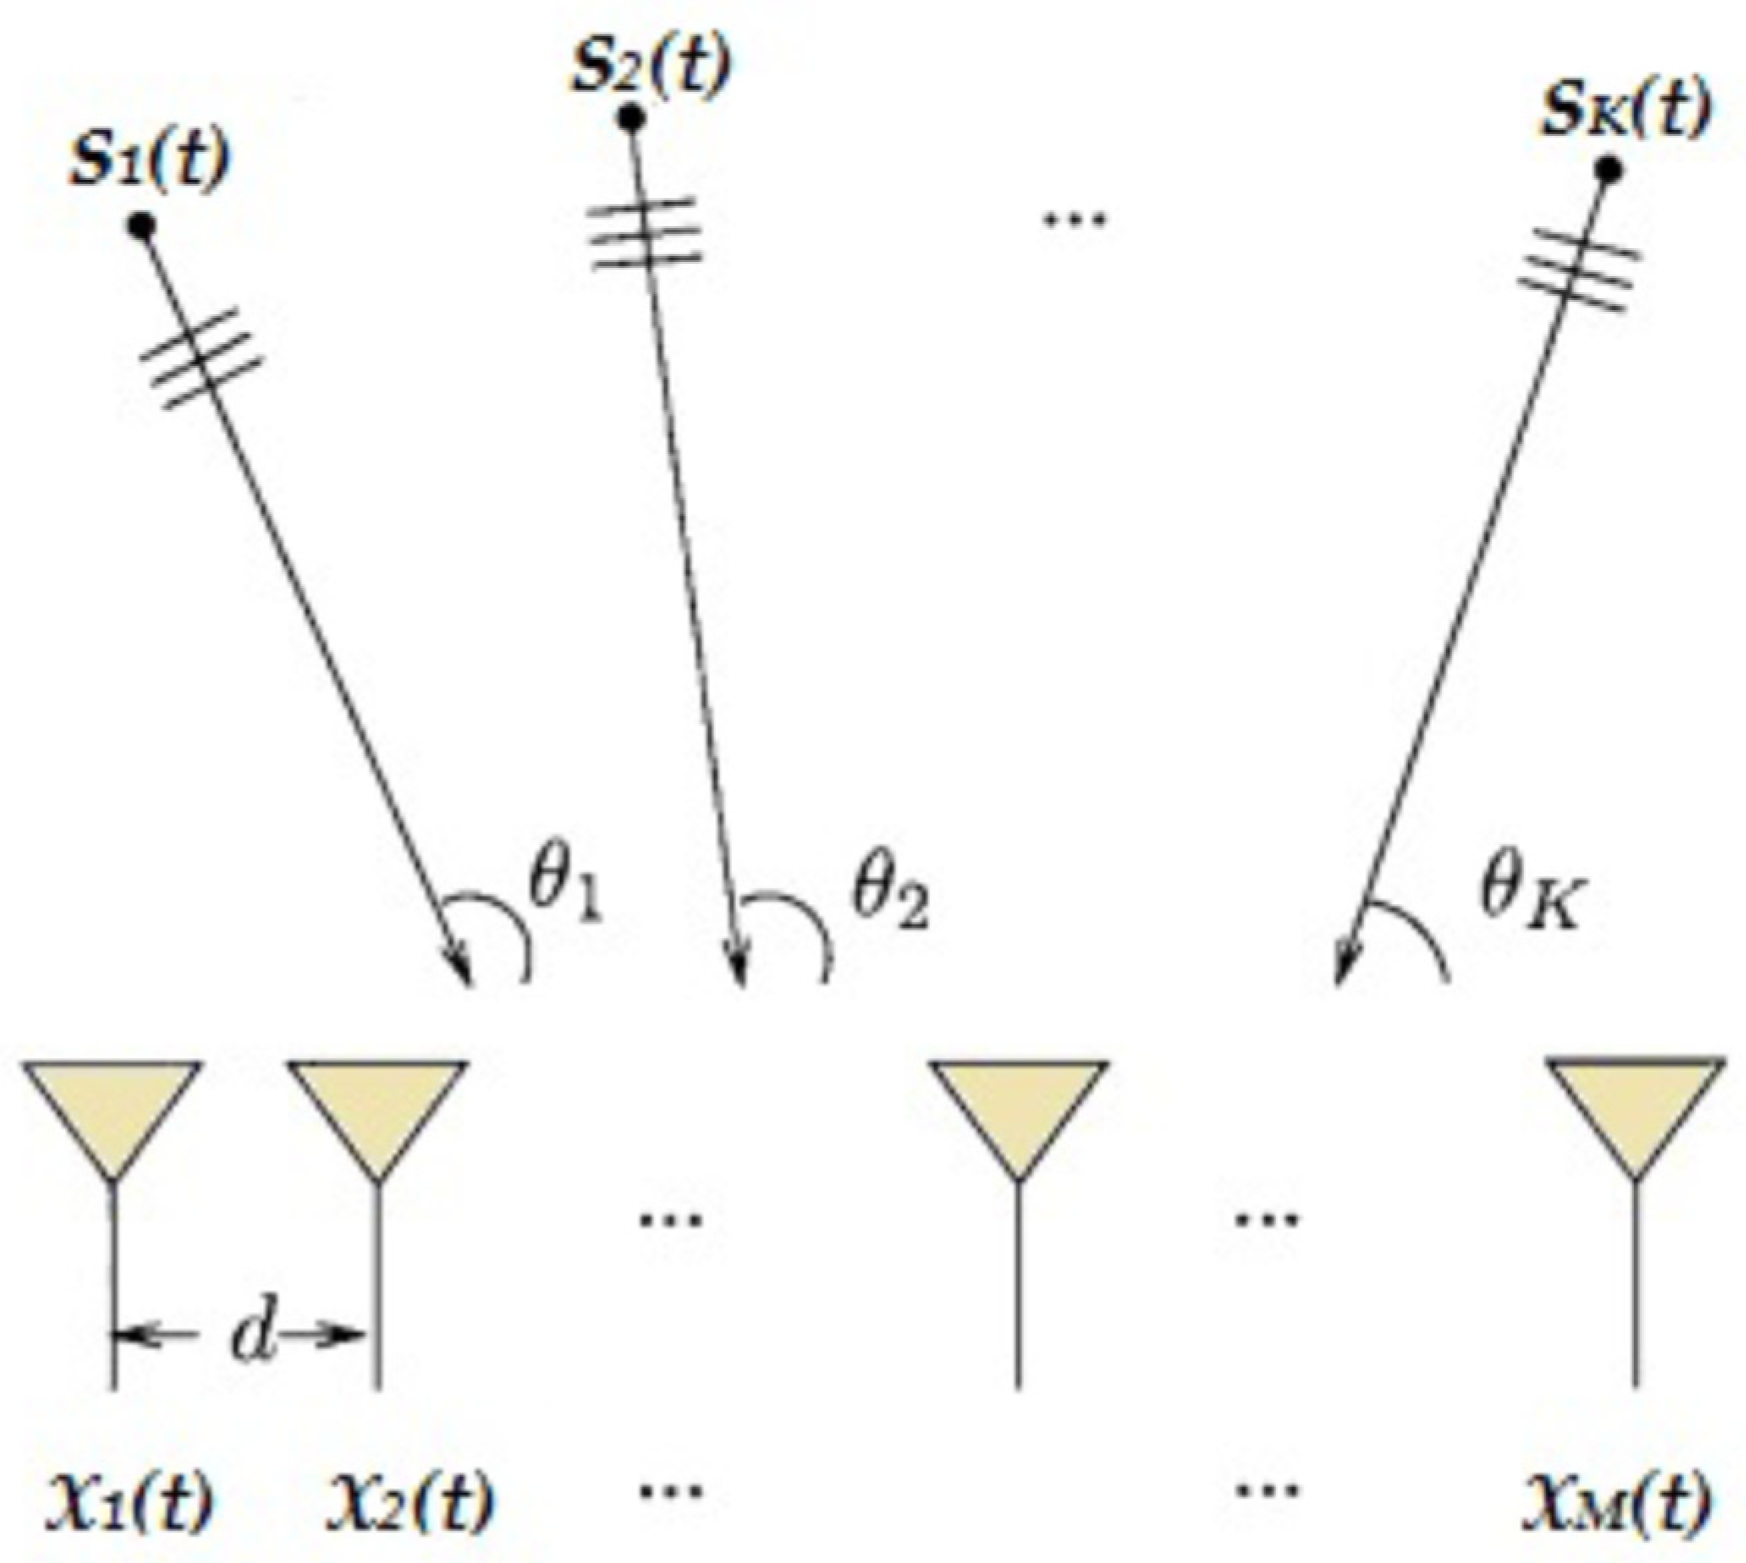
For clarity sake, we consider a uniform linear geometry of the antenna array which is composed of
isotropic elements. The inter-element distance is taken to be half the wavelength.
narrowband signals
,
, impinge on the antenna array from different directions
, as depicted in
Figure 1. We also assume that the observed output is based on
snapshots.
The array output can be expressed according to the received signal vector as:
Under matrix notation, Equation (1) can be re-expressed as:
where
is a
received array matrix,
is a
transmitted signal matrix,
is a
Gaussian white noise matrix with mean zero and covariance
, and
is a
steering matrix containing the
array response vectors
that can be expressed as:
where
is the wavelength of the signal,
is the distance between array elements and
is the transpose operator.
The
array covariance matrix
of the received signal can be written as [
1]:
where
is the
signal covariance matrix and
is the
noise covariance matrix.
In practice, the covariance matrix
is not known. Furthermore, it can be replaced by its sample estimated matrix
, which usually takes
number of snapshots in the form [
4]:
The Capon spectral-based method was originally developed for frequency-wave number estimation [
6]. Then, for signal DOA estimation, this method was employed as a spatial filter that minimizes incoming power in all directions, with the constraint that its response is equal to unity gain in the direction of arrival under consideration. That is, the constraint imposed on this estimator is represented as:
By exploiting the Lagrange optimization technique, when the number of snapshots is finite, the solution to (6) gives us the following Capon’s weight vector:
Hence, the Capon’s output is given by the following spectral function:
The directions of arrival can be determined through the highest peak location of the previous function. In other words, the estimated DOAs of all sources can be found as:
Therefore, to estimate DOA using the traditional Capon algorithm, we follow four fundamental steps which are: the estimation of the covariance matrix
, the calculation of its inversion
, the determination of the spectrum function and the localization of the highest peaks. The complexities of these steps are
,
,
and
, respectively. Thus, the overall Capon complexity is:
where
is the number of antennas,
is the number of sources,
the number of samples and
is the number of scan steps of theta.
3. New Proposed Algorithm
This section aims to propose a new scheme that can enhance the Capon algorithm performance in terms of DOA accuracy, and at the same time, reduce the computational complexity. In fact, the important contribution of the new method only consists of the inverse of the right upper triangle matrix instead of the inverse of the entire autocorrelation matrix.
The matrix used in the calculation of our improved Capon version is issued from the known
factorization. This last can be applied on a matrix
with linearly independent columns such as the estimated autocorrelation matrix
. Thus, the factored matrix takes the following form:
Here, we have a Q-factor that contains orthonormal -vectors and an -factor which is upper triangular with nonzero diagonal elements.
The procedure which is followed for the new DOA method can be summarized by the following steps:
Estimate the autocovariance matrix using Equation (5).
Decompose the estimated autocovariance matrix using factorization.
Compute the inverse of the right upper triangle matrix .
Construct the improved spectral function as follows:
Find the highest peaks and their correspondent DOAs.
The complexity of this proposed algorithm can be deduced from the complete complexity of its above steps. These five steps require , , , and , respectively. Thus, the total new Capon complexity is: . Consequently, the proposed new Capon method has a lower computational cost than the standard Capon method.
4. Simulation Results
In this section, simulation results are presented to show the performance of the proposed DOA method and to compare it to its original version, which is the conventional Capon technique. To this end, we use a linear uniform array with the parameters indicated in the table below.
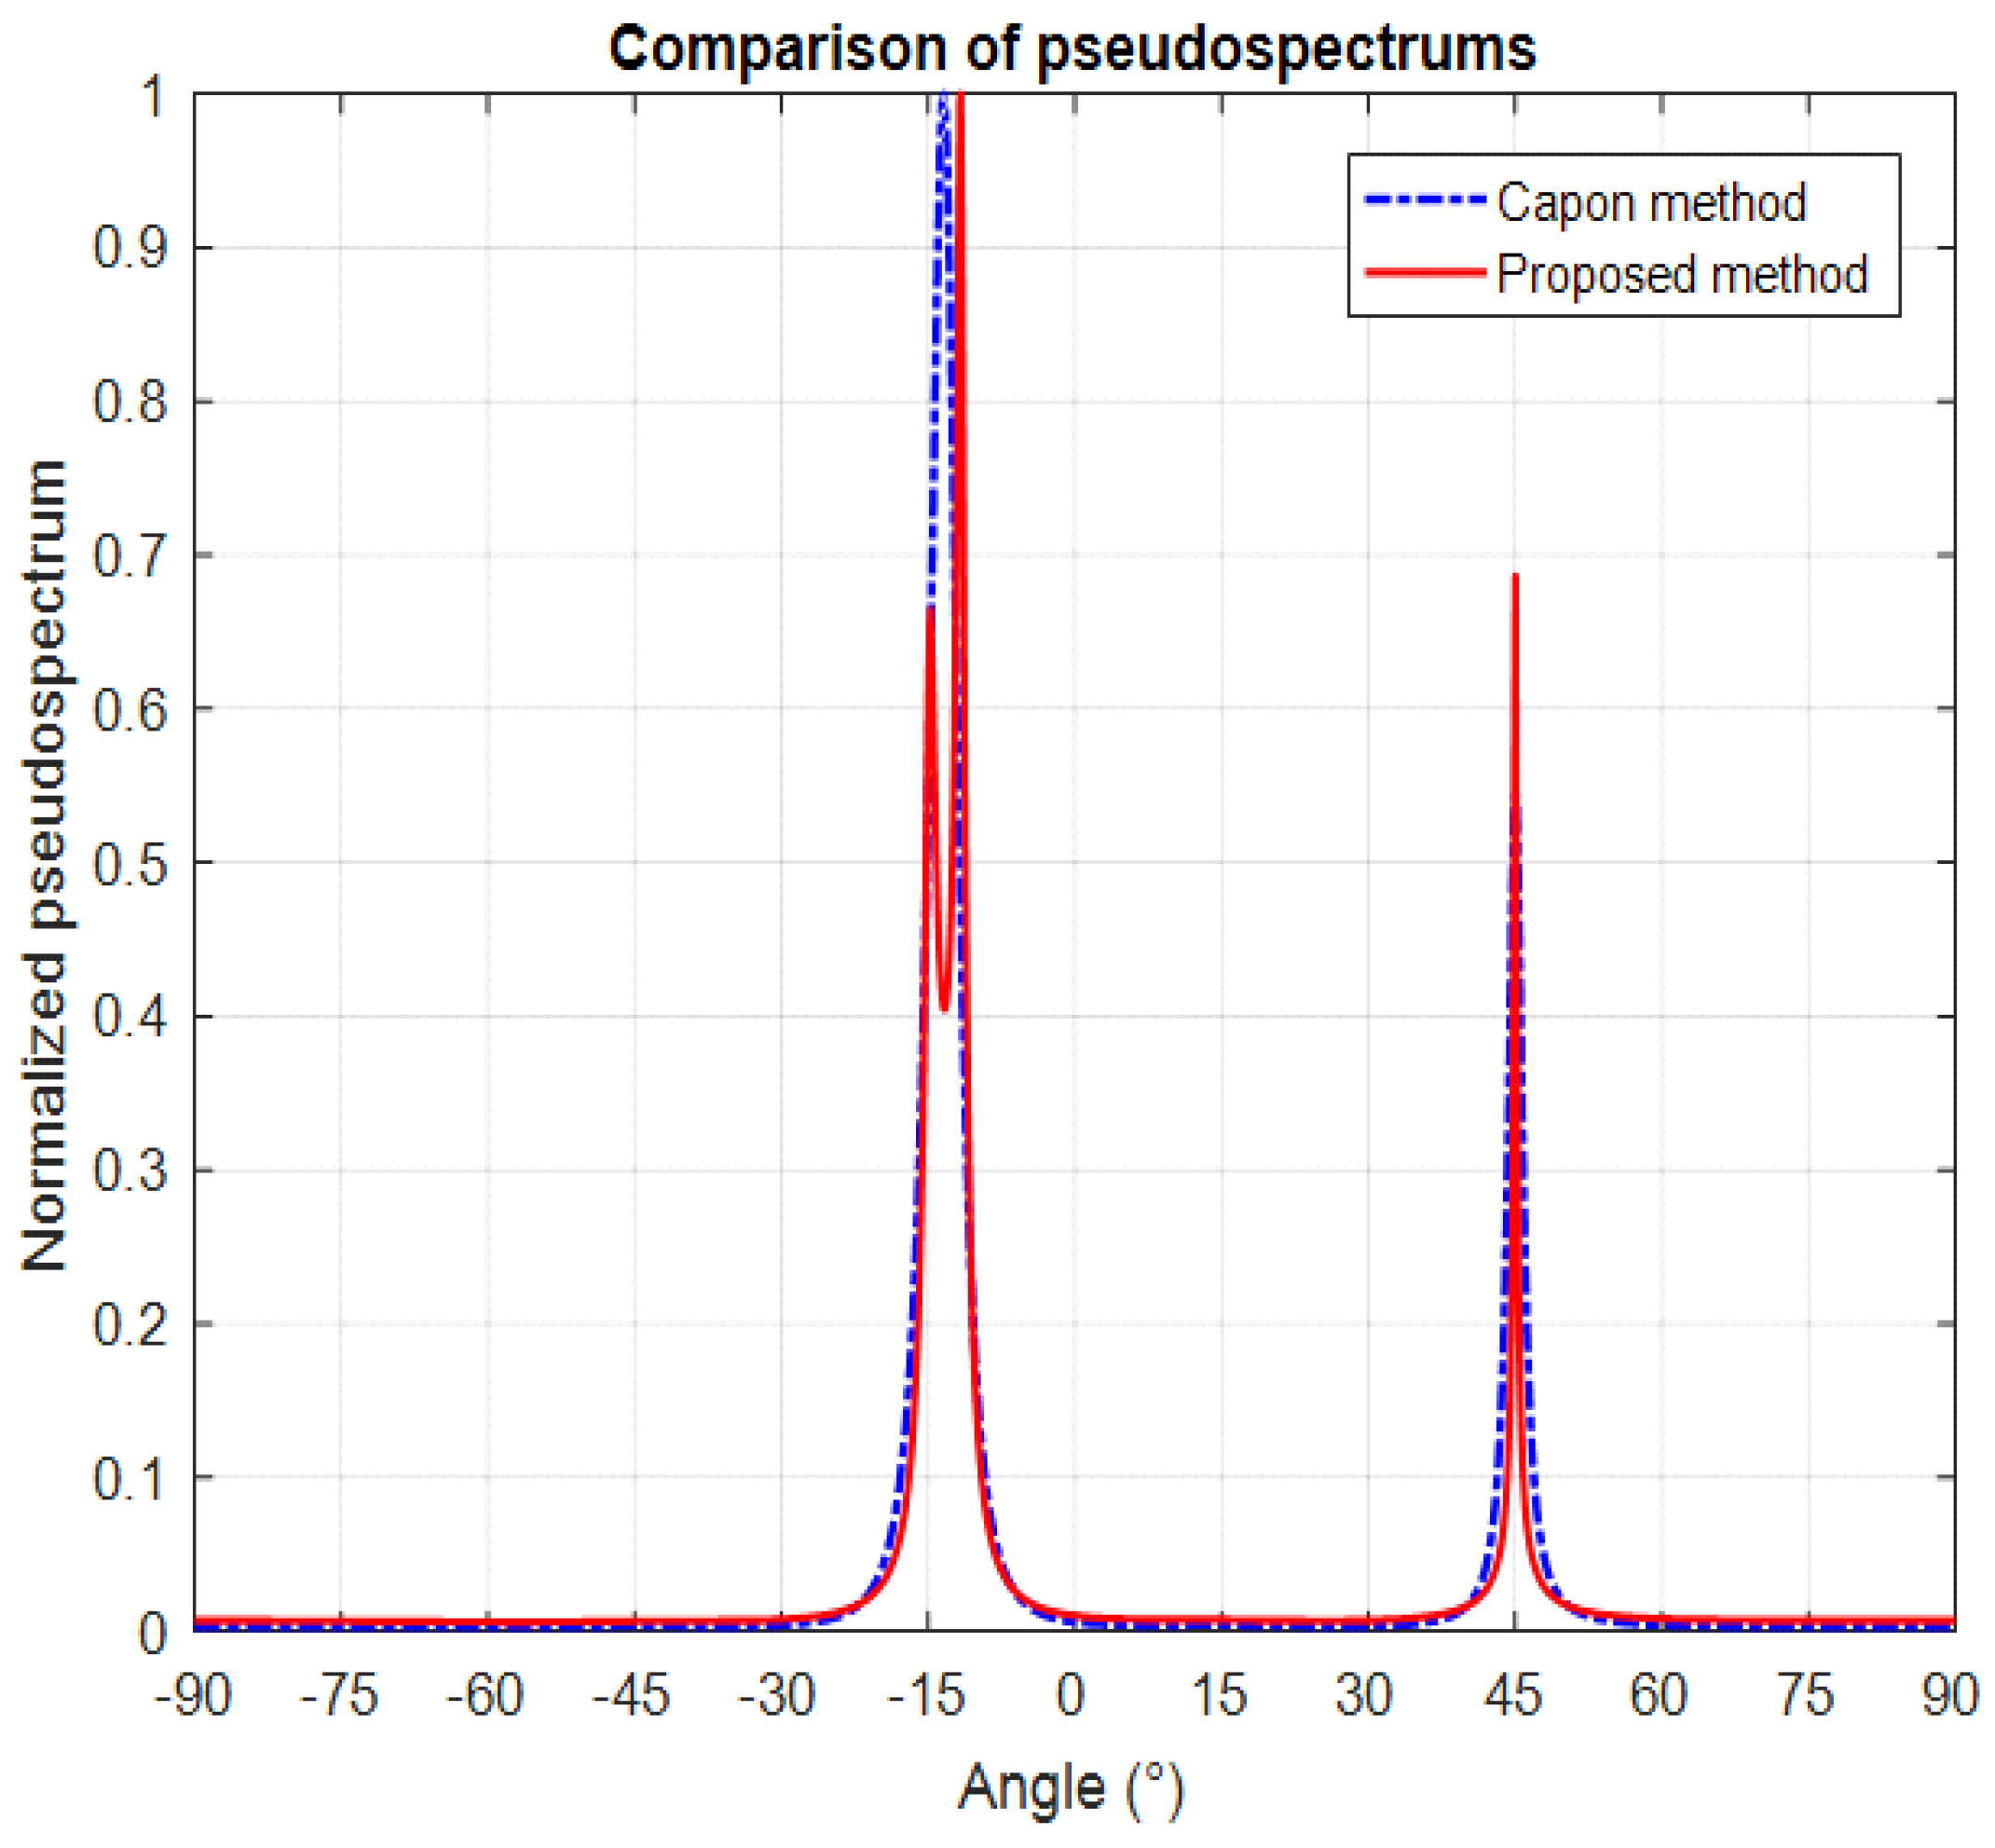
Figure 2 depict curves of normalized spectrums, which correspond to three signals impinging on the uniform linear array. As seen from this figure, it is clear that the new algorithm gives the sharpest and clearest result among the three AOAs. It provides a perfect direction estimate and gives a very acceptable result compared to the conventional algorithm. As can be seen in this figure, for two very close sources located at −12° and −15°, the standard Capon fails to correctly resolve the DOA where the large peak that is formed by the confusion of two neighboring peaks covers these directions simultaneously, whereas the proposed improved-Capon performs reasonably well and demonstrates its ability to separate the close sources.
As it is known in the theory and also in the practice of antenna arrays, the performances of most of algorithms that estimate the angles of arrival of the signals impinging on the array are mainly dependent on essential parameters, which are: the number of antenna elements, the spacing between these elements, the number of snapshots and the SNR value.
The following simulation example is based on the influence of the number of antennas on the performance of the new method proposed. In this example, we keep the same values of the parameters shown in
Table 1, except that the noise covariance
is assumed to be 0.08, and we change the number of antennas for the comparison.
In
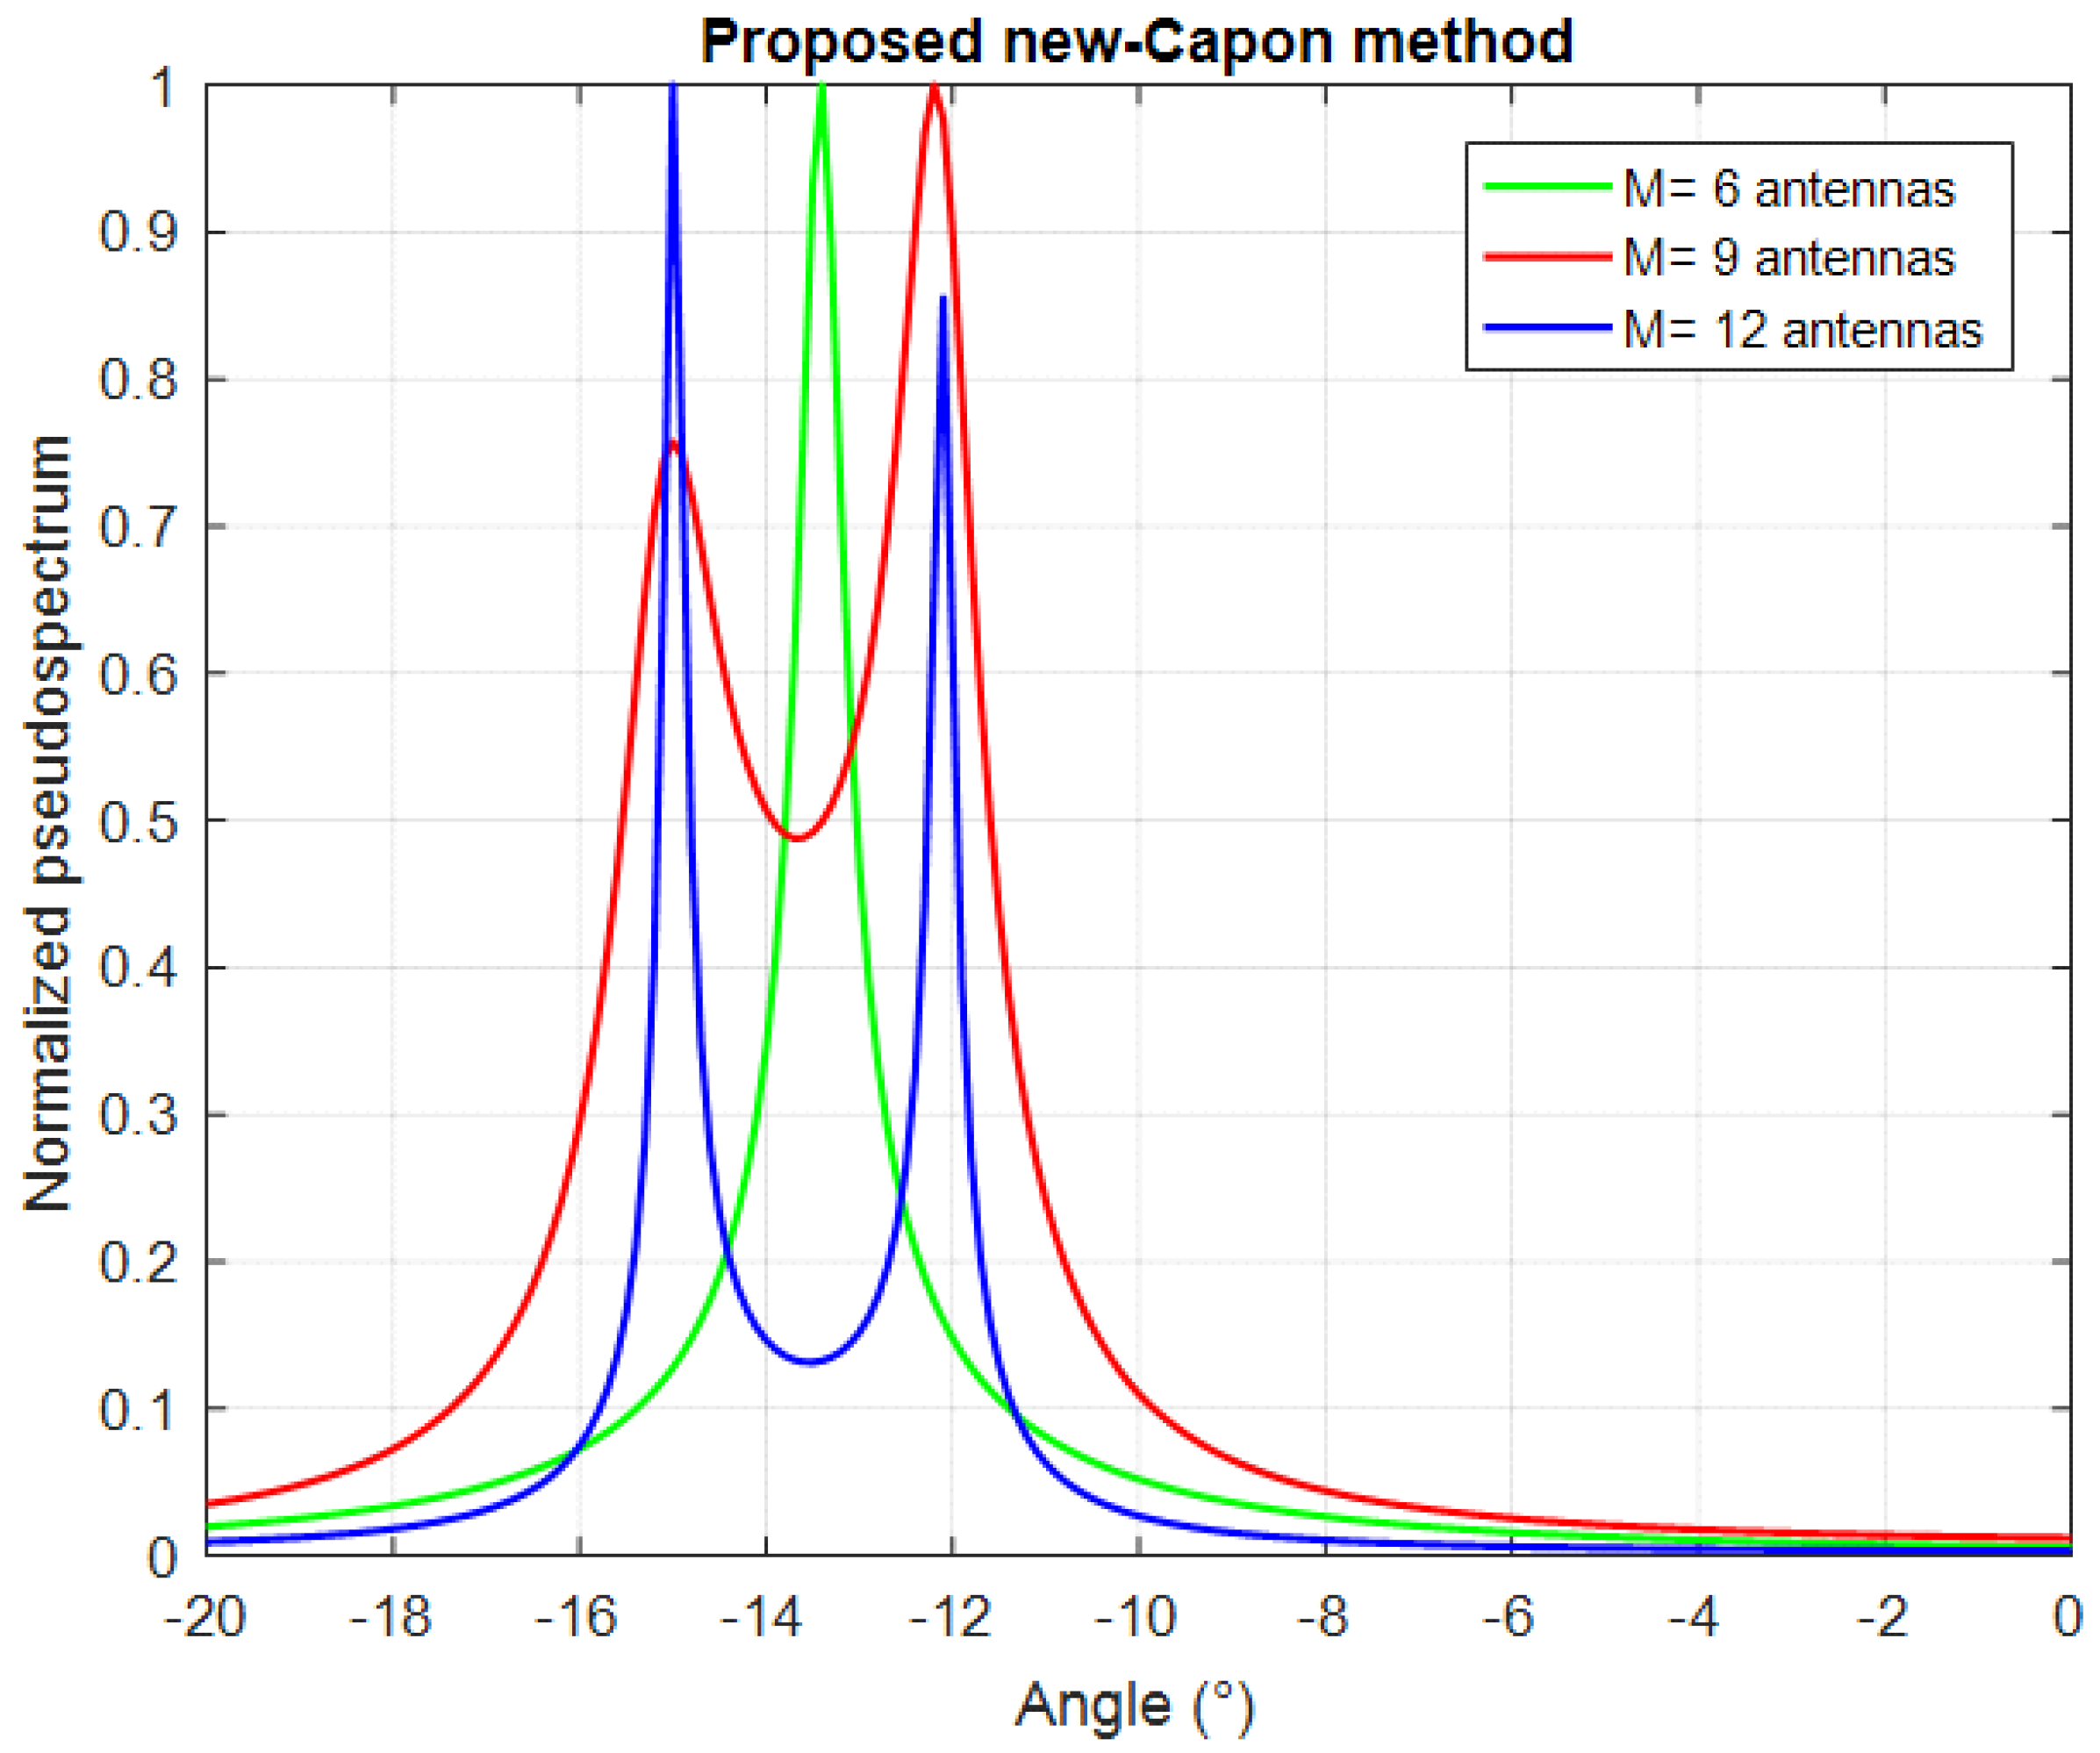
Figure 3, a comparison of pseudospectra for varying numbers of array elements is displayed. As can be observed in this figure, when the number of array antennas grows, the accuracy in identifying very close sources increases. Indeed, for two signals that are close to each other, arriving exactly from −15° to −12° and impinging on an array of six elements, two peaks might be confused with a single one in the spectrum of the new Capon method. Furthermore, for an array of 9 or 12 elements, two peaks corresponding to exact DOAs are most easily identified. The peaks may become narrower with increasing antennas in the array, therefore, the angular accuracy of the method becomes more important.
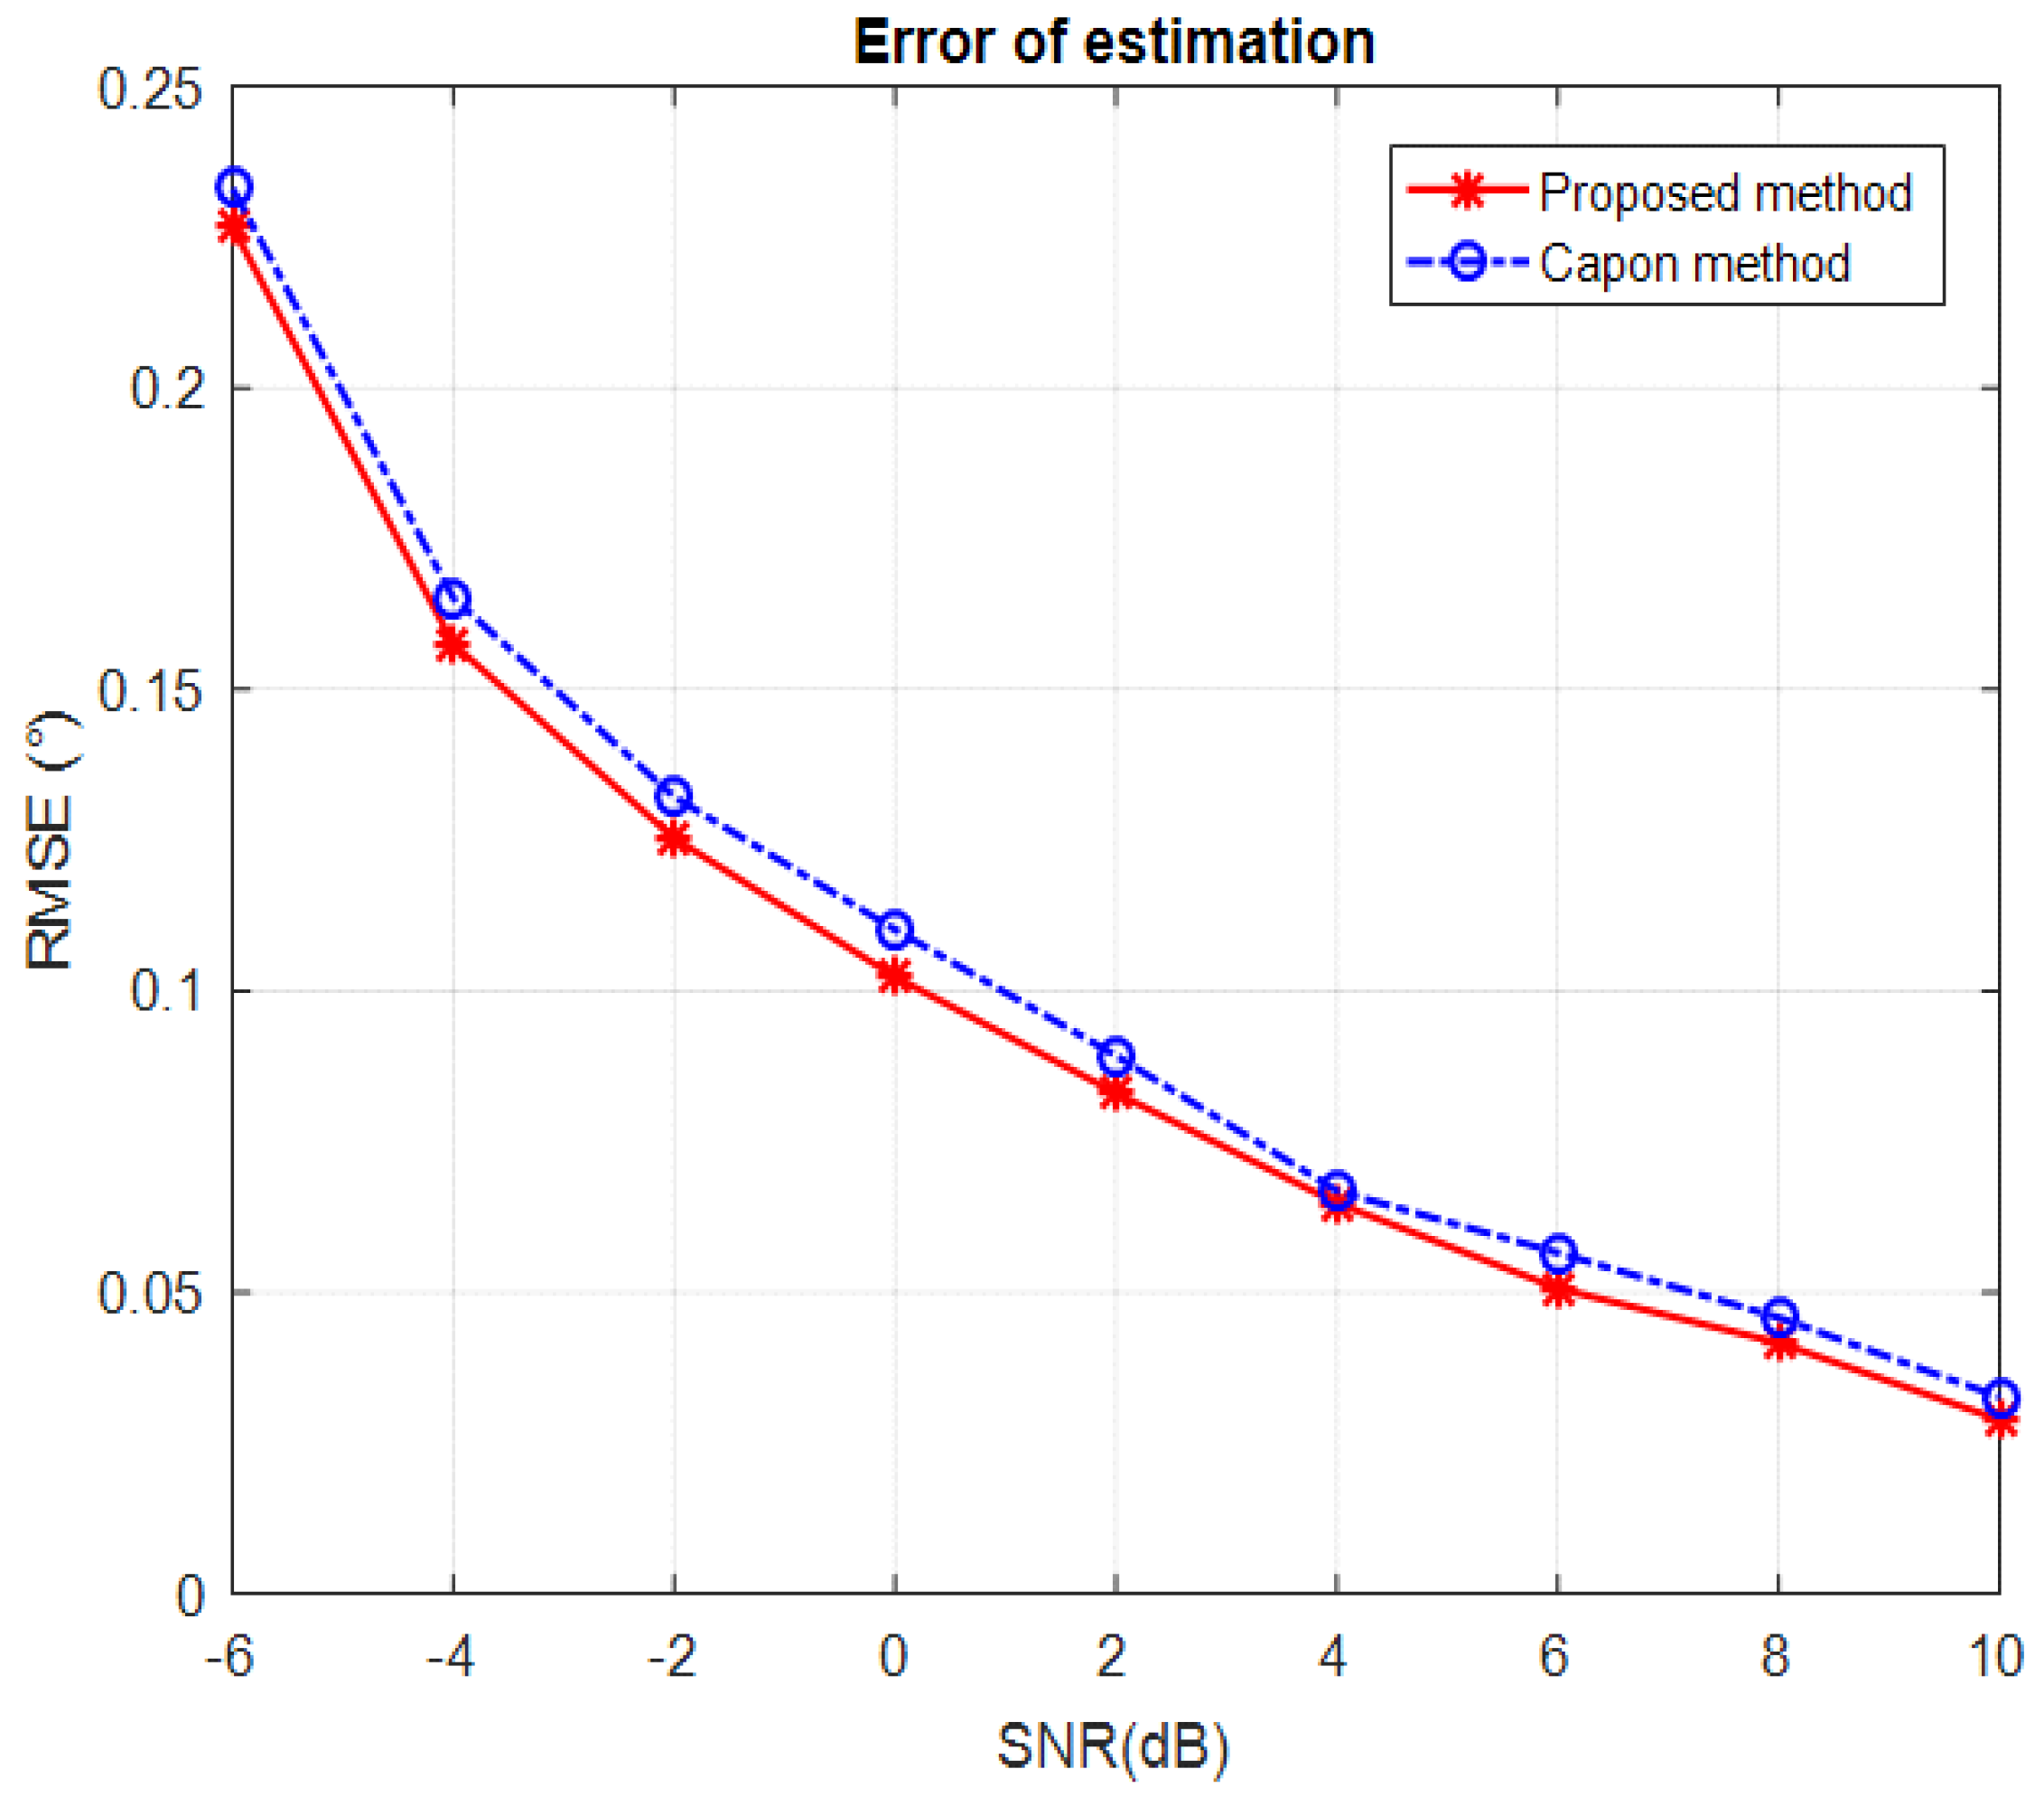
To illustrate the effectiveness of the proposed scheme in terms of root mean square error (RMSE), we consider only one signal impinging on the eight-element ULA from the source direction . In this simulation, we change the value of the SNR, and calculate the RMSE using Capon and the proposed method; 500 Monte Carlo trials are performed to obtain the statistical results.
The DOA accuracy is measured by the RMSE, which is defined as:
where
is the current estimated angle at the
ith realization,
is the true angle-of-arrival and
is the number of Monte Carlo runs.
The root mean square error (RMSE) versus SNR is depicted in
Figure 4. We can observe that the new algorithm always outperforms Capon for all values of SNR. In fact, the proposed algorithm has a reduced RMSE which indicates its accurate estimation performance. However, the slight additional estimation error of Capon certainly comes down to the need to compute the covariance matrix inversion, the geometry of the antenna array and the SNR value.
5. Conclusions
This paper has been devoted to the presentation of a new technique for estimating the direction of arrival of sources that are located in the far-field of a linear uniform antenna array. The performances of the proposed technique were compared to the basic Capon method through simulation examples. The superiority of this new technique lies in its precise estimation, even for closely spaced signals, and in its reduced complexity.


