Abstract
In this paper, we present a new low-cost system for surface electromyogram (sEMG) acquisition. developed and designed for rehabilitation application purposes. The noninvasive device delivers four-channel EMG bio-signals describing the electrical activity for the right upper limb muscles. The recorded EMG signals obtained from several healthy subjects were exploited to build a database for movement detection and to evaluate the mechanical properties of the upper limb muscles. The proposed study focuses mainly on the influence of the use of the principal component analysis (PCA) method on the movement classification performance based on the sEMG extracted signals. Several tests were conducted, and the simulation results clearly showed the positive impact of PCA as a dimensionality reduction approach with respect to two performance metrics: the classification rate (CR) and the system’s response time. This advantage was confirmed via numerical tests using three different classifiers: K-nearest neighbor (KNN), probabilistic neural network (PNN), and learning vector quantization (LVQ), with and without PCA. The obtained classification rates highlighted the success of the proposed method since a clear improvement in the classification rates was achieved.
1. Introduction
Surface EMG signals are very powerful tools for modeling and measuring the electrical activity of the muscles in the human body; they are approved and well known to be useful in many disciplines such as rehabilitation, sports medicine, and biomechanical devices [1,2]. EMG devices are available on the market, but they are relatively expensive and are usually not based on open-source platforms. A part of this study is dedicated to a low-cost EMG system that we developed in our research laboratory.
The developed instrumentation system was designed using low-cost electronic parts, and is realized around passive components and dedicated integrated circuits that are reasonably cheap compared to other sophisticated systems for EMG signal acquisition, for example, Delsys products.
When an EMG signal is recorded from a muscle, various artifacts may contaminate it. Therefore, analyzing and classifying the EMG can be a very tedious and challenging task. In our case, the EMG signals were experimentally recorded from the proposed EMG hardware platform according to a specific protocol that was checked and approved by experienced medical staff from the local hospital. The extracted signals were compared with other EMG signals from standard databases available in the literature [3]. As a consequence, the obtained EMG database was considered suitable and ready for use in our experiments.
The proper analysis of myoelectrical signals can be correctly performed only if the acquired signals are of high quality and clean of noise. We should emphasize that the EMG system proposed in this paper considers signal processing in two parts: the analog signal processing achieved during the instrumentation stages and the digital part implemented in the form of a software algorithm.
In the remaining parts of this paper, we firstly present the design of the multi-channel EMG signal acquisition device for a rehabilitation application. Then, we discuss the methods used for preprocessing the bio-signal through a selection of the digital filtering processes for which the dimensionality reduction PCA (principal component analysis) is applied. We note here that the use of the PCA technique can be particularly efficient and advantageous since it leads to a reduction in the amount of data processed by the classifier, which will have a direct impact on the computation time. Then, different classification methods are described, followed by an explanation of various evaluation techniques and some comments on the obtained results. We conclude the paper by giving a summary of this research.
2. Description of the Overall System
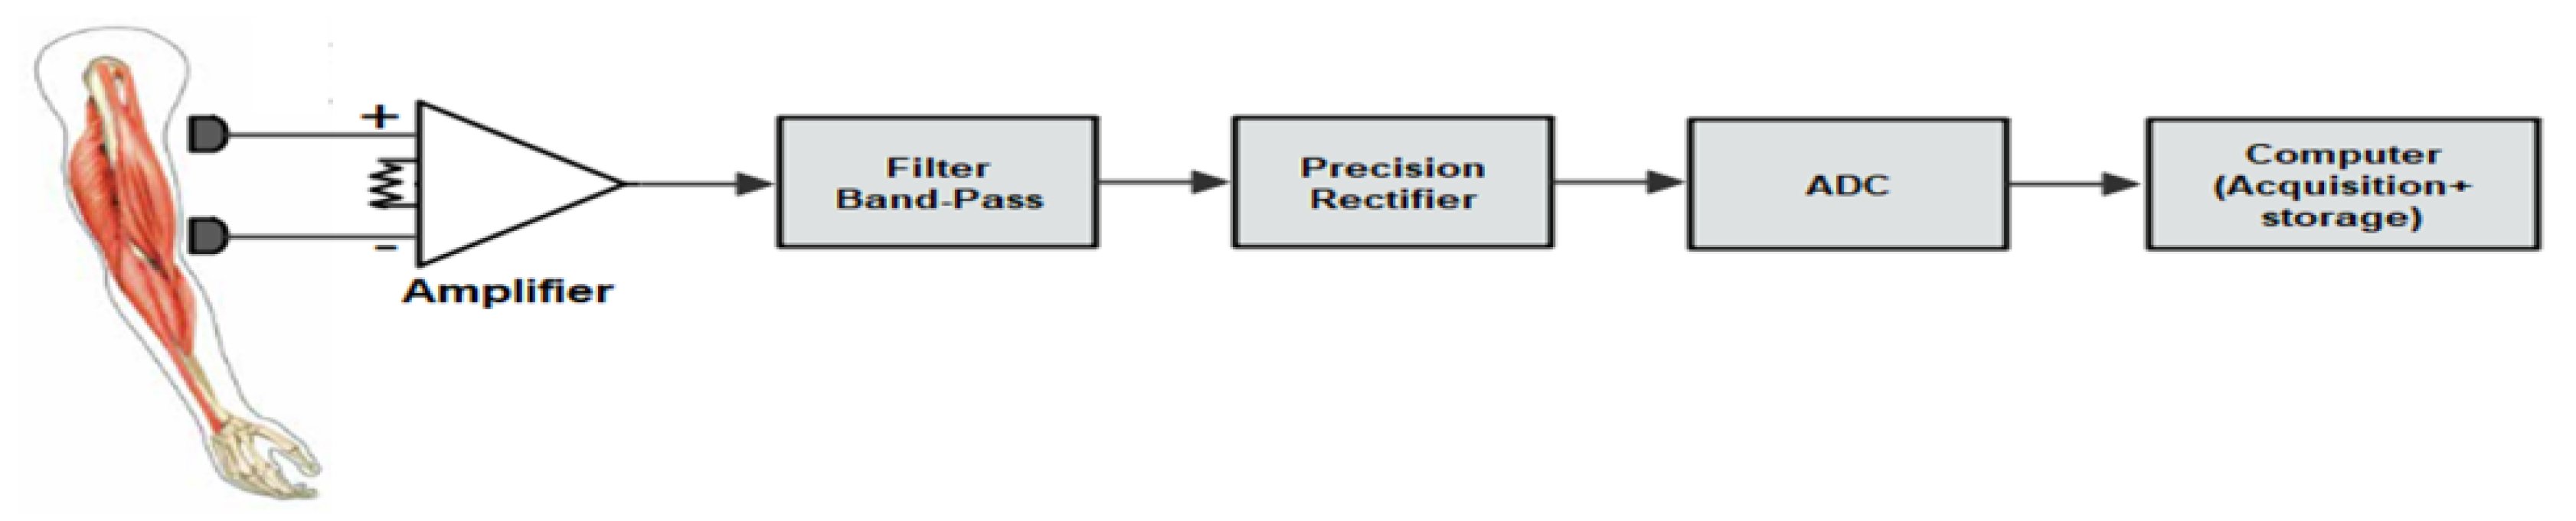
A synoptic diagram for the EMG signal acquisition is shown in Figure 1. The bio-signals are acquired from the skin’s surface by means of electrodes. In this case, standard, readily available Ag/AgCl electrodes were used.
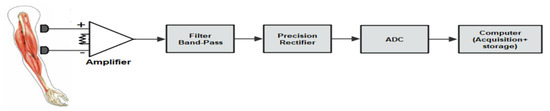
Figure 1.
A synoptic diagram of acquisition and storage of EMG signals.
The EMG system consists of a four-channel bioamplifier module and a disposable biopotential electrode as a sensor.
The resulting signals have very low amplitude, from 50 µV to 1 mV.
An instrumentation amplifier was considered for the pre-amplifier, since it provides a high CMRR and low input bias current, ensuring high input impedance, which drastically reduces common-mode signals that can be higher than the EMG signal.
At the next stage, the signal is filtered by an active high-pass filter (cut-off frequency of 19.4 Hz) and an active low-pass filter (cut-off frequency of 482.28 Hz). After this, we utilized a precision full-wave rectifier, which rectifies the input signal at the output.
The data acquisition system used in this case was a multifunction DAQ device (NI USB-6210) from National Instruments, with a 16-bit resolution, and the EMG signal was digitized at 1000 samples per second.
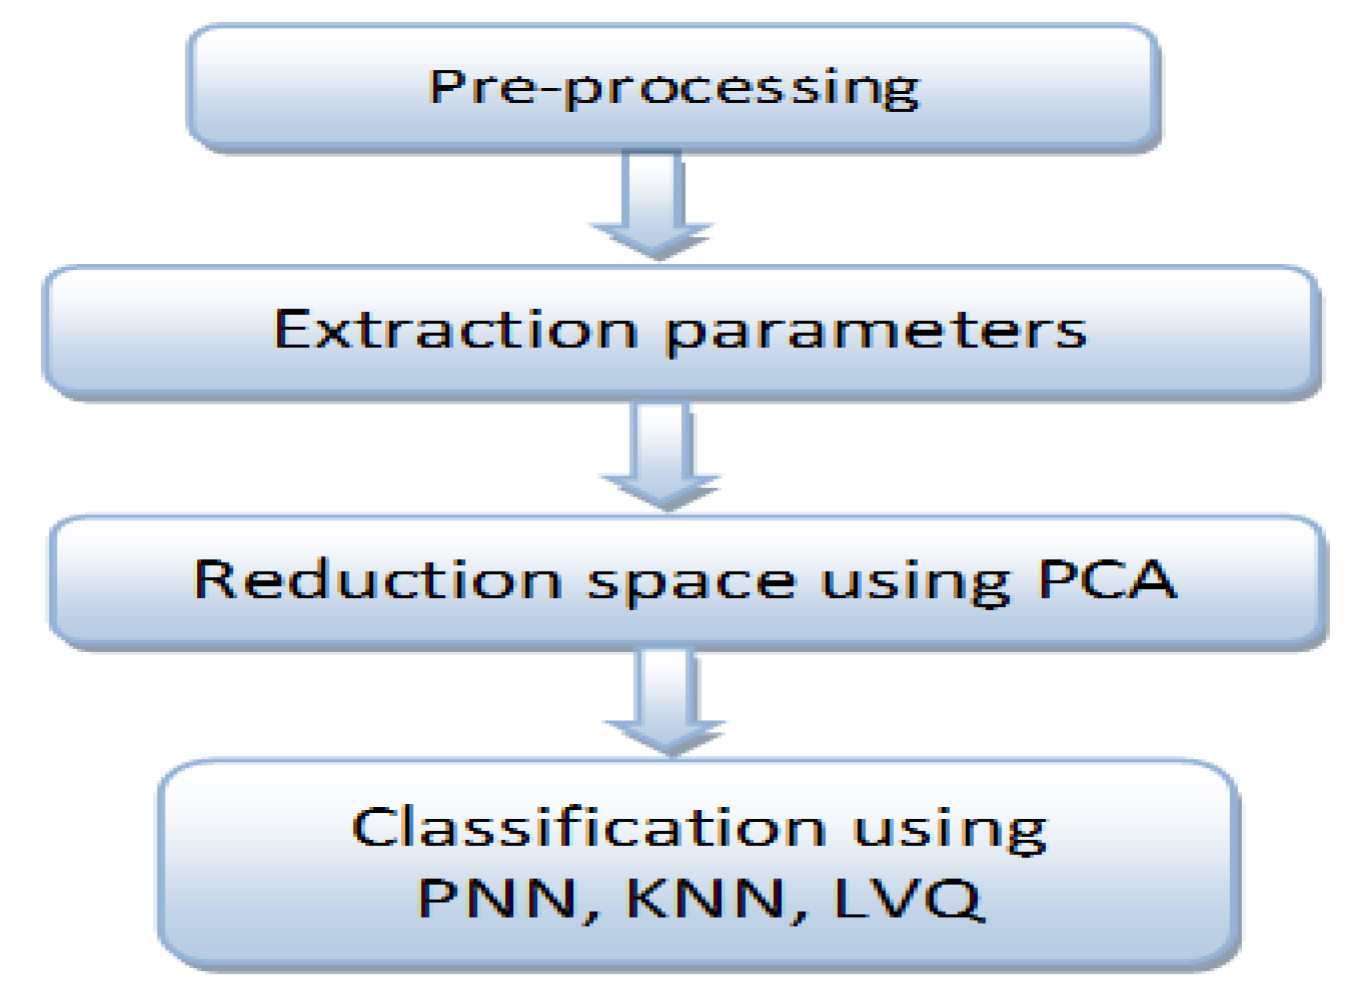
Finally, at the data storage and processing stage, the acquired signal from the DAQ device is stored in a computer, and subsequently several processing tools are used, such as digital filtering, normalization, segmentation, and classification, as indicated in Figure 2.
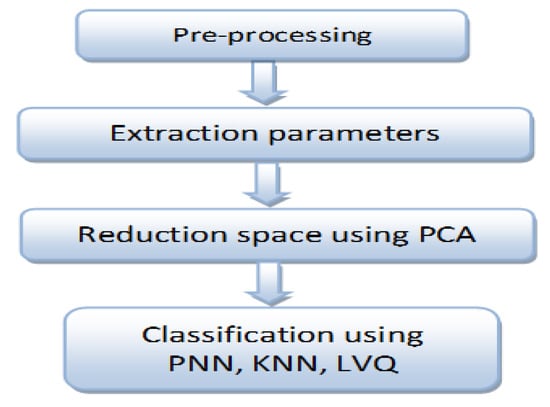
Figure 2.
Steps of EMG signal processing to achieve better recognition.
3. Experiment and Data Collection
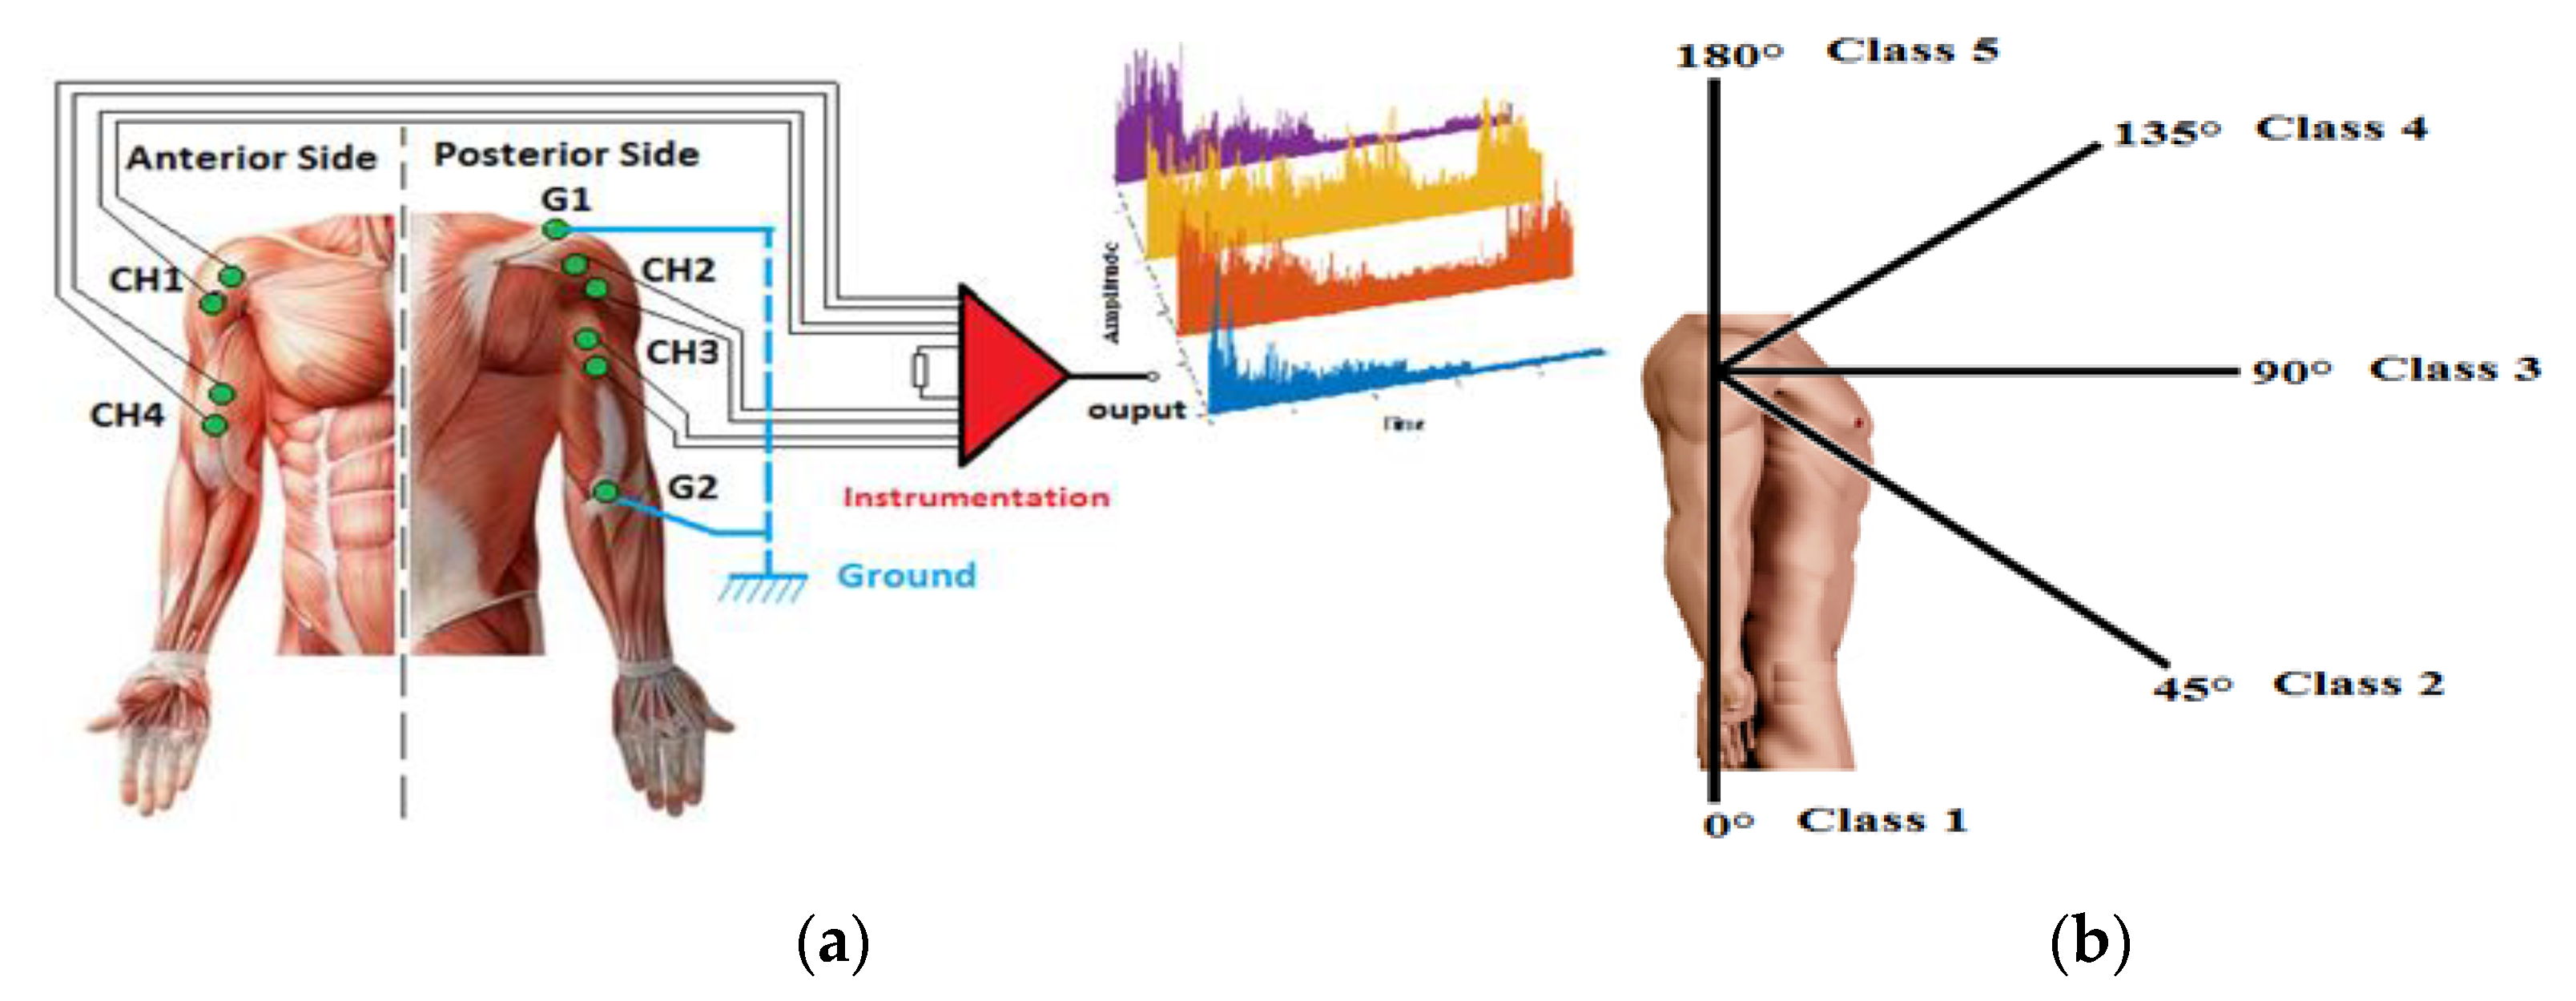
The EMG signals were acquired from four positions on the right upper limb, as shown in Figure 3a: the anterior deltoid (CH1), posterior deltoid (CH2), triceps brachii (CH3), and biceps brachii (CH4). G1 at the acromion and G2 at the olecranon are reference electrodes.

Figure 3.
(a) EMG electrode placement on the right upper limb and instrumentation; (b) five motions (positions 0°, 45°, 90°, 135°, 180°).
The recorded signals from the four channels are classified to describe five positions at 0°, 45°, 90°, 135°, and 180°, as shown in Figure 3b. The database of EMG signals was collected from several participants aged between 20 and 42 years. The protocol followed during the acquisition experiments was: the subject makes a movement and stays steady at each position (equivalent to the five classes) for 30 s, then the upper limb is relaxed for 10 s.
4. Analyzing and Pre-Processing Data Signals
4.1. Digital Filtering
Two digital filtering algorithms were implemented:
- ➢
- Digital notch filter to eliminate 50 Hz harmonic.
- ➢
- Smoothing filter to reduce the high spatial frequencies in the EMG data.
4.2. Normalization
Data should be scaled to take values between 0 and 1. One possible formula to achieve this is given by Equation (1).
where and is the th normalized data point.
4.3. Segmentation
All signals used in this study were segmented into segments of 200 samples, without overlapping.
4.4. Feature Extraction
A large amount of information can be extracted from the EMG signal. In our case only a small proportion was selected, according to the application targeted. In this study, we selected three types.
- Integrated EMG (IEMG):
This is used as an onset detection index in EMG. It is defined by Equation (2).
N is the length of the signal and xn represents the segment of the EMG signal.
- 2.
- Mean Absolute Value (MAV):
This is favored in prosthetic limb control. It is defined by Equation (3).
- 3.
- Root Mean Square (RMS):
This is modeled as an amplitude-modulated Gaussian random process. It can be calculated using Equation (4).
4.5. Principal Component Analysis
In order to reduce the important dimensionality of the acquired segments of the EMG, we applied a PCA approach, so that we could retain only the discriminative features.
EMG Recognition Using PCA Approach
This step consists in defining the EMG data Γ_i;i = 1…M. These data must be the same size and centered. We calculated the average of the dataset, represented as a vector.
The data are centered relative to their average.
The construction of the global matrix A is obtained using Equation (7).
We calculate the covariance matrix of Φ using Equation (8).
Pentland et al. in [4] solved the problem mathematically to extract the values and eigenvectors.
The eigenvalues of matrix C are selected in descending order, representing the variance of the original distribution space (EMG data).
We denote the eigenvectors of C by .
We usually need to keep a smaller number of eigenvectors corresponding to the largest eigenvalues.
The two matrices and have the same values, and the eigenvectors are related as follows:
From this relationship, we use the matrix:
The weights of the original projection of the EMG vector on the new EMG data space are described as follows:
for k, i = 1, 2 … M.
The weights of the features of the EMG data in the resulting space, is supposed to have discriminative information and reduced size of data, given by:
5. EMG Signal Classification
5.1. K-Nearest Neighbor Classification
The K-nearest neighbor (KNN) classifier is a conventional non-parametric classifier. It calculates the distances between a given point and all points in the training data set. Then, it assigns the considered point to the class among its K nearest neighbors (where K is an integer). The K = 1 case is a benchmark for other classifiers.
To appropriately conduct our tests, we considered the following parameters:
: The weights of the features of the test EMG signal.
: The weights of the features of the training EMG signal, where K = 1 …N.
L1 is the Manhattan distance defined by Equation (15):
L2 is the Euclidean distance defined by Equation (16):
The MahCosine distance is defined by Equation (17):
To perform the comparison, which is based on the calculation of the distance between two vectors, we take the minimum distance compared to an appropriate decision threshold value θ, as explained in the following.
If min (k = 1 … M) this is a defined class.
If min (k = 1 … M) this is an unknown class.
5.2. Classification Using Neural Newtorks
Previous studies have shown improved EMG classification systems using neural networks, compared to classifications based on the Euclidean distance measure [5].
5.2.1. Probabilistic Neural Networks PNN
The PNN was proposed by D.F. Specht in 1988 for solving the problem of classification [6]. The theoretical foundation was developed based on Bayes decision theory, and it is implemented in a feed-forward network architecture.
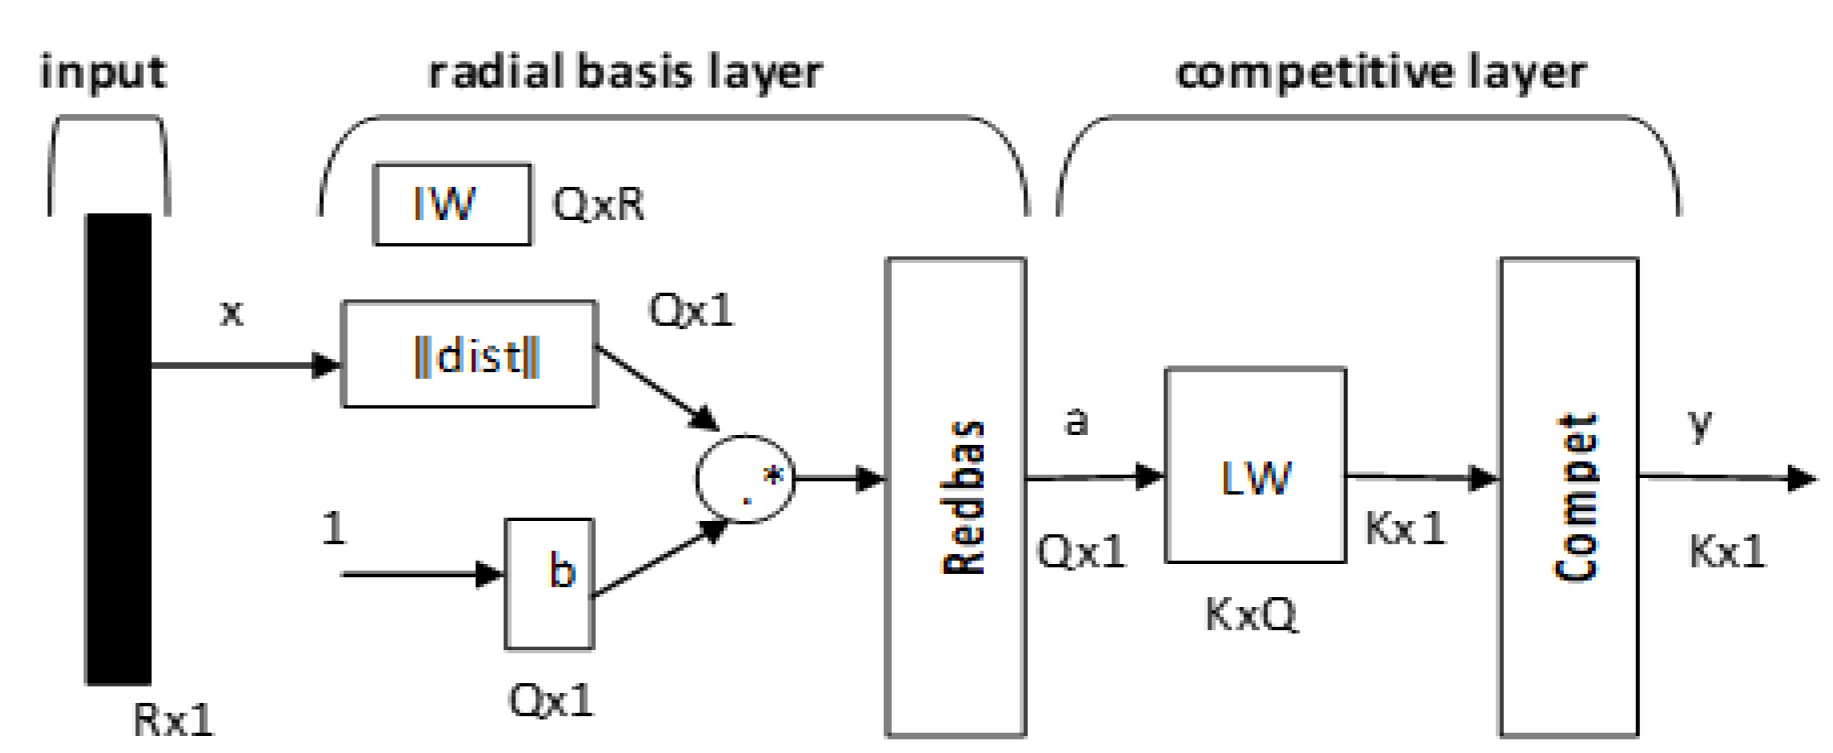
A PNN is represented by Equations (19) and (20):
where IW is the input weight and LW is the layer weight.
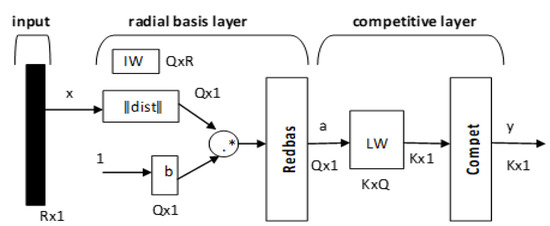
Figure 4.
Architecture of the probabilistic neural network.
R is the number of elements in the input vector, Q represents the input/target pairs, and K represents the classes of the input data. The first layer computes distances from the input vector to the input weights (IW) and produces a vector whose elements indicate how close the input is to the IW. The second layer sums these contributions for each class of inputs to produce a vector of probabilities as an output. Finally, a transfer function on the output of the second layer picks up the maximum of these probabilities and produces a 1 for that class and a 0 for the other classes. Each hidden unit can approximate any continuous nonlinear function. In this study, we used the Gaussian function as the activation function, giving Equations (21) and (22).
5.2.2. Learning Vector Quantization Networks (LVQ)
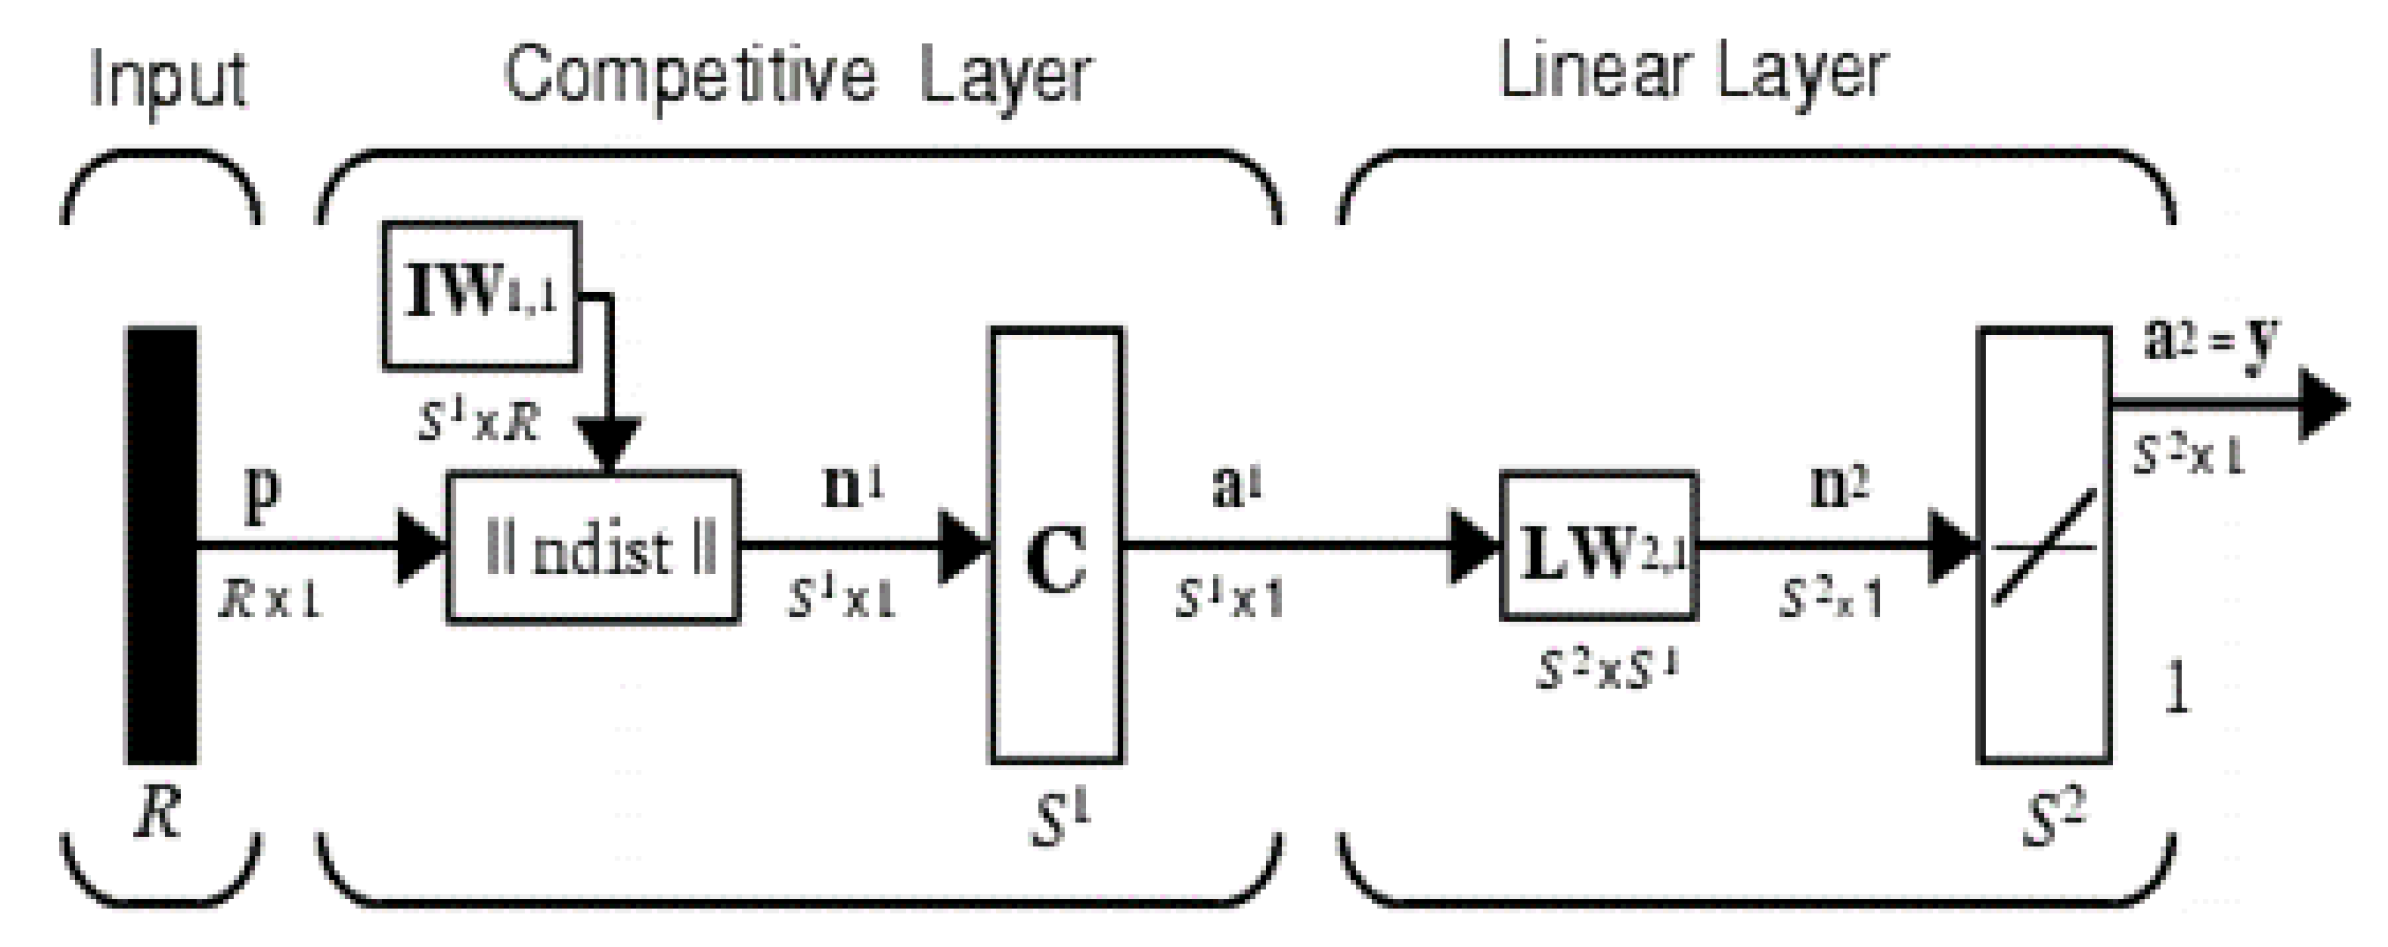
The vector quantization technique was originally proposed by Tuevo Kohonen in the mid-1980s [5,7]. Both vector quantization networks and self-organizing maps are based on the Kohonen layer, which is capable of sorting items into appropriate categories of similar objects. These types of networks find their application in classification and segmentation problems. The architecture of the LVQ network is shown in Figure 5. It consists of three layers: the input layer, the competitive layer, and the linear output layer. The number of neurons in each layer depends on the input data and the number of classes handled. The number of input neurons is equal to the number of input matrix features of the training pattern, and the number of output neurons is equal to the number of class patterns. The number of hidden neurons is heuristic.
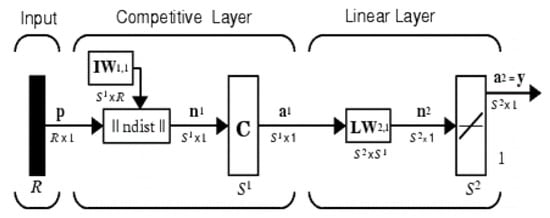
Figure 5.
Architecture of learning vector quantization.
R is the number of elements in the input vector, is the number of competitive neurons, and is the number of linear neurons. The network functionality is defined by Equations (23)–(25).
6. Results and Discussion
In order to evaluate and test the proposed approach for the EMG classification, we chose our own database, as previously described. In the first evaluation, the EMG vector was extracted using various statistical extraction methods. During this test, the Euclidean distance was selected for the classification stage. As a consequence, we computed the Euclidean distance between the input vector and the training set.
After a series of experiments, we obtained a better recognition rate based on the MahCosine distance, which achieved a rate of 75%. The comparison with other similarity measures used in this experiment is shown in Table 1.

Table 1.
Recognition rate obtained by KNN with different types of similarity measures.
In the second evaluation, in order to enhance the results obtained in the previous experiment, we combined our system with two types of classifiers: the PNN and the LVQ. To achieve this, we selected the appropriate parameters of the system classifier architecture. In the case of the PNN network, the training algorithm does not require as many parameters as other neural networks (MLP, BP, LVQ, etc.); only the smoothing parameter σ parameter is needed for the network performance tuning. Usually, researchers and experts try different values of σ in a certain range, to obtain a suitable value that can reach the optimum accuracy [6].
The PNN used in our system was composed of two layers. The first layer is the input layer, and the number of hidden units is the number of independent variables. This layer receives the input data that correspond to the number of the extracted features. The output layer gives the number of states of EMG used in the training database. To obtain a higher recognition rate, we performed a series of experiments to choose the best smoothing parameter σ (σ < 120) for use in the PNN.
In the case of the LVQ, changes in the LVQ classifier parameters had a large effect on the classification results. We found that the best learning rate increased the system recognition rate. Therefore, we used different values of learning rates (0.1, 0.2, 0.3, and 0.6) with 800 epochs and 1000 hidden neurons in our experiments.
In the third experiment, after reducing the dimension of the EMG signal using statistical methods, we used the PCA approach to extract the EMG features in the new space, while considering the three classifiers, i.e., KNN, LVQ, and PNN.
After a series of experiments, we were able to choose the best parameter values to set up an appropriate choice of eigenvectors to give a better recognition rate. Feature vectors containing 7 components were obtained. Thus, the dimensionality of vectors to be input to the neural network was drastically reduced from 32 to 7. This indicates that there was significant redundancy present in the data set. These feature vectors were then applied at the input of a neural network classifier, i.e., LVQ or PNN.
The performances of the neural classifiers were evaluated by computing the classification rate (CR) and the running time (RT). In this experiment, we compared the performance of three approaches, namely, PCA-KNN, PCA-LVQ, and PCA-PNN, in terms of CR and RT. We clearly verified the superiority of the PCA combined with a neural classifier compared to using a Euclidean distance classifier such as KNN.
The results obtained using our approach show that it reduced the training computation time and improved the recognition rate, as illustrated in Table 2, Table 3 and Table 4.
Table 2.
The classification rate using different methods on our database (without PCA).
Table 3.
The classification rate using different methods on our database (with PCA).
Table 4.
Running time of performance classification.
7. Conclusions
In this paper, we proposed an approach for EMG classification based on a combination of two methods, with one used for the reduction of the space and feature extraction and the other used for classification and decision. The application of the proposed approach based on PCA combined with a probabilistic neural classifier succeeded in improving our system performance. Indeed, we achieved a better classification rate compared to other techniques described in this paper. Our choice of using PCA techniques as a pre-processing stage was successful in terms of many aspects of performance such as increasing the classification rate, decreasing the computation time, and reducing the memory required. As a continuation of this work, we propose to use the system in a real rehabilitation device.
Author Contributions
Basically, all authors have equally contributed to this work, under the supervision of M.O., and M.B. All authors have read and agreed to the published version of the manuscript.
Funding
This research received no external funding.
Institutional Review Board Statement
Not applicable.
Informed Consent Statement
Informed consent was obtained from all subjects involved in the study.
Data Availability Statement
Not applicable.
Conflicts of Interest
The authors declare no conflict of interest.
References
- Clancy, E.; Horgan, N. Probabilistic Density of the Surface Electromyogram and its Relation to Amplitude Detectors. IEEE Trans. Biomed. Eng. 1999, 46, 730–739. [Google Scholar] [CrossRef] [PubMed]
- Poo, T.S.; Sundaraj, K. Design and Development of a Low Cost EMG Signal Acquisition System using Surface EMG Electrode. In Proceedings of the 2010 IEEE Asia Pacific Conference on Circuits and Systems, Kuala Lumpur, Malaysia, 6–9 December 2010; pp. 24–27. [Google Scholar]
- Atzori, M.; Gijsberts, A.; Castellini, C.; Caputo, B.; Hager, A.-G.M.; Elsig, S.; Giatsidis, G.; Bassetto, F.; Müller, H. Electromyography data for non-Invasive naturally-controlled Robotic Hand Prostheses. Sci. Data 2014, 1, 140053. [Google Scholar] [CrossRef] [PubMed] [Green Version]
- Rokach, L. Pattern Classification Using Ensemble Methods Series in Machine Perception and Artificial Intelligence; World Scientific Publishing Co.: Singapore, 2010; Volume 75. [Google Scholar]
- Sumathi, S.; Paneerselvam, S. Computational Intelligence Paradigms: Theory & Applications Using Matlab; Taylor and Francis Group: Abingdon, UK, 2010. [Google Scholar]
- Specht, D. Probabilistic neural network and the polynomial adaline as complementary techniques for classification. IEEE Trans. Neural Netw. 1990, 1, 111–121. [Google Scholar] [CrossRef] [PubMed]
- Neural Network Toolbox Matlab, User’s Guide; MathWorks, Inc.: Natick, MA, USA, 1992.
Publisher’s Note: MDPI stays neutral with regard to jurisdictional claims in published maps and institutional affiliations. |
© 2022 by the authors. Licensee MDPI, Basel, Switzerland. This article is an open access article distributed under the terms and conditions of the Creative Commons Attribution (CC BY) license (https://creativecommons.org/licenses/by/4.0/).