1. Introduction
Induction motors (IMs) are commonly used in a variety of industrial uses. However, like all rotating electrical machines (REMs), they are vulnerable to a variety of faults. Monitoring is a crucial step in avoiding a sudden halt. Stator faults, rotor faults, bearing faults, and other faults are the most common fault classifications in IMs. The factor-bearing fault has a large proportion of fault distributions in IMs, reaching 41% [
1]. Air-gap variance, torque oscillation, stator current over current, extreme loading, elevated losses, and others are some of the symptoms of this fault [
2,
3]. As a result, one of the most commonly used types of bearings in the mechanical method of REMs is the rolling element bearing (REB). Early detection of REB faults is essential in order to avoid a variety of damages, including economic losses, and they necessitate special supervision.
The fast Fourier transform (FFT) tool is one of the many that confirm a high level of efficiency in a stationary regime [
4,
5]. Researchers have recently used this method to study a variety of signals, including vibration, stator current, electromagnetic torque, and magnetic field signal [
6,
7,
8,
9]. Several faults have been detected using techniques such as artificial neural network (ANN), wavelet transform (WT), fuzzy logic (FL), Hilbert transform (HT), empirical mode decomposition (EMD), motor vibration signature analysis (MVSA), and motor current signature analysis (MCSA) [
10,
11,
12,
13]. Many scholars in the field of REM diagnosis have recently been interested in the stray flux signature analysis (SFSA) technique [
14,
15,
16].
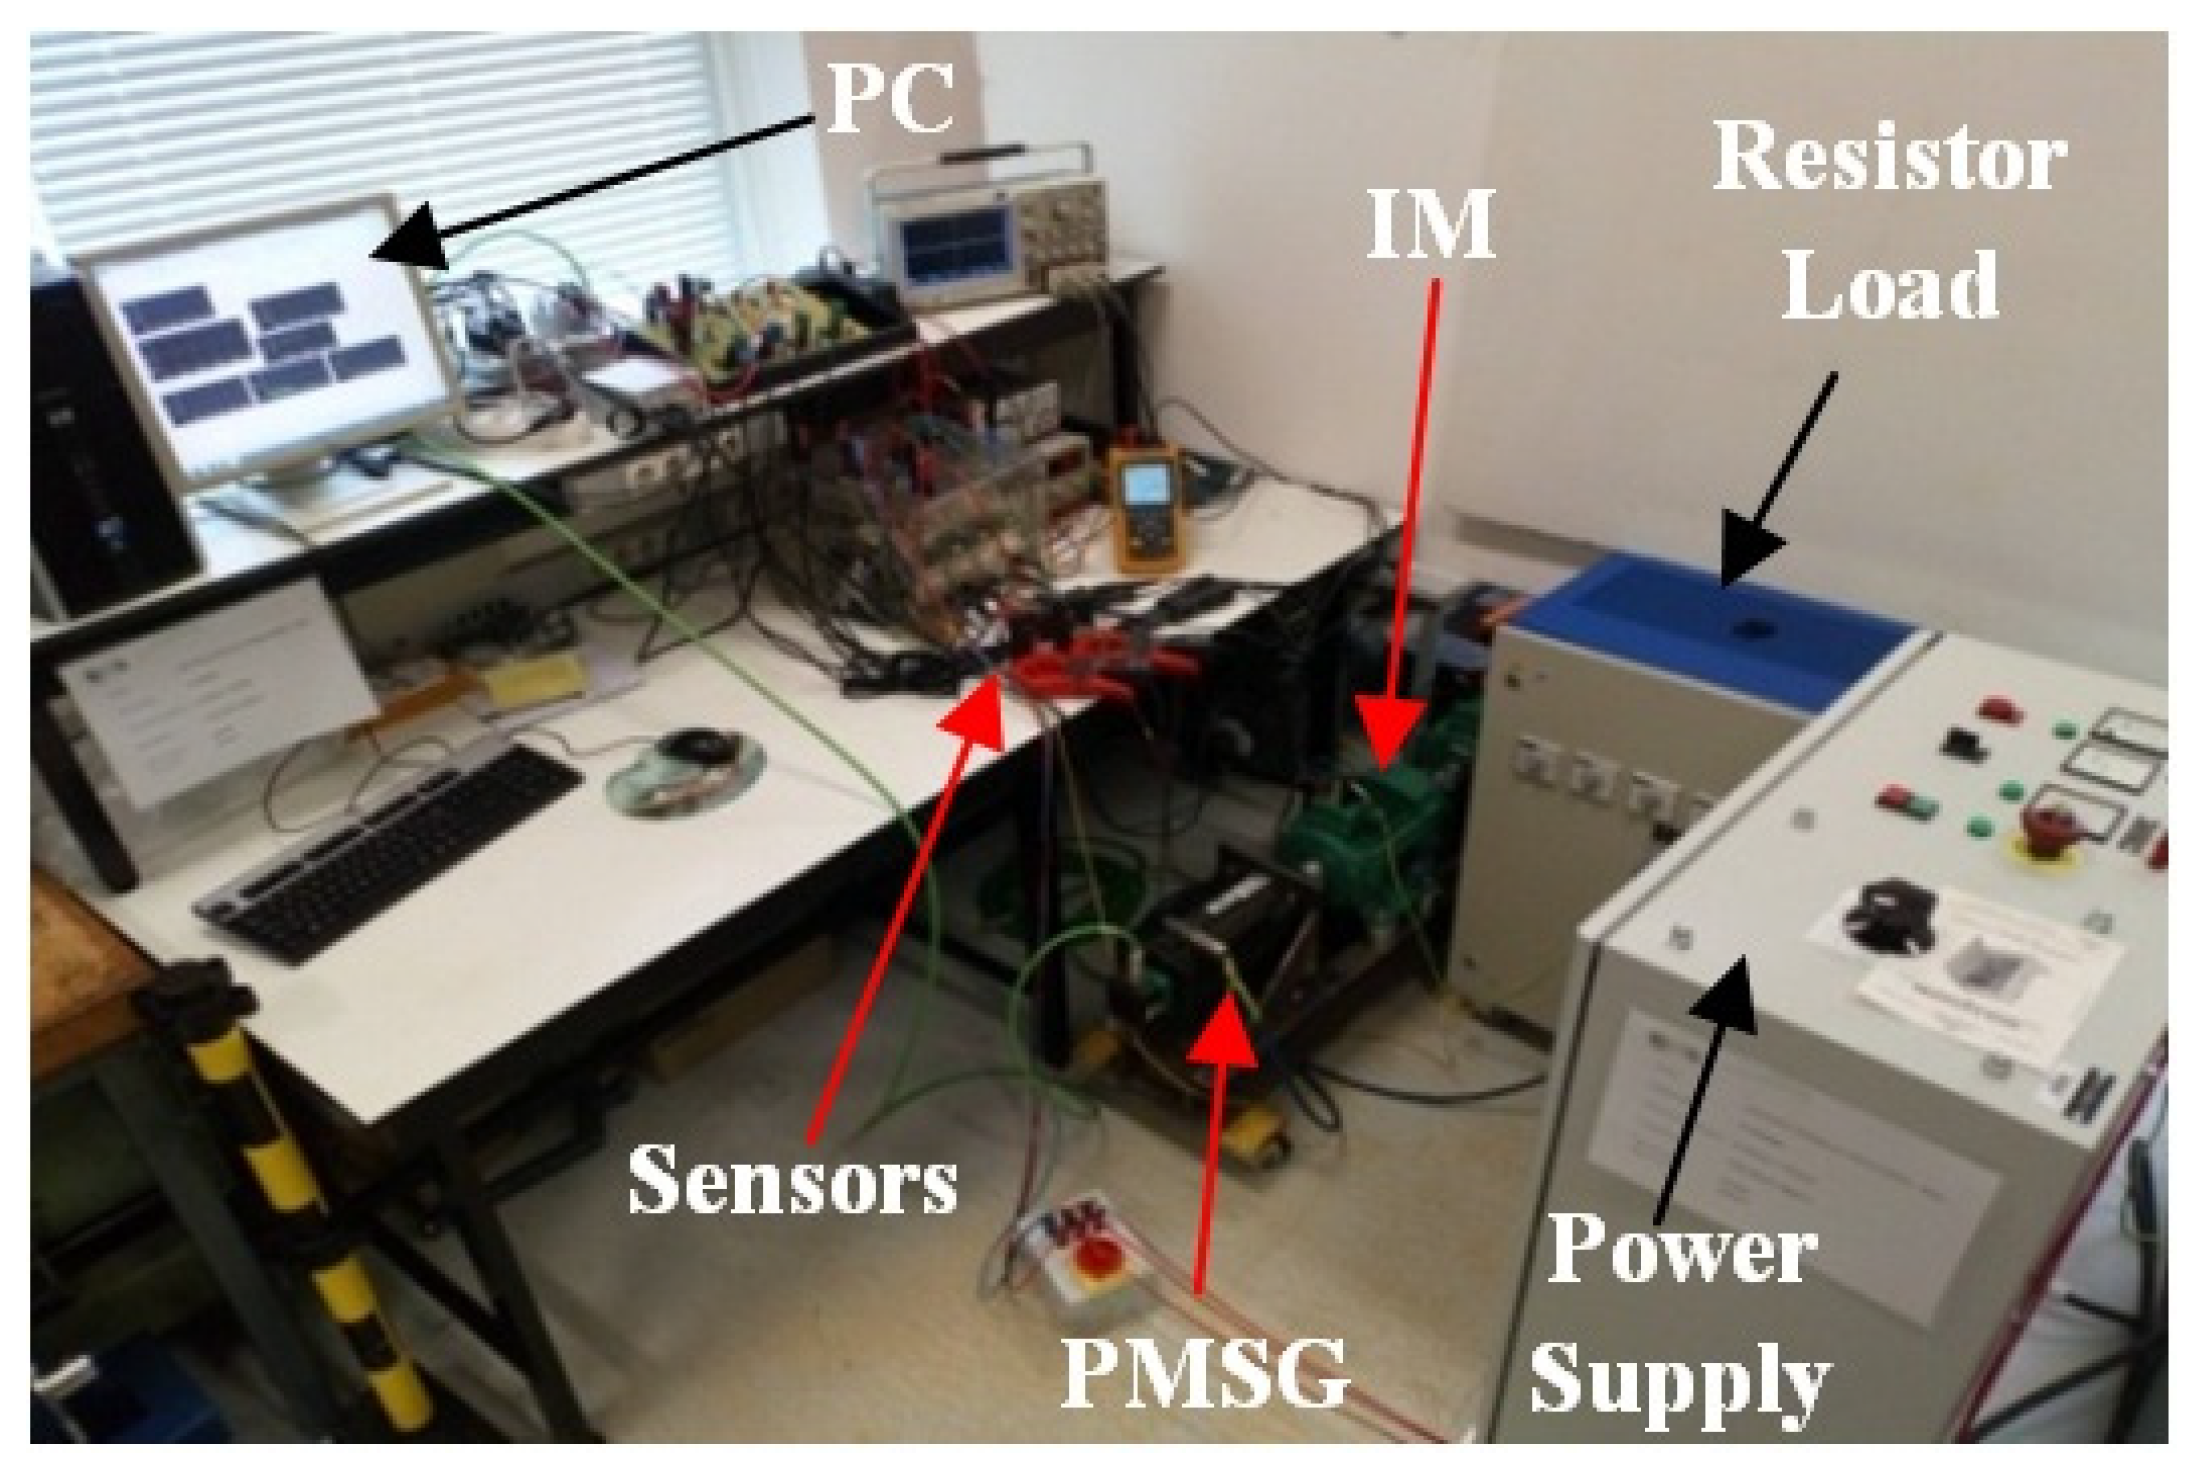
This paper examines the feasibility of using stray flux to detect REB faults in IM type. The main objective of this technique is to detect the REB fault. The IM used in the experimental test bench presented in
Figure 1 has the following characteristics: P = 4 kW,
p = 1. The fundamental frequency of the stator currents is
fs = 50 Hz.
2. REB Characteristic for Experimental Test
It is known that there are four elements of the REB. According to these elements, we can cite four REB faults:
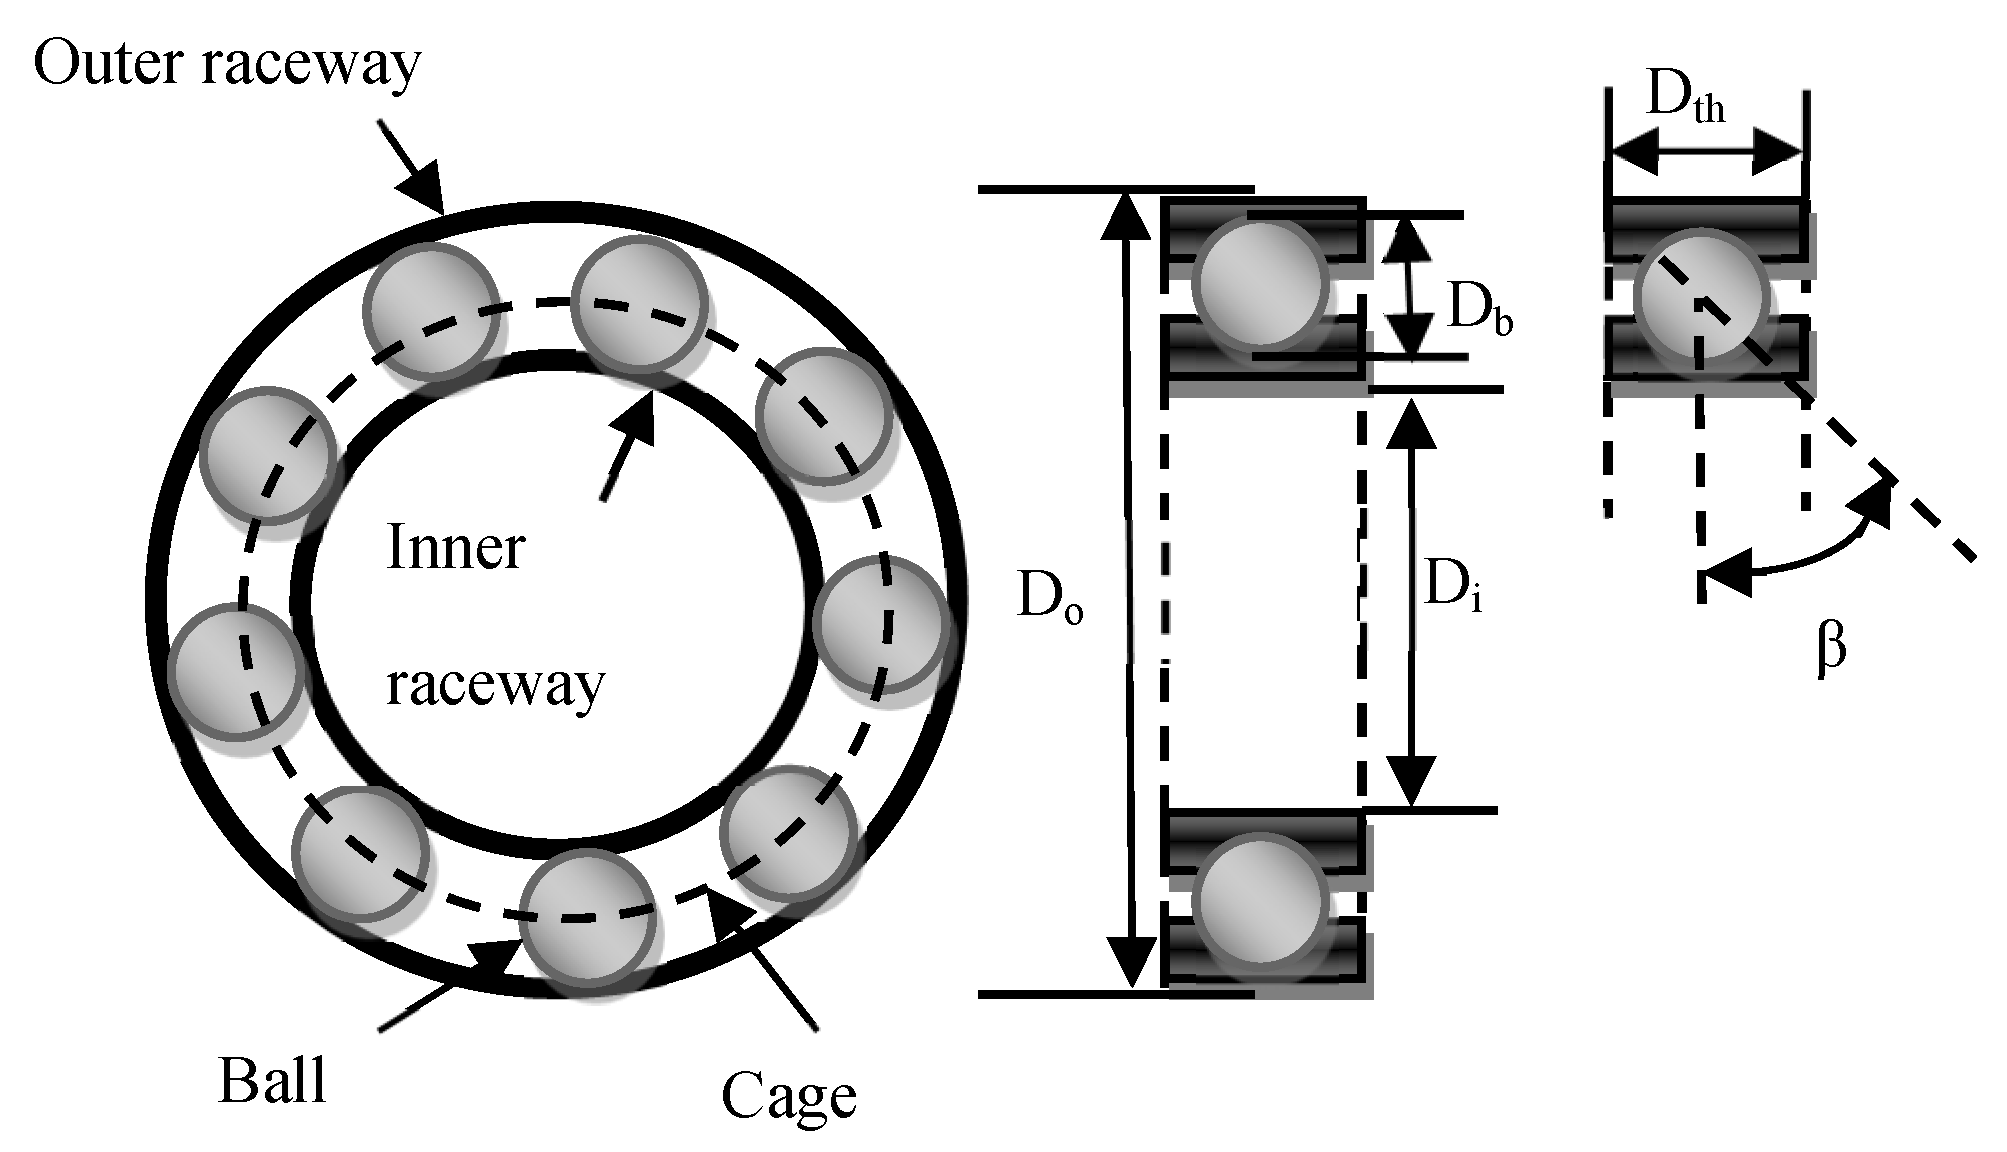
The REB type used in this study has the serial number 6206. It contains ball numbers (
Nb = 9) and diameter (D
b = 9.5 mm). The dimensions of the REB of serial number 6206 are: outer diameter (D
o = 62 mm), inner diameter (D
i = 30 mm), and thickness value (D
th = 16 mm) (see
Figure 2). The inner raceway fault (IRF) was artificially created to study the IM behavior.
3. Motor Current Signature Analysis (MCSA)
According to [
17], the characteristic frequencies of the vibration signal for REBs, which has ball numbers between 6 and 12, can be approximated by:
where
fr is the mechanical rotor frequency given by:
where
s is the rotor slip.
Under REB faults, the spectral stator present includes the following additional harmonic components:
where
is the characteristic frequencies that can be found in the vibration signal spectrum,
ν is the order of the stator time harmonics (
ν = 1, 3, 5, etc.), and
k is an integer.
Therefore, the characteristic frequencies that can be found in the stator current spectrum are:
The IM runs with a nominal load (i.e.,
s = 3.66). In this case and according to Equation (3), the
fr value is 48.167 Hz.
Table 1 summarizes some harmonics in the stator current spectrum caused by the IRF. It provides us a visual representation of the fault’s several harmonics.
The specific frequencies of the mixed rotor eccentricity fault are given by:
where
k = 1, 2, 3, …
It is known that these frequencies exist even in a healthy IM.
We can define the rotor slot harmonics (RSHs) given by:
where
k is an integer. We can also define the saturation frequencies (
fsat) expressed as follows [
18]:
where
k is an odd number.
In all figures below, we will consider that the blue color represents the healthy state of an IM, and the red color represents the inner raceway fault.
Figure 3 presents characteristic frequencies of the IRF with low amplitude: 10, 110.3, 210.1, 270.4 Hz, and so forth. These frequencies verify Equation (5).
The frequency components of the mixed eccentricity fault are:
fs +
fr and
fs + 3
fr. According to
Figure 3, they have the values: 98.3 and 194.9 Hz respectively.
In the frequency band 250–550 Hz, we found the characteristic frequency which has the formula: 5fs − 2fIR. In addition, the Lower Principal Slot Harmonics (L-PSH) and the Upper Principal Slot Harmonics (U-PSH) have the values 1195 and 1395 Hz respectively. They are clearly presented in the stator current spectra.
The distinction states of an IM under an IRF can be seen in the stator current spectra as we can see that the IRF frequencies have low amplitude.
4. Stray Flux Signature Analysis (SFSA)
For the study of rolling bearing faults, the SFSA is proposed as an alternative investigative technique [
19]. It is based on the measurement of stray flux in various locations around the REM.
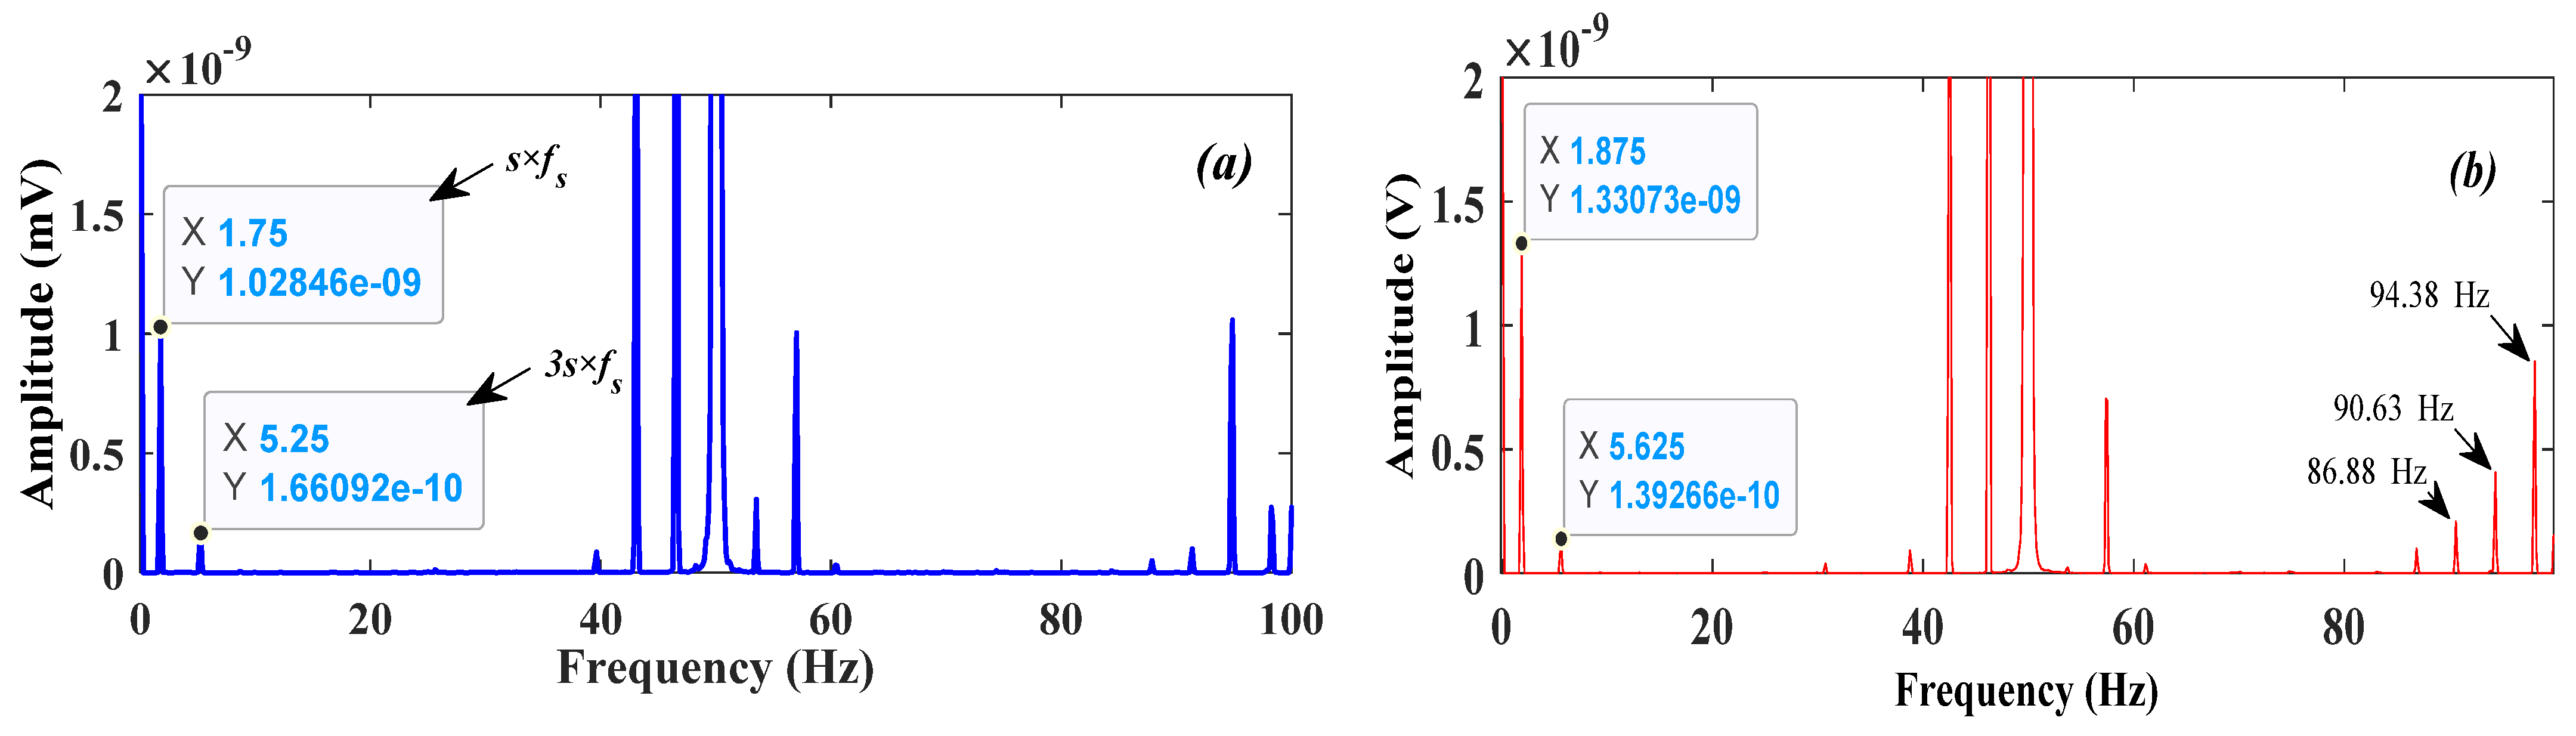
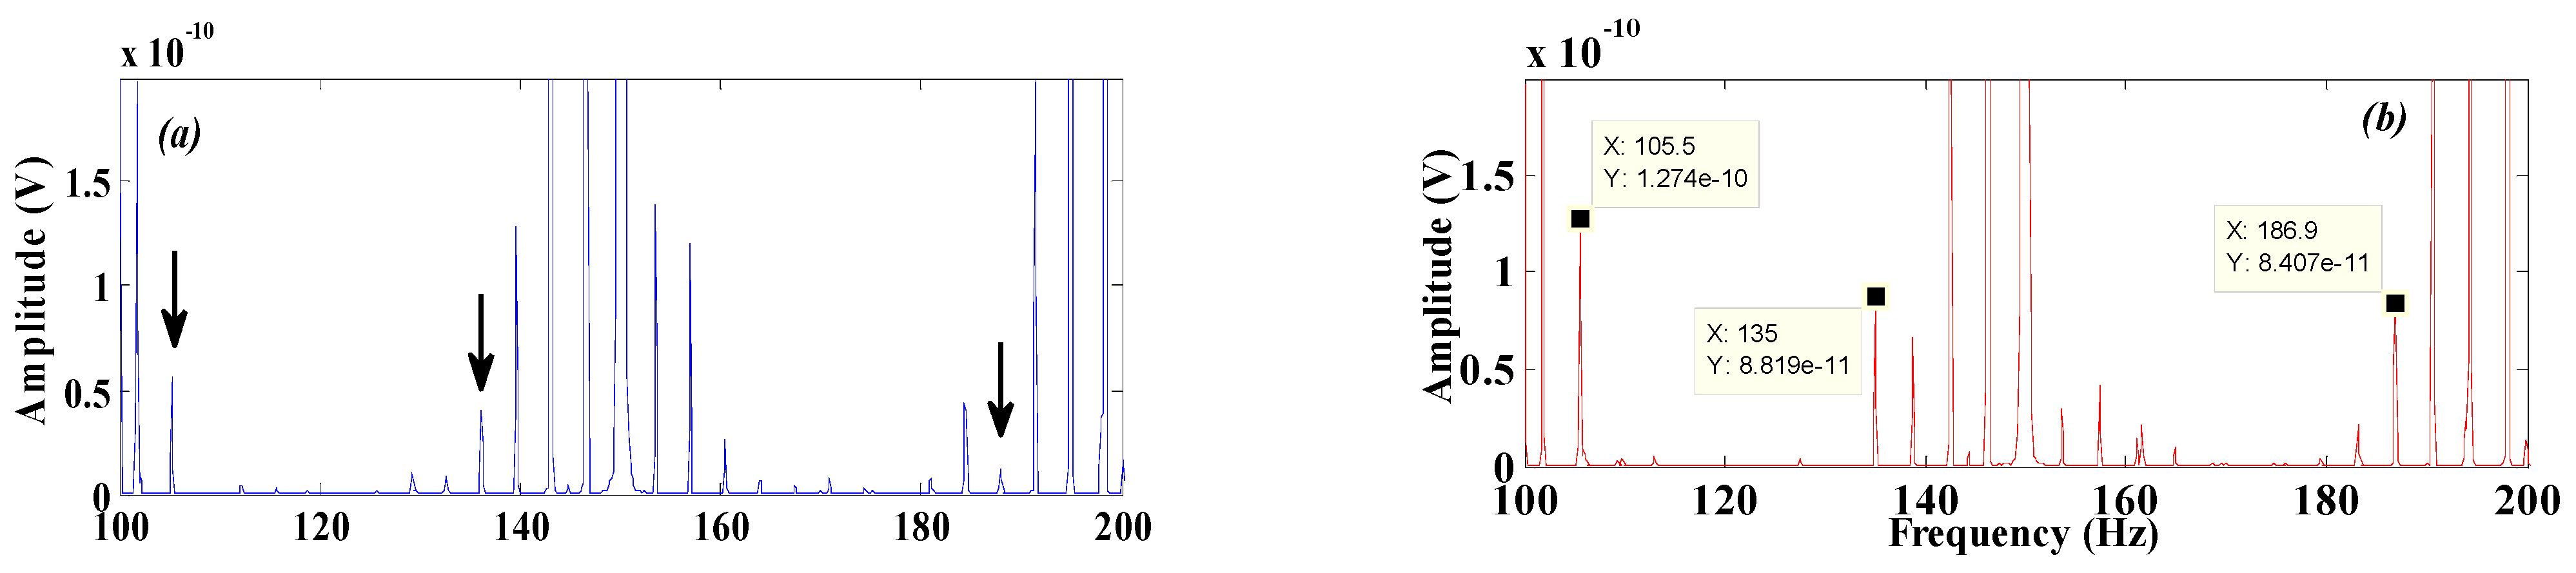
In
Figure 4 and
Figure 5, the evolution of many types of amplitude, such as
s ×
fs and 3
s ×
fs wavelength, can be seen and detected (
s = 0.0366). In addition to
s ×
fs and 3
s ×
fs, the black arrow color represents new harmonics that tend to be inspired by the IRF.
In reality, rotor electrical and mechanical faults, as well as REB faults, have no effect on stator currents; however, they cause rotor eccentricity, which can deform the IM magnetic field’s symmetry. The IRF can be detected in different range frequencies based on the flux spectra, which is determined using the coil sensors.
The analysis of SFSA-FFT allows us to find additional harmonics that appear at the same frequency given by Equation (5), which are fs − fIR and fs + 2fIR.
These values correspond, respectively, at 209.8 H with Amp = 5.29 × 10
−10 V and 569.4 Hz with Amp = 5.5 × 10
−10 V. This confirms the results found in
Table 1 (
fIR = 210.1018 Hz and
fs +
fIR = 570.2036 Hz). In addition, other harmonics due to the mixed eccentricity of the rotor clearly appeared as
fs +
fr = 98.13 Hz,
fs + 2
fr = 146.3 Hz,
fs + 3
fr = 194.3 Hz, and so forth.
It is interesting to note that these new frequencies are the same ones that were discovered in the stator current spectra. When one is the representation of the other, this verifies the relationship between current and flux (see
Figure 6).
Under the pole of the IM, which is equal to 1 (
p = 1) when
sfs =
fs −
fr, we can denote the overlap between the frequencies
sfs and
fs −
fr.
Table 2 shows the amplitude evolutions of certain
fs +
kfr frequencies (3).
Finally, the SFSA-FFT study demonstrated the sensitivity of this technique in detecting the IRF. Furthermore, the amplitude variance of specific flux harmonics is related to current variations, as well as the appearance of certain new harmonics.
5. Transfer Function Estimate Analysis (TFEA)
The proposed method for system identification using a frequency analysis approach is briefly described below, followed by a detailed presentation of the theory. This method starts by finding a rough estimate of the relationship between signals (transfer function). This estimate is then mapped to a magnitude frequency representation. Information that is a physical realization of the system is retained, while information believed to be due to noise is discarded [
20].
Txy = tfestimate(
x,
y) finds a transfer function estimate (TF-estimate), and the input signal vector
x (current or flux) and the output signal vector
y (current or flux) are given to
Txy. The lengths of the vectors
x and
y must be equal. The linear, time-invariant transfer function
Txy models the relationship between input
x and output
y. The quotient of the cross power spectral density (
Pyx) of
x and
y and the power spectral density (
Pxx) of x is the transition function.
If
x is real, tfestimate only estimates the transfer function at positive frequencies; in this case,
Txy is a column vector with lengths of nfft/2 + 1 for nfft even and (nfft + 1)/2 for nfft odd. Tfestimate calculates the transition function for both positive and negative frequencies if
x or
y is complex, and
Txy has length nfft [
21].
This part will try to discuss the transfer function for the following two cases:
- -
Healthy IM: input (flux) and output (current).
- -
Faulty IM: input (flux) and output (current).
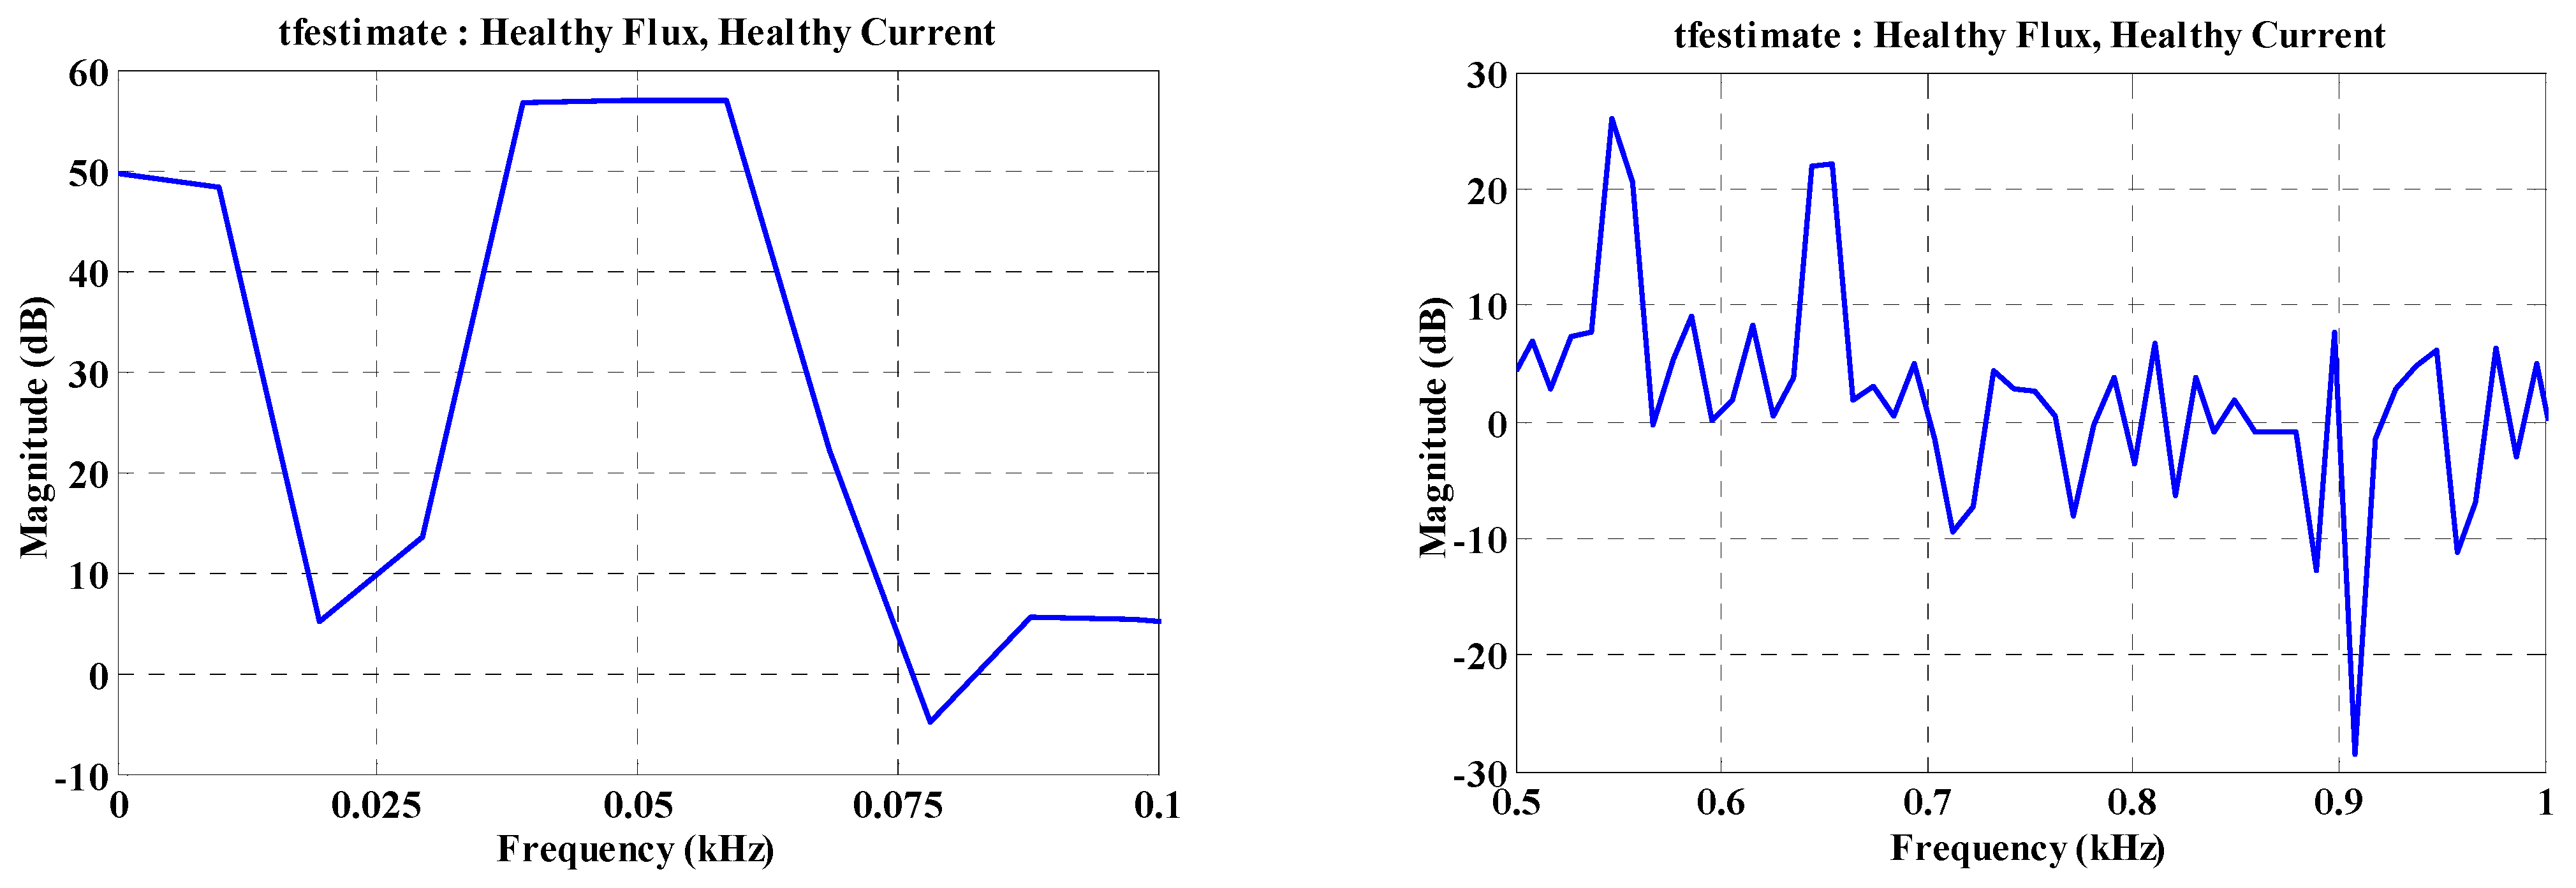
5.1. TF-Estimate for Healthy IM
The transfer function between flux and current for a healthy IM is shown in
Figure 7.
Figure 7 shows the transfer function between two states of the IM. This information can help us to have a decision on the state of the induction machine. In addition, this information is considered as a new data which can exploit it for another analysis.
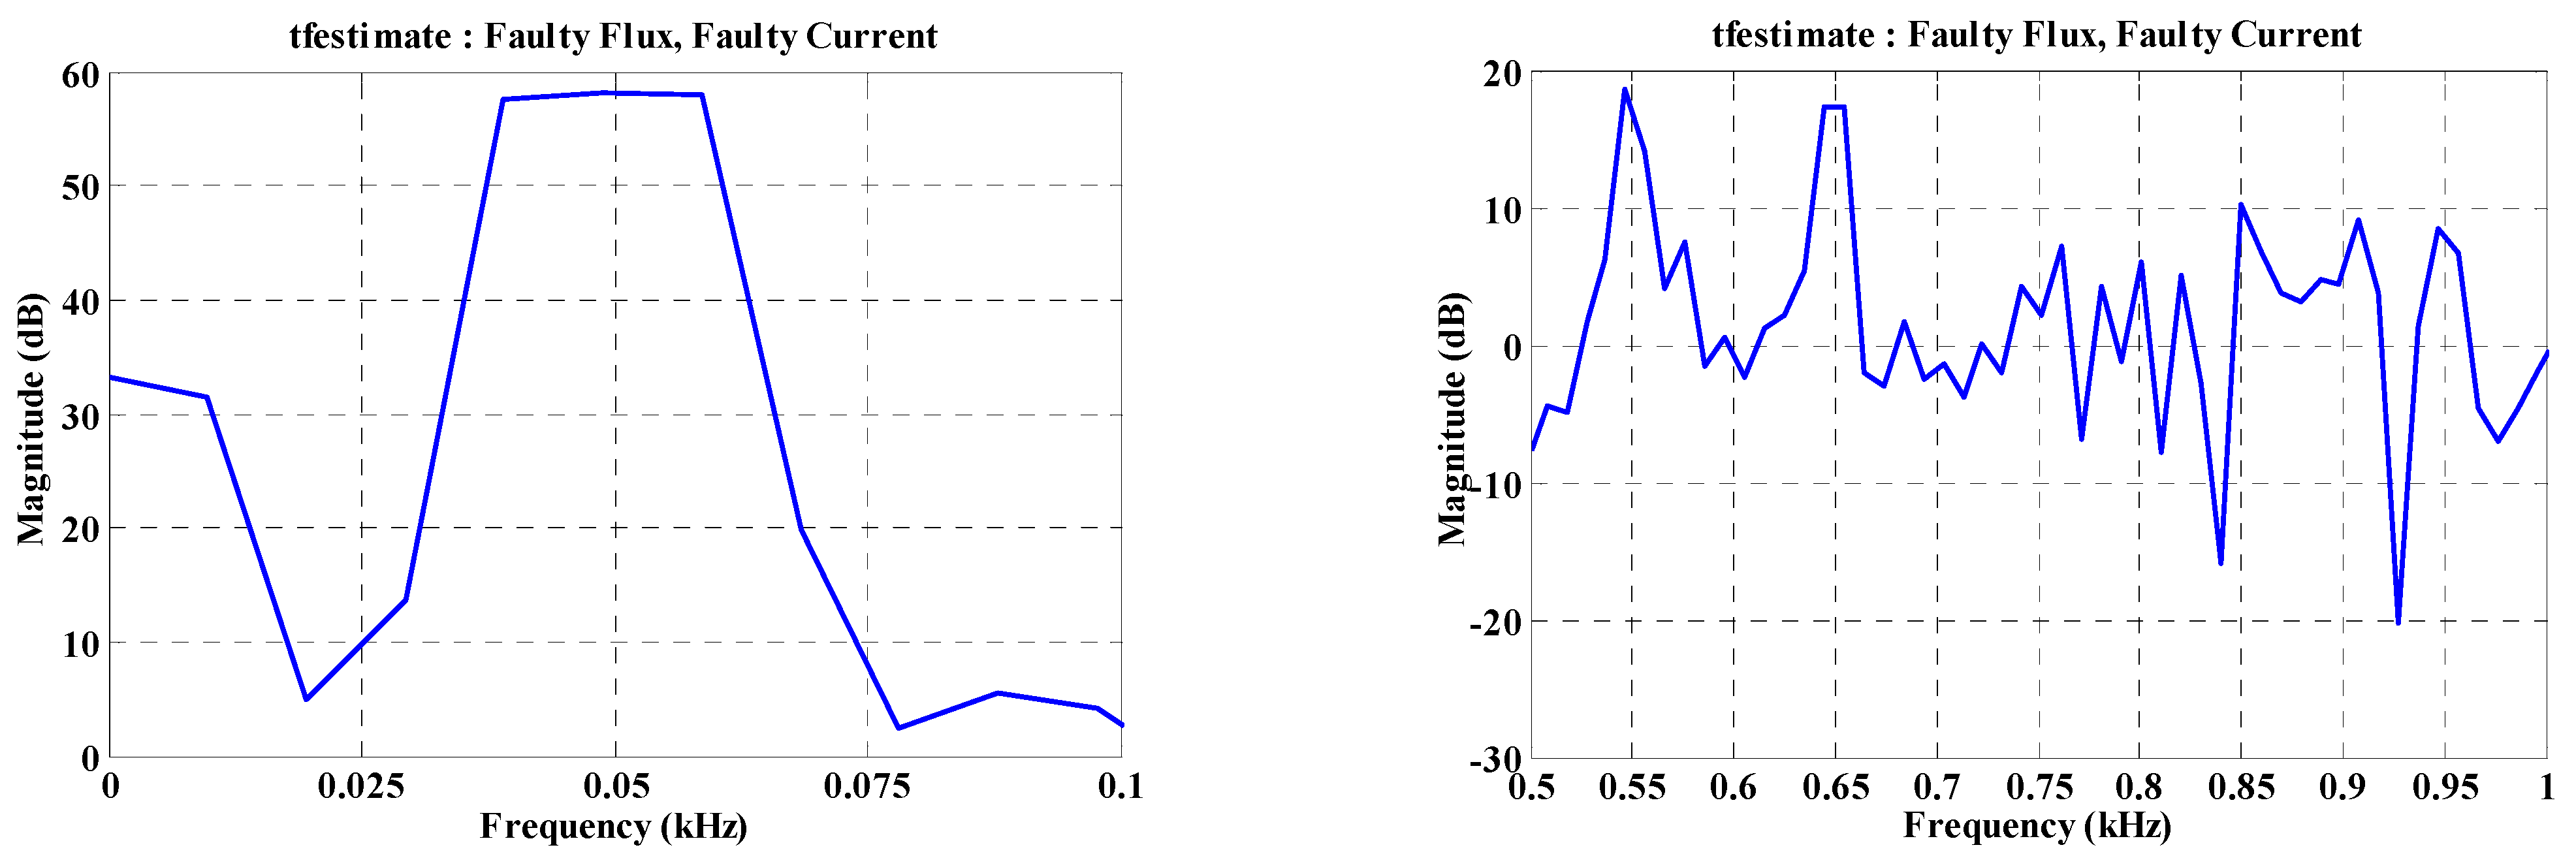
5.2. TF-Estimate for Faulty IM
The results that present the tfestimate between flux and current for a faulty IM is presented in
Figure 8.
The figures above show the transfer function between two signals. These signals can indicate very specific shapes for each fault. The exploitation of the transfer functions obtained can lead us to have a final decision on the state of the induction machine.
6. Mean-Squared Coherence Analysis (MSCA)
Carter and al. [
22] developed the magnitude-squared coherence (mscohere) function, which used the weighted overlapped segmentation fast Fourier transform (FFT) approach.
Using Welch’s averaged modified periodogram form,
Cxy = mscohere(
x,
y) finds the magnitude squared coherence estimate,
Cxy, of the input signals,
x and
y. The magnitude squared coherence approximation is a frequency function with values ranging from 0 to 1, and it shows how well
x relates to
y at each frequency. The magnitude squared coherence of
x and
y is a function of their power spectral densities,
Pxx(
f) and
Pyy(
f), as well as their cross power spectral densities,
Pxy(
f):
The lengths of
x and
y must be equal. Mscohere returns a one-sided coherence approximation for real
x and
y. It returns a two-sided approximation for complex
x or
y [
23].
Therefore, this technique can guide us to check the similarity between the spectra. This allows us to find the frequency zone affected by the fault.
It is important to put the principle of consistency between the signals studied as follows:
- -
Mscohere close to 1: The two signals have the same spectral content (similar).
- -
Mscohere close to 0: The two signals do not have the same spectral content.
Based on this strategy, we can easily define the area or frequency band where the new harmonics exist.
6.1. MS-Cohere for Healthy and Faulty IM (Currents)
First, we compared the current signals for a healthy and a faulty IM. According to
Figure 9 and
Figure 10, the evolution of mscohere is clear. For different frequency bands between 0 and 5 kHz, the similarity of the frequencies corresponds to the similarity studied in the analysis of the current and the flux. The values of mscohere direct us directly to the affected frequency band.
It is clear that in certain frequency bands, the signals have the same spectral content. This indicates that this information can be used to analyze the affected bands.
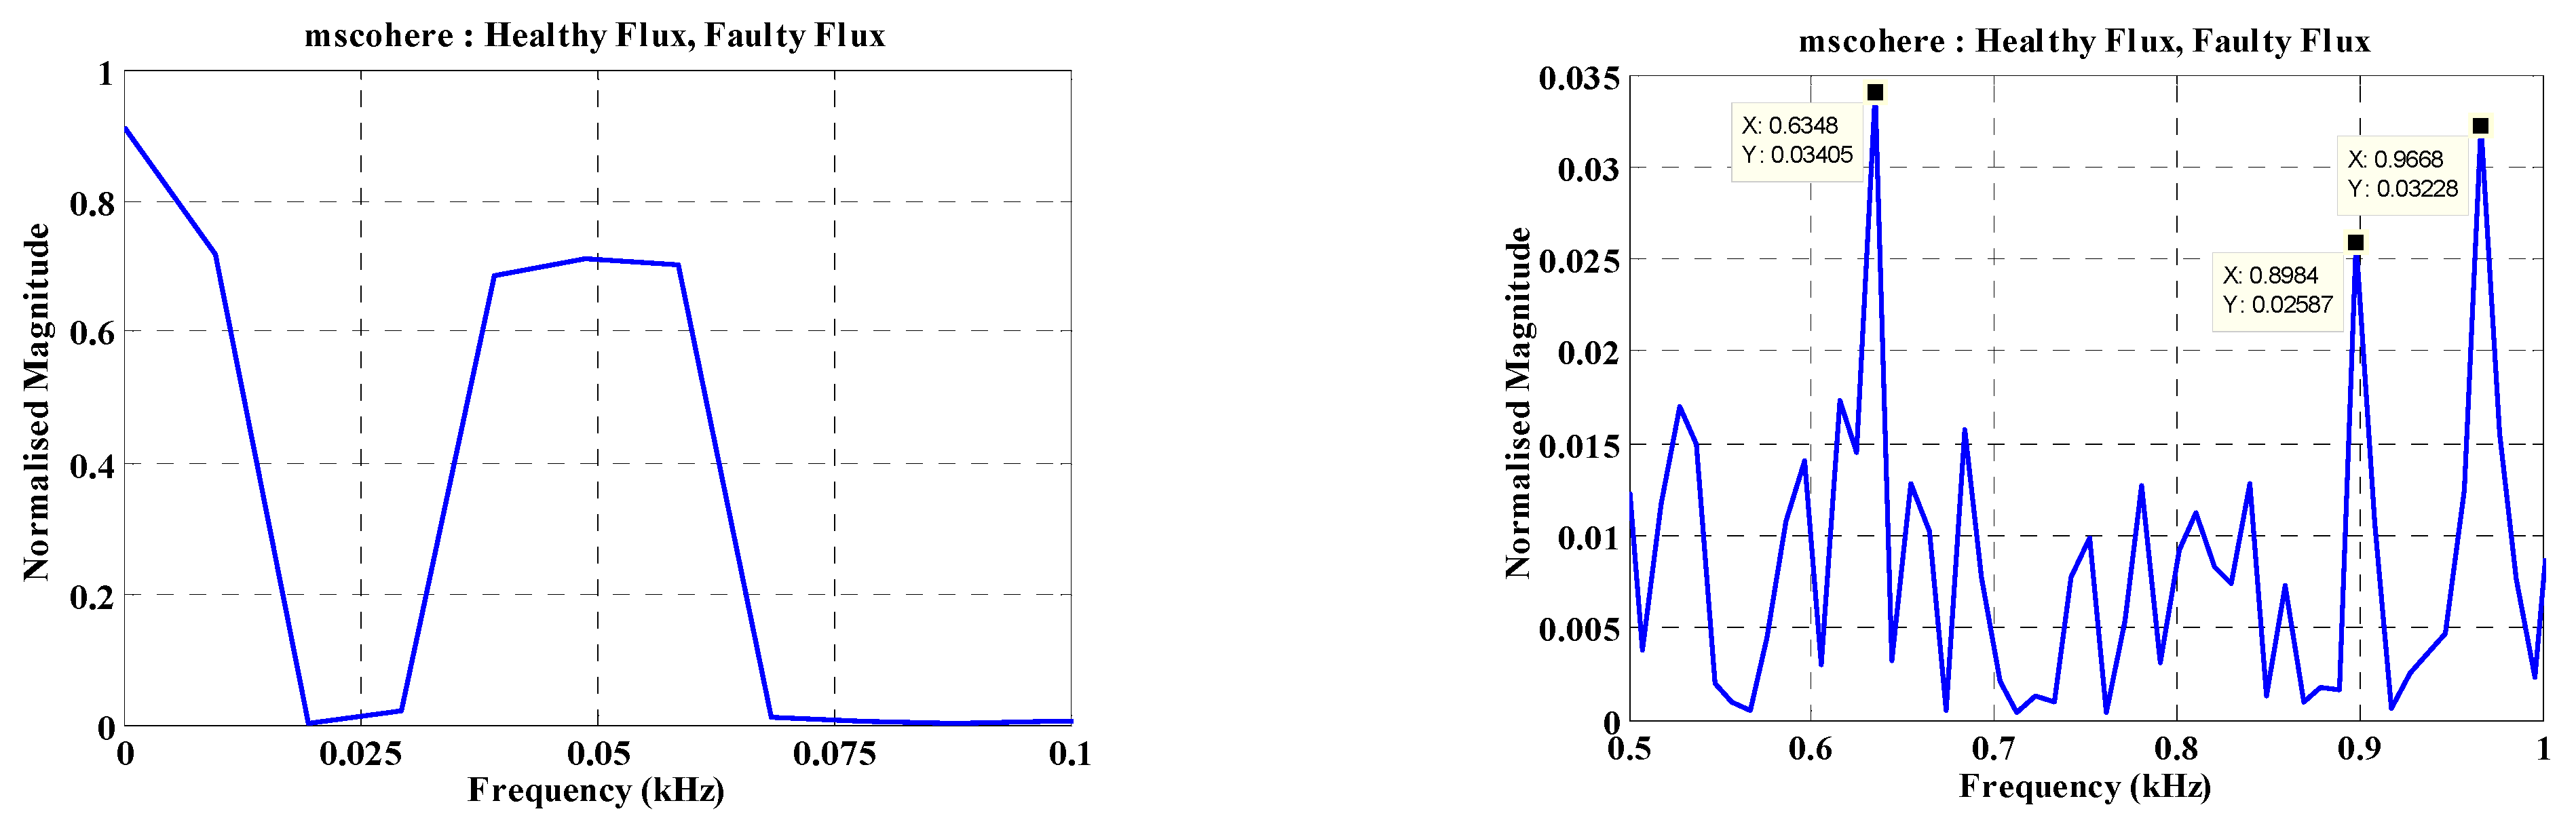
6.2. MS-Cohere for Healthy and Faulty IM (Flux)
The results that compare two flux signals under a healthy and a faulty IM can be presented in
Figure 10.
The evolution of the value of mscohere is between 0 and 1; the affected frequency band is clearly defined.
The advantages of this new proposal are to have a significant signal which can help us to detect the fault.
It is clear that in certain frequency bands, the signals have the same spectral content. In addition, all values close to 1 indicate the similarity in spectral content between the two signals. This information can help us to have a decision on the state of the induction machine.
7. Conclusions
The use of MCSA-FFT and SFSA-FFT to detect rolling element bearing faults in an IM is compared in this paper.
In summary, the MCSA-FFT analysis did not reveal any significant amplitude variation of mixed eccentricity or specific IRF frequencies in the stator current spectrum.
Stray flux signature analysis sensitive to the REB gave good information on the IRF. The use of SFSA-FFT in combination with at least one of the conventional techniques can be an advantageous method for increasing the reliability of the diagnosis.
The proposal of tfestimate in the diagnosis field of rotating electrical machines opens the door to have a relationship between signals. On the other hand, the transfer function can give important information on the behavior of the signals used.
We introduce a new indicator based on mscohere, which aims at characterizing a specific frequency band of the characteristic frequencies. This feature allows us to directly analyze the affected band frequency.
Author Contributions
Conceptualization, R.P.; methodology, R.R., N.B. and S.S.; validation, R.P., R.R. and N.B.; investigation, R.P., R.R., N.B. and S.S.; resources, R.P., R.R. and N.B.; data curation, R.P., N.B. and R.R.; writing—original draft preparation, R.P., N.B. and R.R.; writing—review and editing, R.R., R.P. and N.B.; visualization, R.R., R.P. and N.B.; supervision, R.R., R.P., N.B., S.S. and R.B. All authors have read and agreed to the published version of the manuscript.
Funding
Financial support from “Laboratory of Electrotechnical and Environmental Systems (EA-4025), Technology, University of Artois, F-62400 Béthune, France”.
Institutional Review Board Statement
Not applicable.
Informed Consent Statement
Not applicable.
Data Availability Statement
Not applicable.
Acknowledgments
The technical and human support provided by Laboratory of Electrotechnical and Environmental Systems is gratefully acknowledged.
Conflicts of Interest
The authors declare no conflict of interest.
References
- Bessous, N. Reliability Surveys of Fault Distributions in Rotating Electrical Machines: –Case Study of Fault Detections in IMs–. In Proceedings of the 2020 1st International Conference on Communications, Control Systems and Signal Processing (CCSSP), El Oued, Algeria, 16–17 May 2020; pp. 535–543. [Google Scholar]
- Huang, X.; Wen, G.; Dong, S.; Zhou, H.; Lei, Z.; Zhang, Z.; Chen, X. Memory Residual Regression Autoencoder for Bearing Fault Detection. IEEE Trans. Instrum. Meas. 2021, 70, 3515512. [Google Scholar] [CrossRef]
- Duan, N.; Wang, J.; Zhao, T.; Du, W.; Guo, X.; Wang, J. Novel Adaptive Fault Diagnosis Method for Wind Power Gearbox. IEEE Access 2021, 9, 11226–11240. [Google Scholar] [CrossRef]
- Bessous, N.; Pusca, R.; Romary, R.; Sbaa, S. Rolling Bearing Failure Detection in Induction Motors using Stator Current, Vibration and Stray Flux Analysis Techniques. In Proceedings of the IECON 2020 The 46th Annual Conference of the IEEE Industrial Electronics Society, Singapore, 18–21 October 2020; pp. 1088–1095. [Google Scholar]
- Puche-Panadero, R.; Martinez-Roman, J.; Sapena-Bano, A.; Burriel-Valencia, J.; Pineda-Sanchez, M.; Perez-Cruz, J.; Riera-Guasp, M. New Method for Spectral Leakage Reduction in the FFT of Stator Currents: Application to the Diagnosis of Bar Breakages in Cage Motors Working at Very Low Slip. IEEE Trans. Instrum. Meas. 2021, 70, 3511111. [Google Scholar] [CrossRef]
- Capolino, G.A.; Romary, R.; Hénao, H.; Pusca, R. State of the art on stray flux analysis in faulted electrical machines. In Proceedings of the IEEE Workshop on Electrical Machines Design, Control and Diagnosis (WEMDCD), Athens, Greece, 22–23 April 2019; Volume 1, pp. 181–187. [Google Scholar]
- Gyftakis, K.N.; Panagiotou, P.A.; Lee, S.B. The role of the mechanical speed frequency on the induction motor fault detection via the stray flux. In Proceedings of the IEEE 12th International Symposium on Diagnostics for Electrical Machines, Power Electronics and Drives (SDEMPED), Toulouse, France, 27–30 August 2019; pp. 201–207. [Google Scholar]
- Samanta, A.K.; Routray, A.; Khare, S.R.; Naha, A. Minimum Distance-Based Detection of Incipient Induction Motor Faults Using Rayleigh Quotient Spectrum of Conditioned Vibration Signal. IEEE Trans. Instrum. Meas. 2021, 70, 3508311. [Google Scholar] [CrossRef]
- Chirindo, M.; Khan, M.; Barendse, P. Analysis of Non-Intrusive Rotor Speed Estimation Techniques for Inverter-Fed Induction Motors. IEEE Trans. Energy Convers. 2020, 36, 338–347. [Google Scholar] [CrossRef]
- Liu, Z.; Zheng, Z.; Li, Y. Enhancing fault-tolerant ability of a nine-phase induction motor drive system using fuzzy logic current controllers. IEEE Trans. Energy Convers. 2017, 32, 759–769. [Google Scholar] [CrossRef]
- Guo, S.; Yang, T.; Gao, W.; Zhang, C.; Zhang, Y. An intelligent fault diagnosis method for bearings with variable rotating speed based on pythagorean spatial pyramid pooling CNN. Sensors 2018, 18, 3857. [Google Scholar] [CrossRef] [PubMed] [Green Version]
- Khodja, A.Y.; Guersi, N.; Saadi, M.N.; Boutasseta, N. Rolling element bearing fault diagnosis for rotating machinery using vibration spectrum imaging and convolutional neural networks. Int. J. Adv. Manuf. Technol. 2020, 106, 1737–1751. [Google Scholar] [CrossRef]
- Ding, J.; Xiao, D.; Li, X. Gear fault diagnosis based on genetic mutation particle swarm optimization VMD and probabilistic neural network algorithm. IEEE Access 2020, 8, 18456–18474. [Google Scholar] [CrossRef]
- Lamim Filho, P.C.; Rabelo, L.M.; Batista, F.B.; Araújo, A.C. Orbit Analysis from a Stray Flux Full Spectrum for Induction Machine Fault Detection. IEEE Sens. J. 2021, 21, 16152–16161. [Google Scholar] [CrossRef]
- Pusca, R.; Romary, R.; Bessous, N.; Sbaa, S. Comparative Study between Two Diagnostic Techniques Dedicated to the Mechanical Fault Detection in Induction Motors. In Proceedings of the 2020 International Conference on Electrical Engineering (ICEE), Istanbul, Turkey, 25–27 September 2020; pp. 1–8. [Google Scholar]
- Park, Y.; Choi, H.; Lee, S.B.; Gyftakis, K.N. Search Coil-Based Detection of Nonadjacent Rotor Bar Damage in Squirrel Cage Induction Motors. IEEE Trans. Ind. Appl. 2020, 56, 4748–4757. [Google Scholar] [CrossRef]
- Schoen, R.R.; Habetler, T.G.; Kamran, F.; Bartheld, R.G. Motor bearing damage detection using stator current monitoring. IEEE Trans. Ind. Appl. 1995, 31, 1274–1279. [Google Scholar] [CrossRef]
- Bessous, N.; Sbaa, S.; Toumi, A. A detailed study of the spectral content in the stator current of asynchronous machines under broken rotor bar faults using MCSA technique. In Proceedings of the IEEE International Conference on Control Engineering & Information Technology (CEIT), Istanbul, Turkey, 25–27 October 2018; pp. 1–8. [Google Scholar]
- Frosini, L.; Minervini, M.; Ciceri, L.; Albini, A. Multiple faults detection in low voltage inverter-fed induction motors. In Proceedings of the 2019 IEEE 12th International Symposium on Diagnostics for Electrical Machines, Power Electronics and Drives (SDEMPED), Toulouse, France, 27–30 August 2019. [Google Scholar]
- Ilvedson, C.R. Transfer Function Estimation Using Time-Frequency Analysis. Doctoral Dissertation, Massachusetts Institute of Technology, Cambridge, MA, USA, 1998. [Google Scholar]
- Soysal, A.O.; Semlyen, A. Practical transfer function estimation and its application to wide frequency range representation of transformers. IEEE Trans. Power Deliv. 1993, 8, 1627–1637. [Google Scholar] [CrossRef] [Green Version]
- Carter, G.; Knapp, C.; Nuttall, A. Estimation of the magnitude-squared coherence function via overlapped fast Fourier transform processing. IEEE Trans. Audio Electroacoust. 1973, 21, 337–344. [Google Scholar] [CrossRef] [Green Version]
- Sassaroli, A.; Tgavalekos, K.; Fantini, S. The meaning of “coherent” and its quantification in coherent hemodynamics spectroscopy. J. Innov. Opt. Health Sci. 2018, 11, 1850036. [Google Scholar] [CrossRef] [PubMed]
| Publisher’s Note: MDPI stays neutral with regard to jurisdictional claims in published maps and institutional affiliations. |
© 2022 by the authors. Licensee MDPI, Basel, Switzerland. This article is an open access article distributed under the terms and conditions of the Creative Commons Attribution (CC BY) license (https://creativecommons.org/licenses/by/4.0/).


