1. Introduction
Automatic Dependent Surveillance-Broadcast is one of the most adopted surveillance technologies in air traffic management. It increases information update rate, reduces costs, and increases observation accuracy compared to classical radar surveillance [
1]. However, ADS-B lacks the necessary inherent integrity to check mechanisms. The system is vulnerable to multiple radio frequency attacks by malicious parties. In the current ADS-B protocol, no feasible mechanisms have been implemented for verifying the integrity of navigation parameters [
2]. Multiple studies have mapped the vulnerabilities and proposed and developed technical mitigation techniques. However, to become part of the ADS-B protocol and global standard, these techniques have yet to prove their effectiveness.
The main objective of this paper is to propose a cost-effective solution using coherent receivers (KerberosSDR) to improve the security and integrity of raw ADS-B signals. Our goal is to mitigate the security drawbacks of the ADS-B protocol by exploring the characteristics of low-level signals. Among different potential ADS-B attacks, our research focuses on the mitigation of malicious message injection (including signal rebroadcast), which is considered one of the hardest ADS-B attacks to detect.
We first develop two methods in which the direction of aircraft arrivals (azimuth angles) are independently determined using a multi-channel coherent ADS-B receiver. Specifically, the direction of arrival is calculated based on position information claimed by aircraft, as well as multi-channel raw signals. We also design real-life experiments of signal injection tests to evaluate our proposed approach.
2. Methodology
In this study, a low-cost multi-channel coherent receiver is used to validate the integrity of ADS-B messages. The principle is based on determining the direction of signal sources (azimuth angles) using a receiver with coherent inputs [
3].
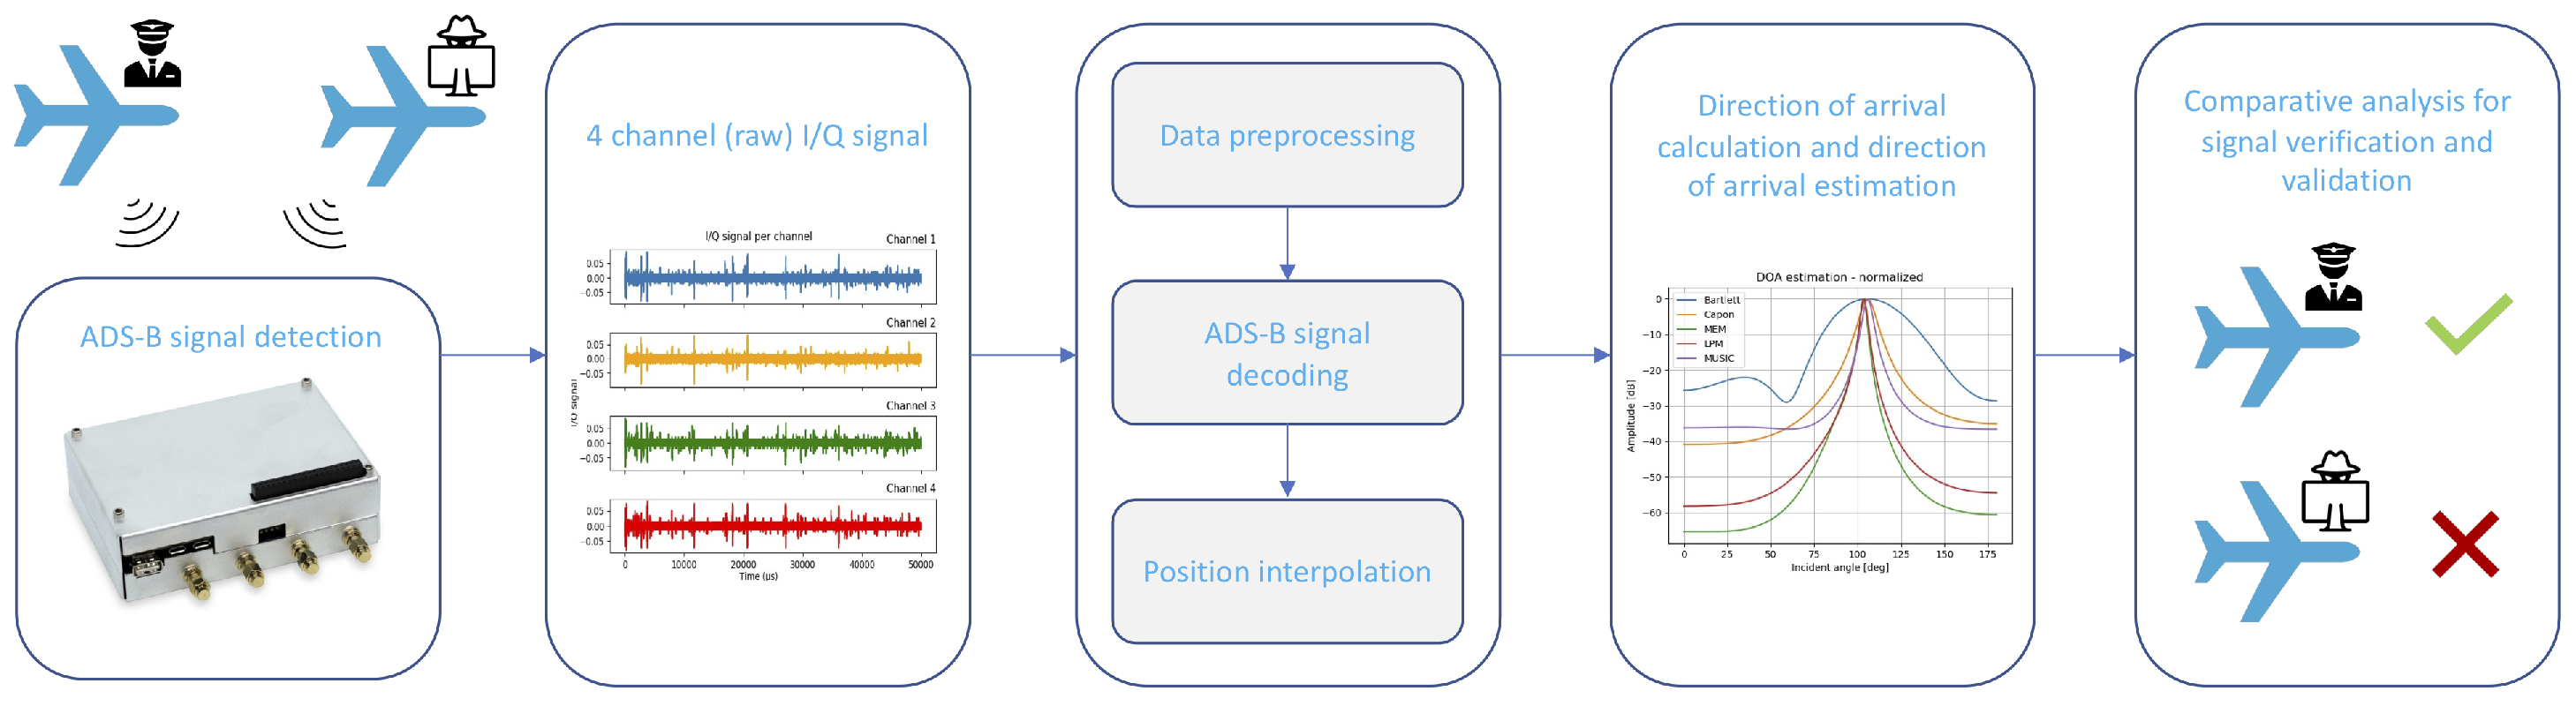
Figure 1 shows an overview of the research. It illustrates the process of signal receiving (including potential maliciously injected signals), ADS-B decoding [
4], the direction of arrival estimation, and integrity verification.
2.1. Antenna Array Setup
Two antenna setups are tested in this study in order to examine the performance of the direction of arrival analysis. They include uniform linear array (ULA) and uniform circular array (UCA).
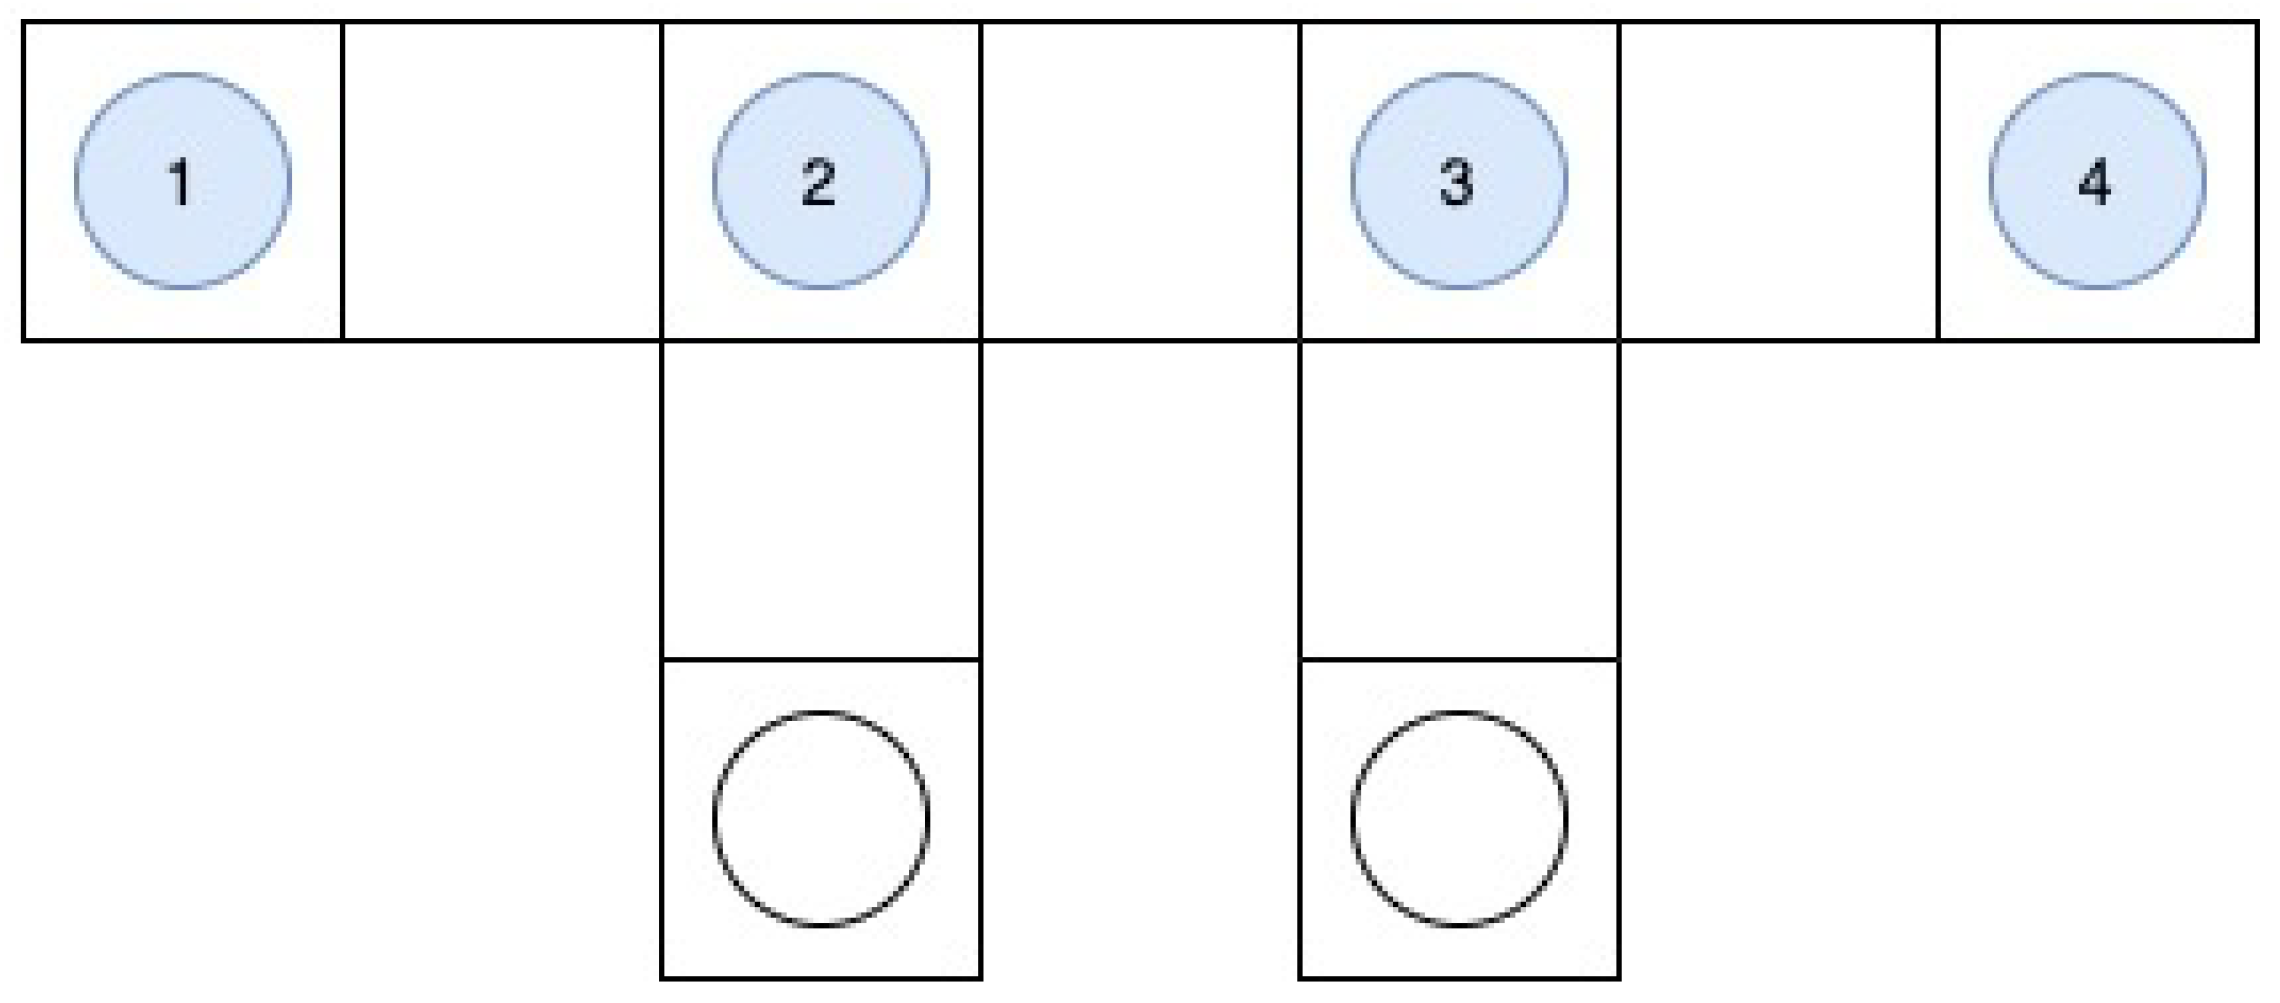
The ULA setup contains four omnidirectional antennas placed in a straight line in an equidistant manner. In
Figure 2, a schematic overview of the setup is shown, where the inter-element spacing (
d) can be determined by
. Here,
is the frequency wavelength, and
s is the interelement spacing factor. In order to avoid ambiguities, the possible calculation of multiple directions,
, is used. The ULA setup enables an estimation of the one-dimensional direction of arrival. This means the azimuth or altitude angle of the signal source relative to the antenna’s position can be estimated.
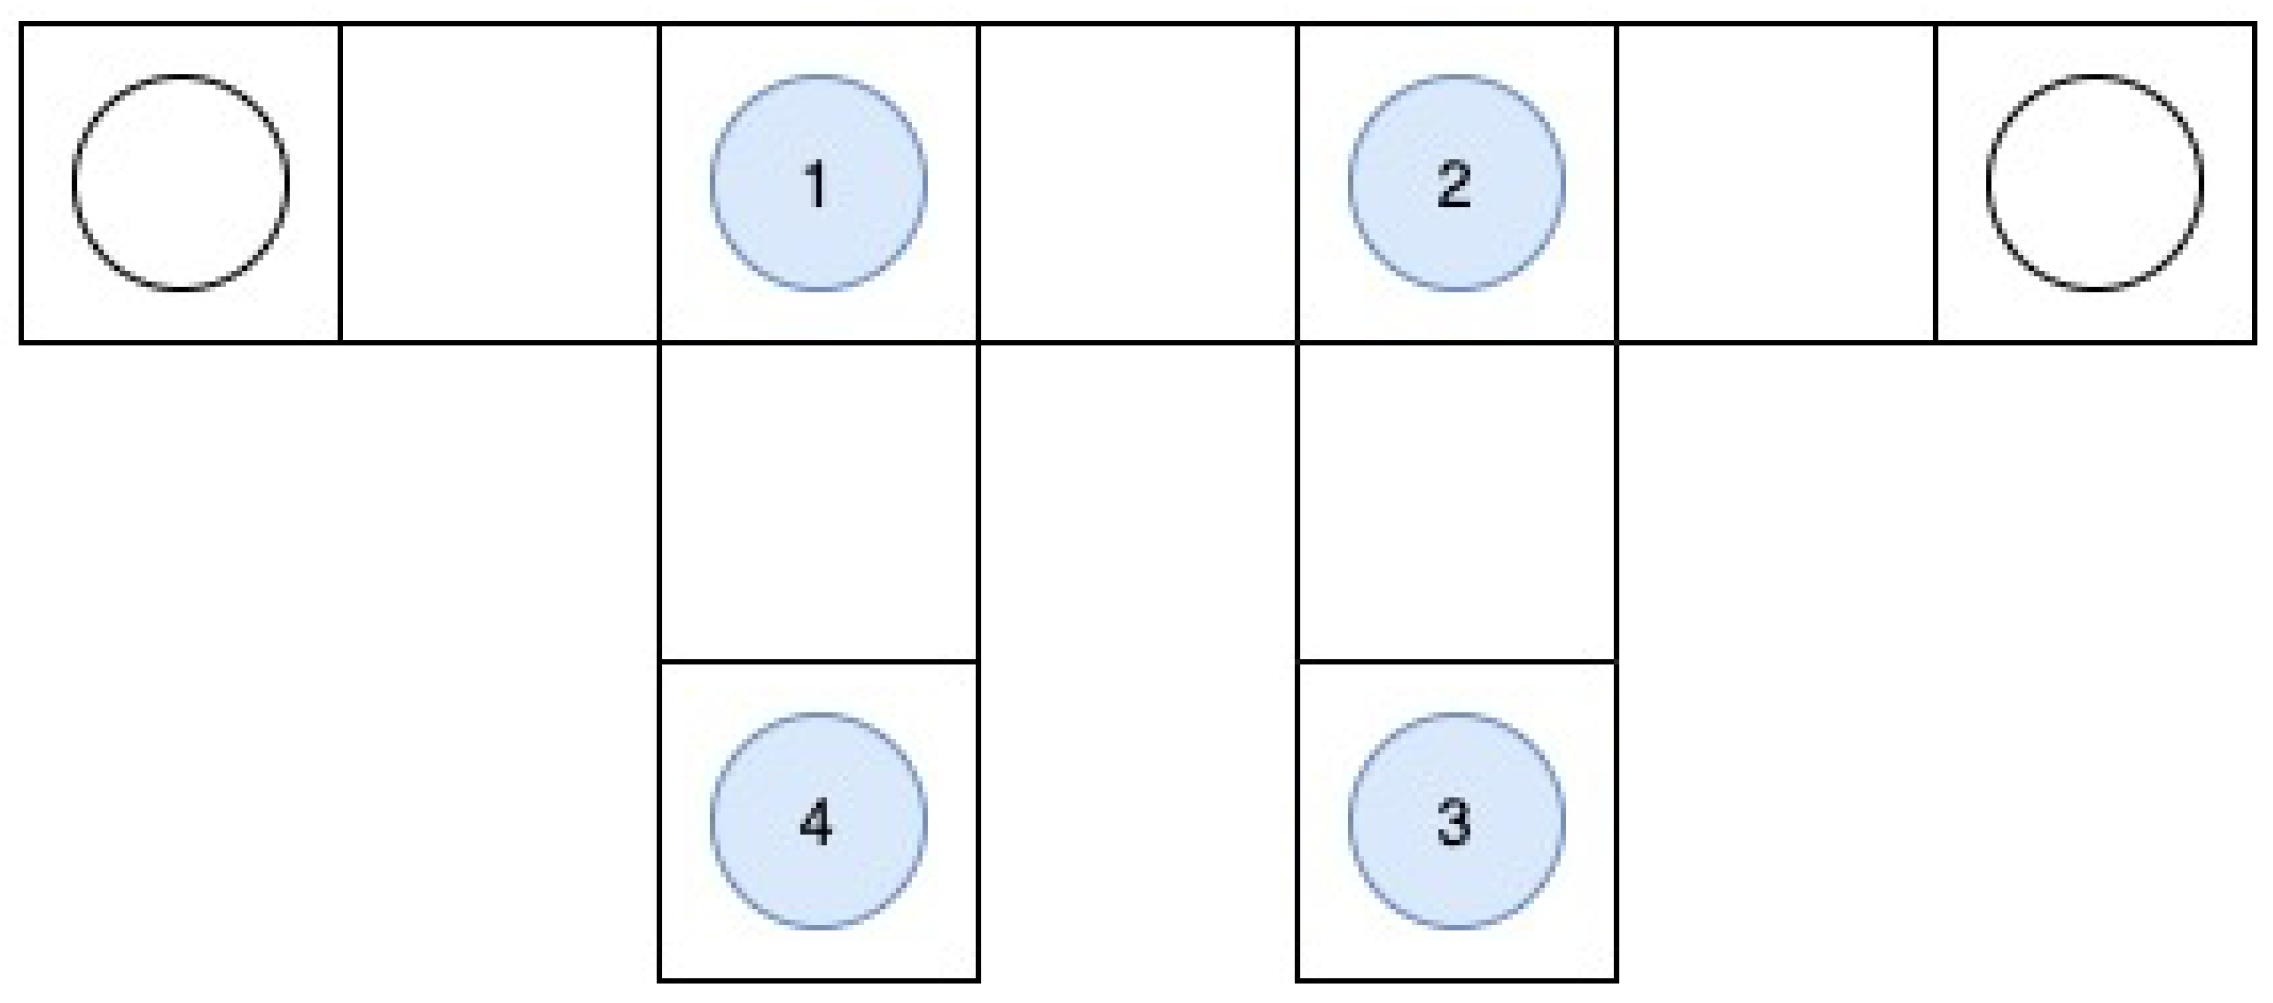
The UCA setup contains four omnidirectional antennas placed in a circular setup. In
Figure 3, a schematic overview of the setup is shown. Similarly to the ULA setup, interelement spacing (
d) can be determined by
, with the same restrictions as ULA for the interelement spacing factor
s to avoid ambiguities. In addition, the UCA setup enables the three-dimensional direction of arrival estimation.
ULA has two disadvantages. It cannot determine whether the signal transmitter is coming from the front or behind of the setup, and the setup only allows azimuth DOA estimation under the assumption that the signal comes at the horizon. Therefore, the ULA setup does not work for aircraft in the nearby vicinity. UCA also has its own disadvantage, which includes being more vulnerable to multipath effects when compared to ULA [
5]. By locating the antenna setup on the roof of a high building, an attempt was made to prevent possible multipath effects as much as possible.
2.2. Signal Processing and Analysis
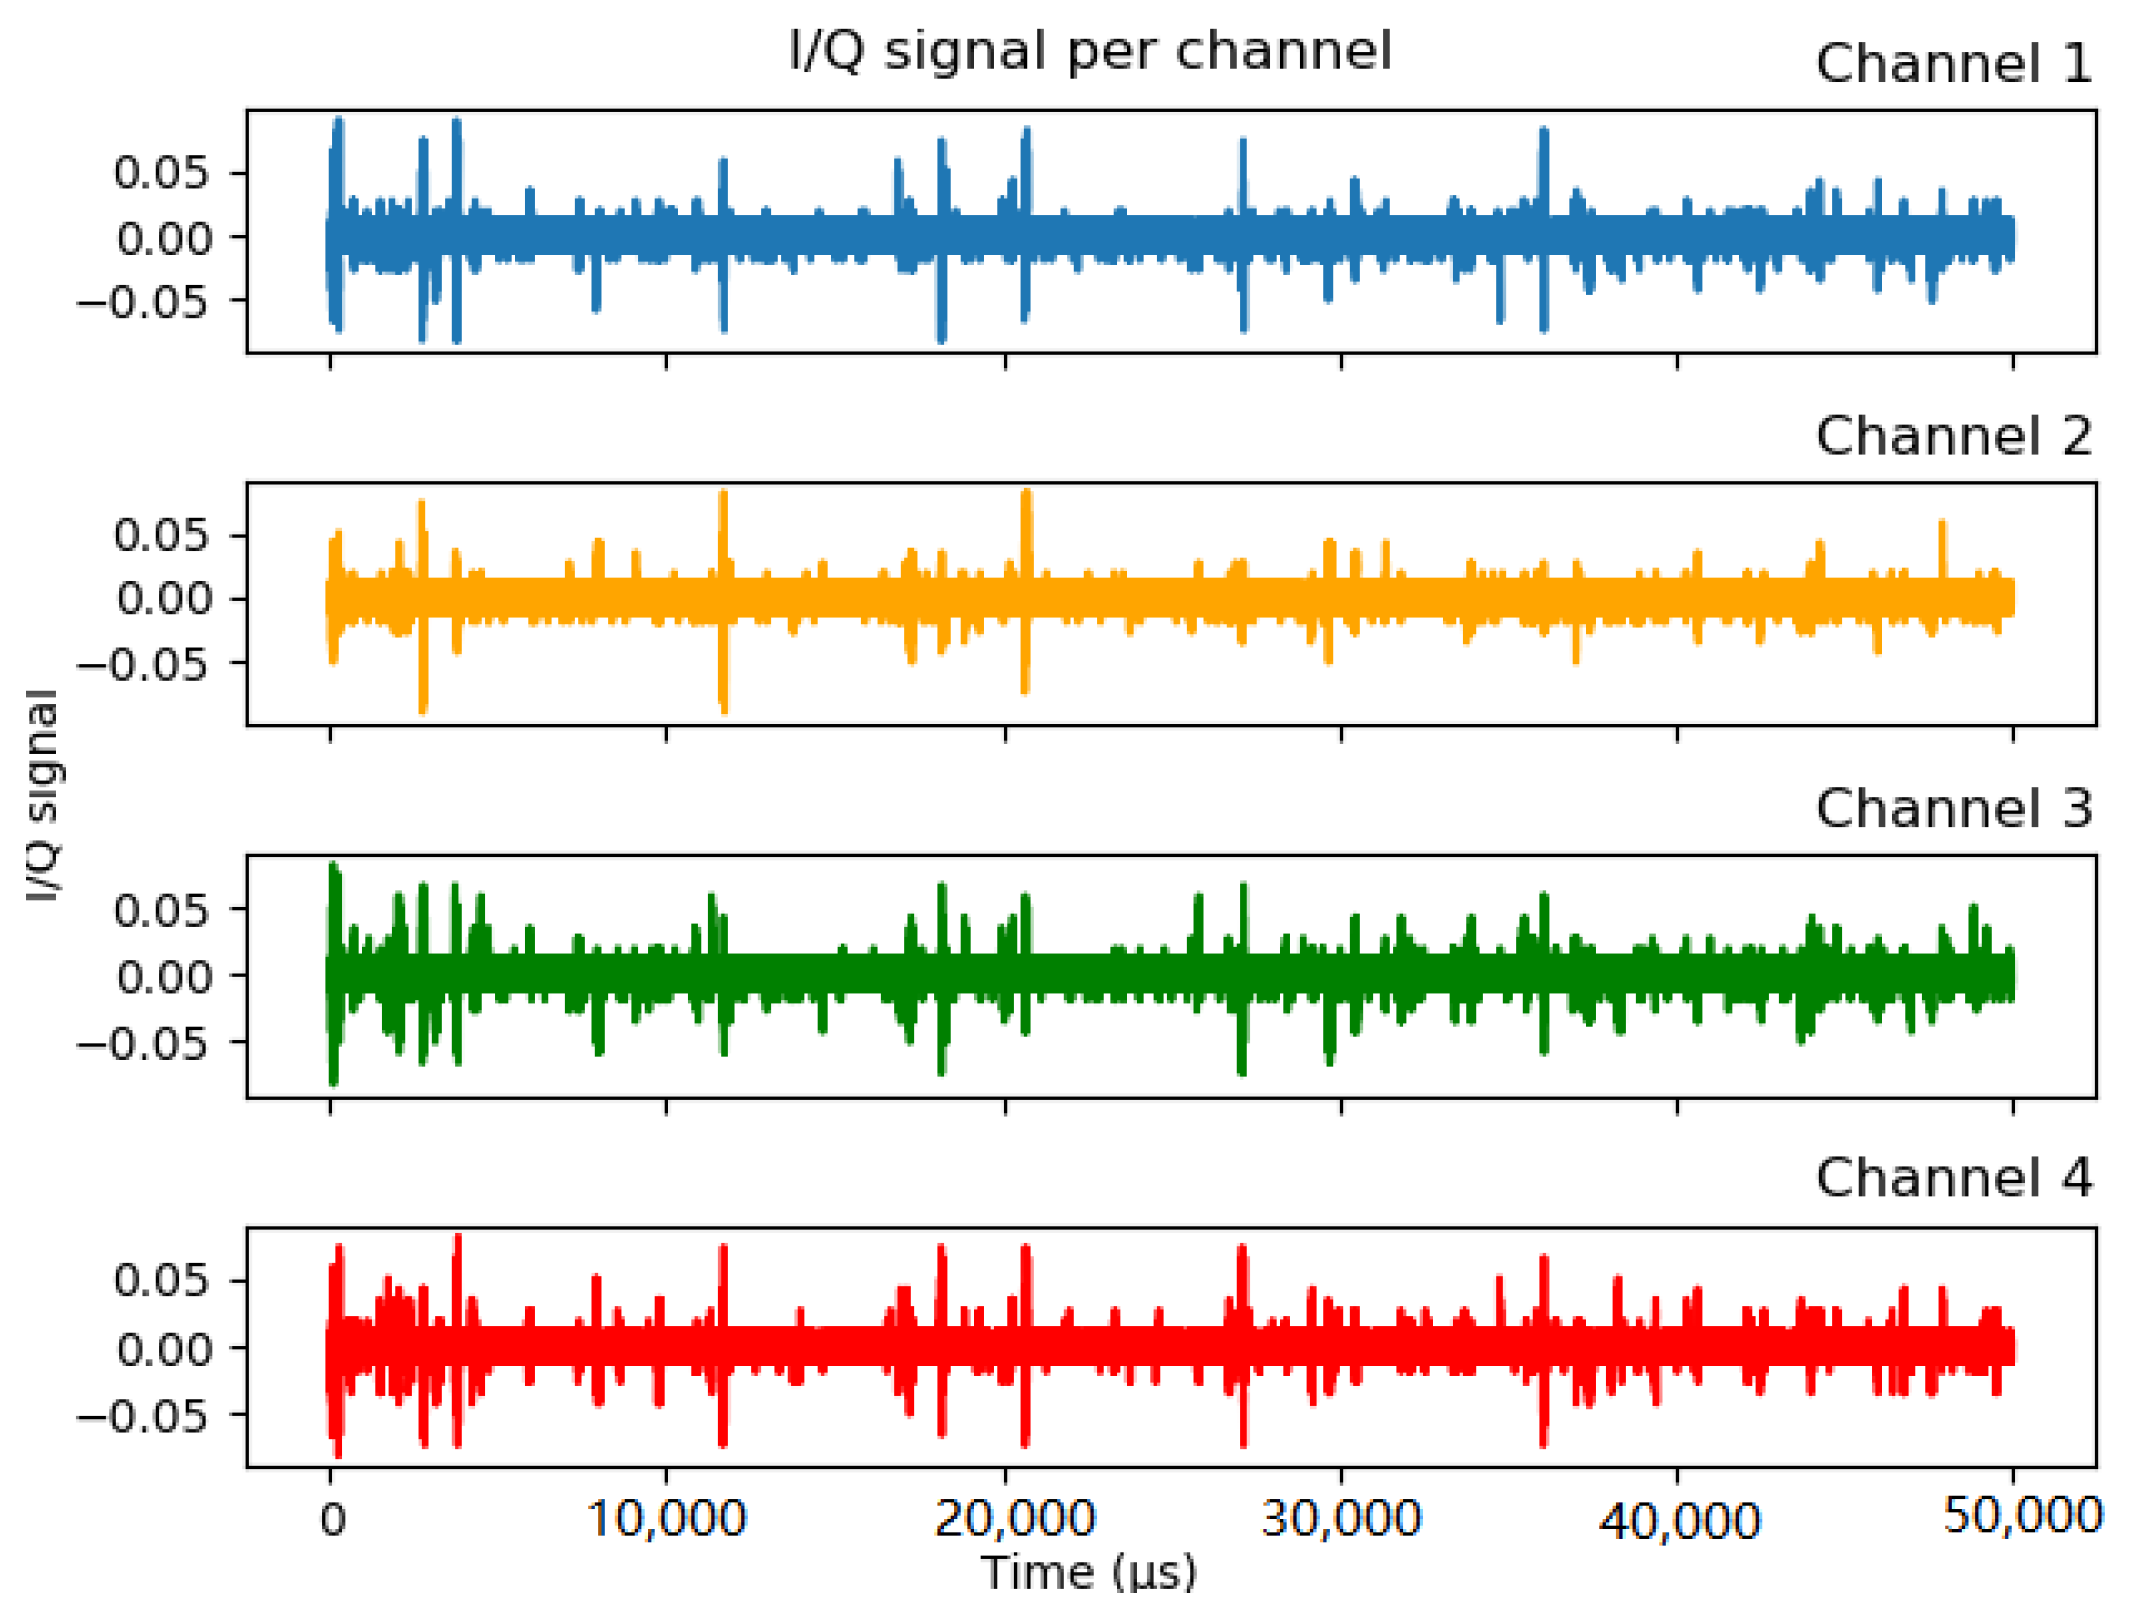
Using the four-channel coherent SDR, the in-phase and quadrature (I/Q) dataset was generated, which is be used for further decoding and signal properties analysis.
Figure 4 illustrates a sample of incoming I/Q signals at different channels. I/Q signals can be conveniently converted to amplitude and phase of the signal. By using a noise source, the clock of the four channels is synchronized.
2.3. Signal Decoding and Position Interpolation
In this study, pyModeS [
4] was used to process the I/Q dataset and decode ADS-B messages. Specifically, the identification, velocity, and position messages are decoded. Based on the positions of the aircraft and the antenna, the aircraft azimuth angle in reference to our receiver can be determined. Since only position messages provide position information to calculate DOA, we also employ a kinematic path interpolation approach [
6] to calculate the position of other types of Mode S messages, based on the time and velocity of the aircraft. In order to define the actual flight path, two-dimensional kinetic motions in one time step are used in the form of position
, velocity
, and timestamps of incoming messages. The following Equations (
1)–(
3) are used to solve the actual flight path.
An example of such an interpolation for one flight is shown in
Figure 5. The green dots are the received position messages, and the blue dots are the calculated positions of the other incoming signals from the same aircraft. These positions are used to calculate the azimuth angle between the aircraft and receiver.
2.4. Direction of Arrival Calculation
In order to calculate the aircraft azimuth angle from the claimed position in the ADS-B position message, Equation (
4) is used.
is the direction of arrival.
and
are longitudinal and latitudinal distances between the aircraft and receiver.
In order to obtain the right bearing with respect to the north, the following corrections were applied.
2.5. Direction of Arrival Estimation
Based on different signal properties, multiple methods are available to estimate the direction of an incoming propagating wave source relative to a set of antennas. The techniques are widely applied in time series analysis research [
7]. Based on the N-channel I/Q data, DOA can be estimated. The different antennas collect signals from a propagating wave source at a different time due to the spacing of the antenna array. Assuming the incoming signal is narrowband, the delay of arrival can be defined as phase shift [
3].
The total signal and noise received by the antenna array can be expressed in Equation (
6), where
x(
t) is a matrix with dimensions that correspond to the number of coherent channels and the number of signal samples:
where
represents the steering matrix with angles
,
denotes the signal column vector, and
denotes the uncorrelated additive white Gaussian distributed noise vector. Note that in this study, the noise vector is assumed to be constant. The total signal received per antenna (
Nth element) at time
t can be modeled by Equation (
7).
In this paper, we make use of PyArgus library (available online:
https://github.com/petotamas/pyArgus, accessed on 1 June 2021) to perform the calculation, which includes five different methods for DOA estimation. The implementation of these methods requires information about spatial direction, signal gain, and expected phase relationships. These are stored in the spatial correlation matrix
and the steering matrix
.
2.5.1. Spatial Correlation Matrix
The first input element to be calculated is the spatial correlation matrix
. This matrix contains the correlation of the spatial direction of the signal and the average receiver signal gain. For each number of samples (one complete ADS-B signal) found using the PyModeS library, the raw
N-channel I/Q signal (
) can be transformed into the spatial correlation matrix by using Equation (
8).
In the case of a four-channel coherent SDR, for each sample of the multi-channel raw signal, this results in a spatial correlation matrix with size .
2.5.2. Steering Matrix
The second input element to be calculated is the steering matrix, which represents expected phase relations for the specific incident angles
m [
3]. The steering vectors are based on interelement spacing
d and expected incident angles (
). Using Equation (
9), the
mth array element of the steering vector can be calculated. The sine component equals zero for ULA.
2.6. Direction of Arrival Estimation Algorithms
A pseudo spectrum,
, of the incoming signal can be determined with the required knowledge about the average signal gain, spatial direction, resolution, and expected phase relationships. This contains the relationship between the signal strength and the incident angle. Locating the corresponding incident angle of the maximum amplitude, an estimated value for the DOA can be found. The five used algorithms in the PyArgus toolbox, both linear DOA estimation algorithms and algorithms based on the decomposition of sub-spaces, are explained and described in the following sections [
8].
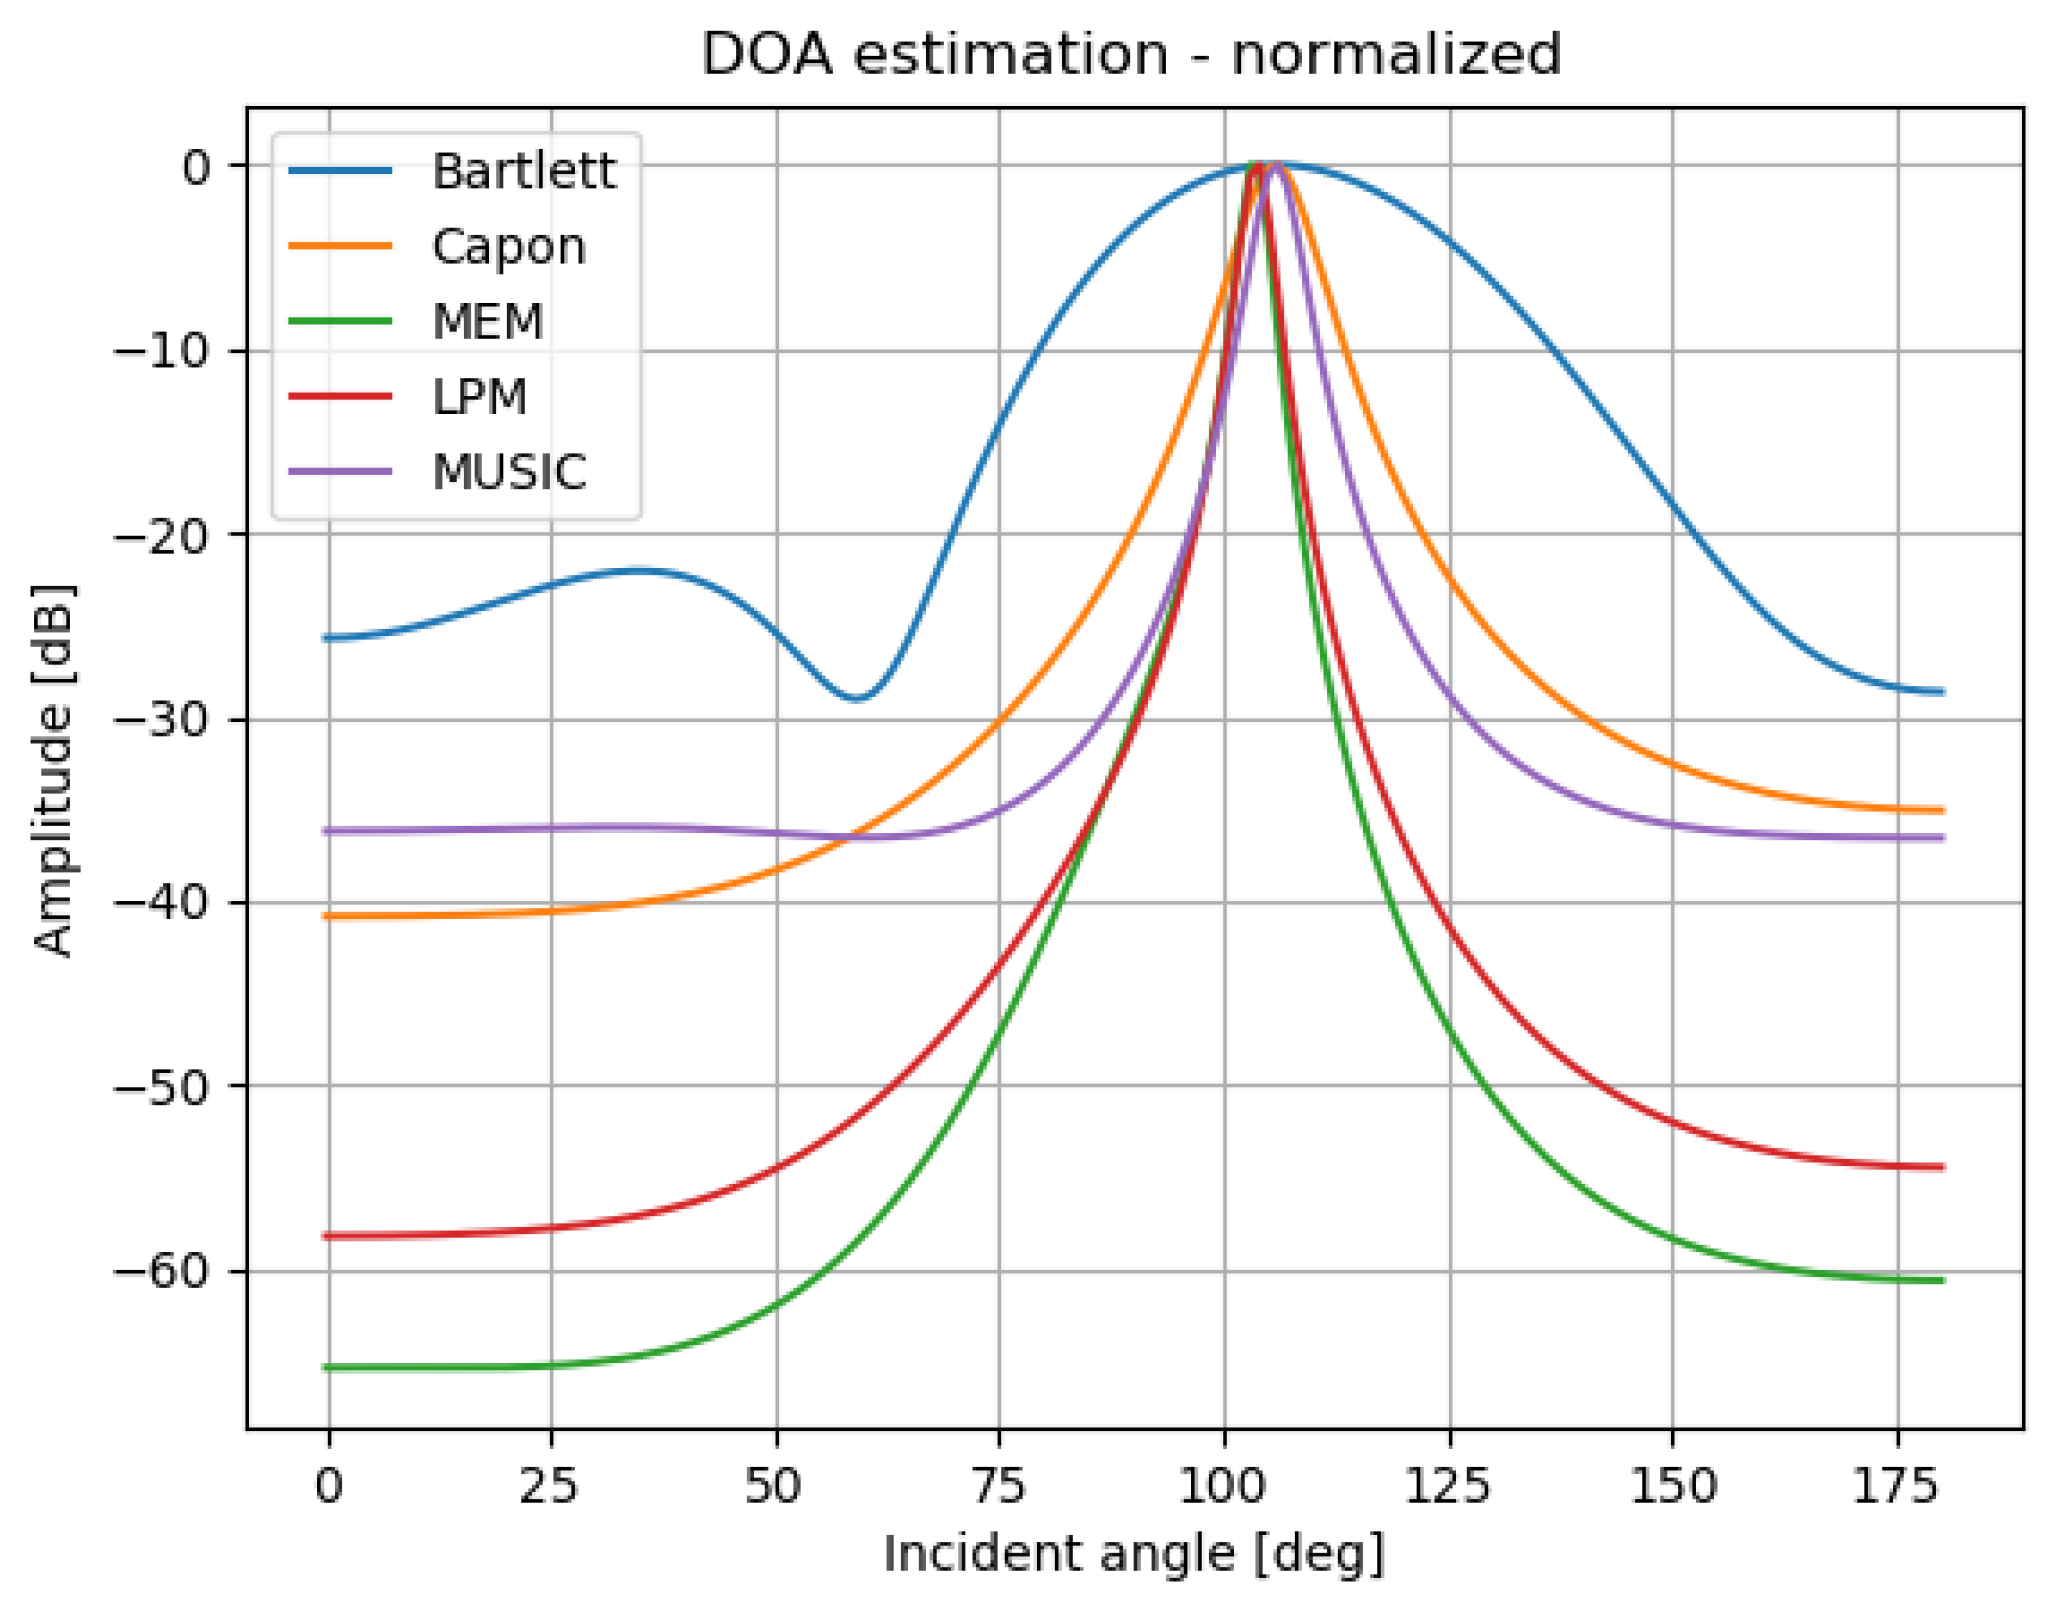
In
Figure 6, an example of the pseudo spectrum plot of one complete ADS-B signal for the five used algorithms is pictured. The investigated resolution is 180 degrees in this figure, and locating the maximum amplitude provides an estimated DOA value of 104 degrees.
2.6.1. Bartlett Method
The Bartlett (Fourier) method consists of power spectra estimation [
5]. The method provides a reduction in the variance of the periodogram at the cost of reduced resolution [
9]. This is performed by maximization of the output power
for a certain direction. Equation (
10) shows the calculation of the pseudo spectrum of Bartlett’s method:
where
is the spatial correlation matrix, and
is the scanning vector of the array.
2.6.2. Capon’s Method
Capon’s method is also known as the maximum variance distortionless response. The method is a maximum likelihood estimate of the power arriving from one direction
[
10]. It considers all other sources as interference. The signal to interference ratio has to be maximized while passing the source signal undistorted in amplitude and phase [
8]. Equation (
11) is the pseudo spectrum of the Capon method.
2.6.3. Burg’s Maximum Entropy Method
In order to implement Burg’s Maximum Entropy Method (MEM), a power spectrum has to be found such that its Fourier transform equals the measured correlation. This correlation is subjected to the maximized entropy constraint [
11]. Equation (
12) is the pseudospectrum of Burg’s maximum entropy method:
where
is the weight of the optimal beam former, and
is a vector denoting outputs of auxiliary beams of a beam-space processor. The number of outputs equals the number of dimensions of vector
[
9].
2.6.4. Linear Prediction Method
Linear prediction method (LPM) is a method that estimates the output from one antenna using linear combinations of the other antenna outputs [
8]. The mean square error between the estimation and the true output is minimized [
12]. Equation (
13) is the pseudo spectrum of LPM:
where
is the Cartesian basis vector, which is chosen for prediction.
2.6.5. Multiple Signal Classification
Multiple Signal Classification (MUSIC) is considered as an efficient eigenstructure variant [
9]. Equation (
14) is the pseudo spectrum of the MUSIC method:
where
is the noise subspace eigenvector, which can be determined from the spatial correlation matrix.
2.7. Verification Reliability Classification
In this study, we make use of the method proposed by [
13] to determine the reliability of injection detection. In this paper, the ADS-B direction of arrival (
) parameter was used to validate the calculated direction of arrival (
). The absolute error between the two independent parameters for each incoming signal (
n) can be calculated by using Equation (
15).
We assume that both azimuth angles,
and
, are Gaussian distributed with zero mean and variances
and
. Therefore, the standard deviation of both distributions can be expressed as
. Consequently, the probability density function of random variable
=
can be described as a half-normal distribution due to the absolute values taken from two Gaussian distributed parameters. Thus, the confidence
of a measurement
can be retrieved from Equation (
16):
where
is the spacing factor.
is a point of the curve at which a change in the direction of curvature occurs (Equation (
17)), with
defined as the occurring error rate of the wrong classification. The typical value of
is
.
Based on confidence rate computed from Equation (
16), we use a rolling product of current confidence (constrained to [0.5, 1]) with previous confidence and constrain the result to [0, 1]. The dynamic confidence value converges close to one or zero for real flights or injected signals, respectively.
3. Experiments and Results
We conduct multiple experiments to test and validate the methods we have proposed. Real ADS-B signals are first gathered at 1090 MHz radio frequency with a LimeSDR transceiver. Due to the fact that 1090 MHz is a restricted radio frequency, the signals are only rebroadcast on 898 Megahertz radio frequency to simulate signal injection. The KerberosSDR, a 4-channel coherent receiver, is used to receive the signal.
As recommended by the manufacturer of the KerberosSDR, the interelement spacing factor (s) is set to 0.33. Calculating the interelement spacing (d) in meters (using: ) provides m, 1090 MHz for frequency, and m for 868 MHz.
3.1. Performance of Different Algorithms
The overall performance of the model can be expressed using standard deviation (
) of the DOA error. The standard deviation is obtained by using real ADS-B signals to determine these values. As earlier described, the values (in degrees) are determined for all five DOA algorithms and both antenna setups for a large number of signals. The results are pictured in
Table 1.
Based on these test, we can conclude that the best performance of the proposed approach is achieved with UCA setup and Bartlett’s DOA estimation method.
3.2. Identification of Real and Injected ADS-B Signals
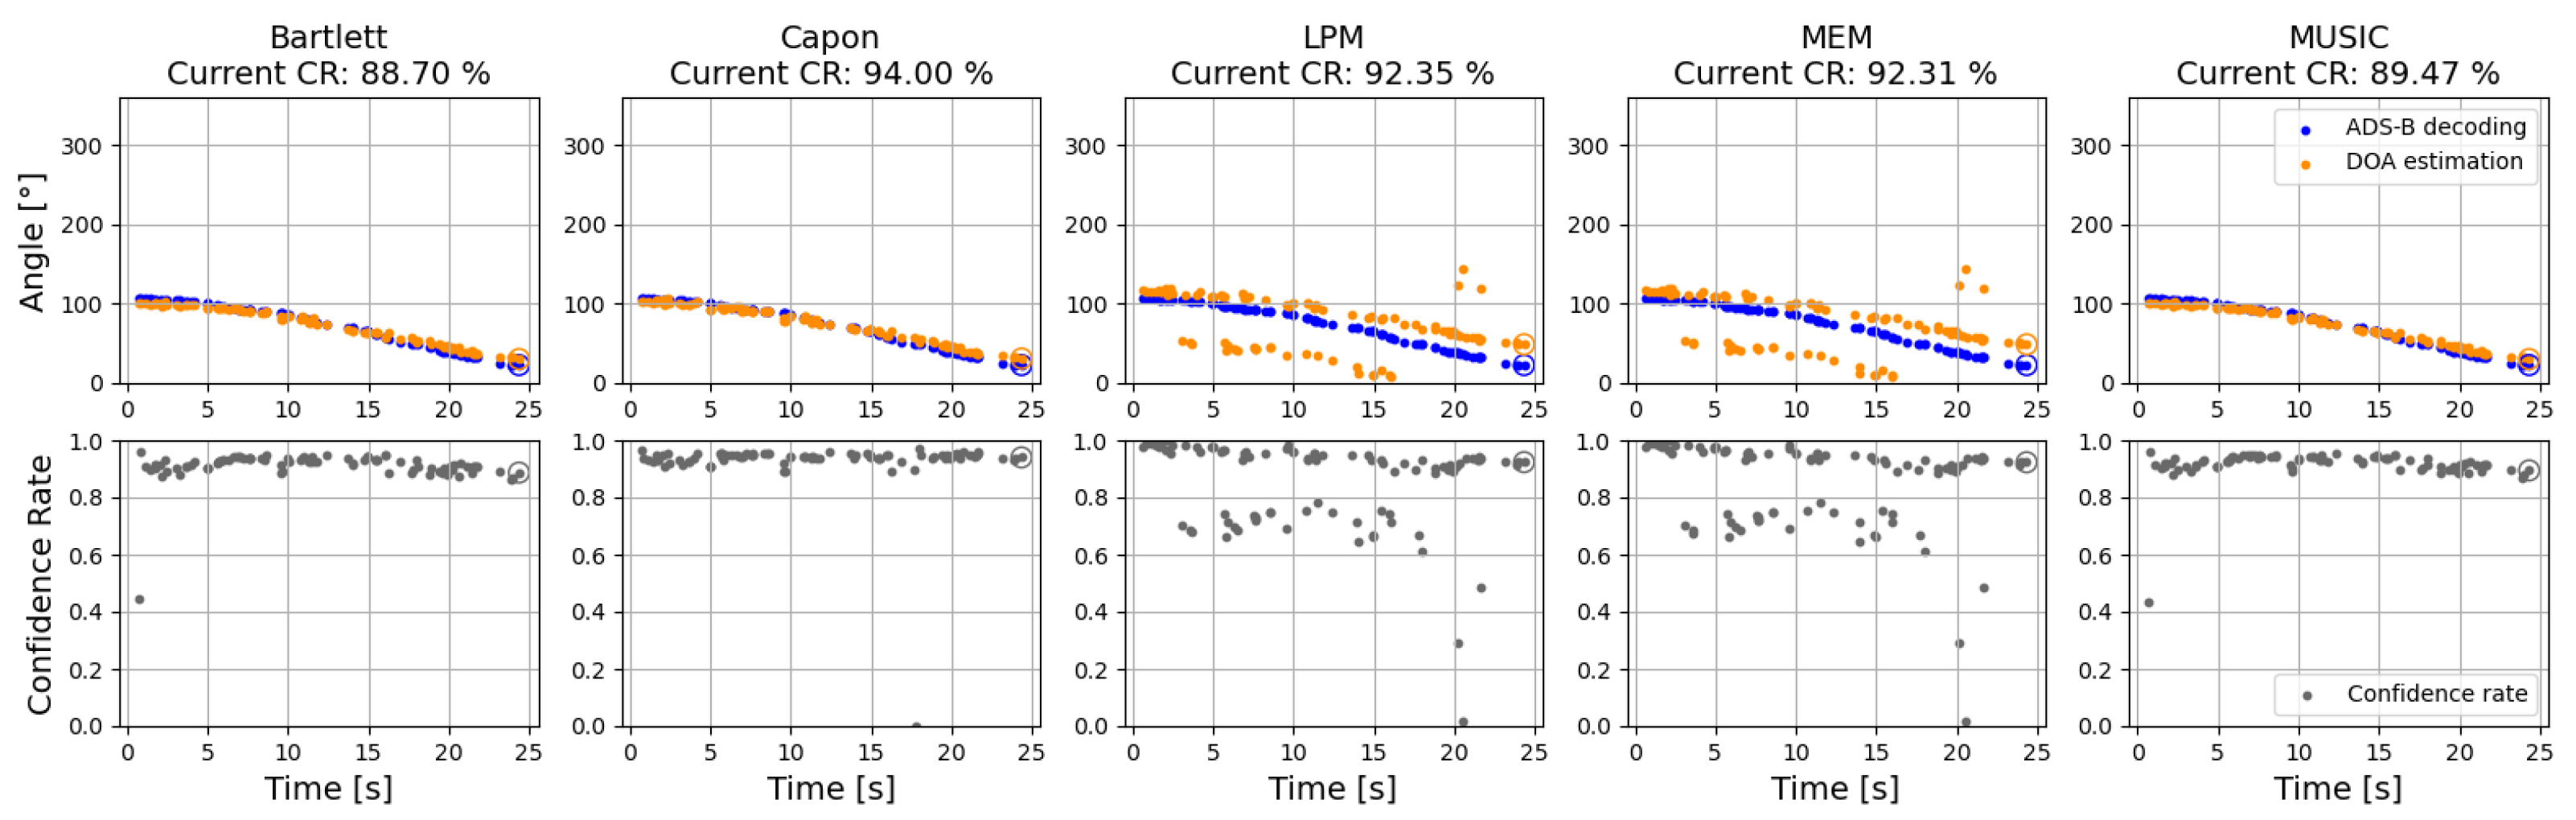
Figure 7 shows an example of the results using real ADS-B data. For all five algorithms, a similar flight path (azimuth angle) is shown. In the top row, the DOA based on the claimed position (blue) and the estimated DOA (orange) are plotted against time in seconds. Each couple of dots refers to one complete incoming ADS-B or Mode S signal. In the bottom row, the confidence rate for each signal is plotted. Using the reliability classification method, the following parameters were chosen: spacing factor
= 50 and misclassification rate
. The current confidence rate or confidence rate of the last incoming signal is pictured above the figures, and the confidence rate values are approaches one for real incoming ADS-B signals.
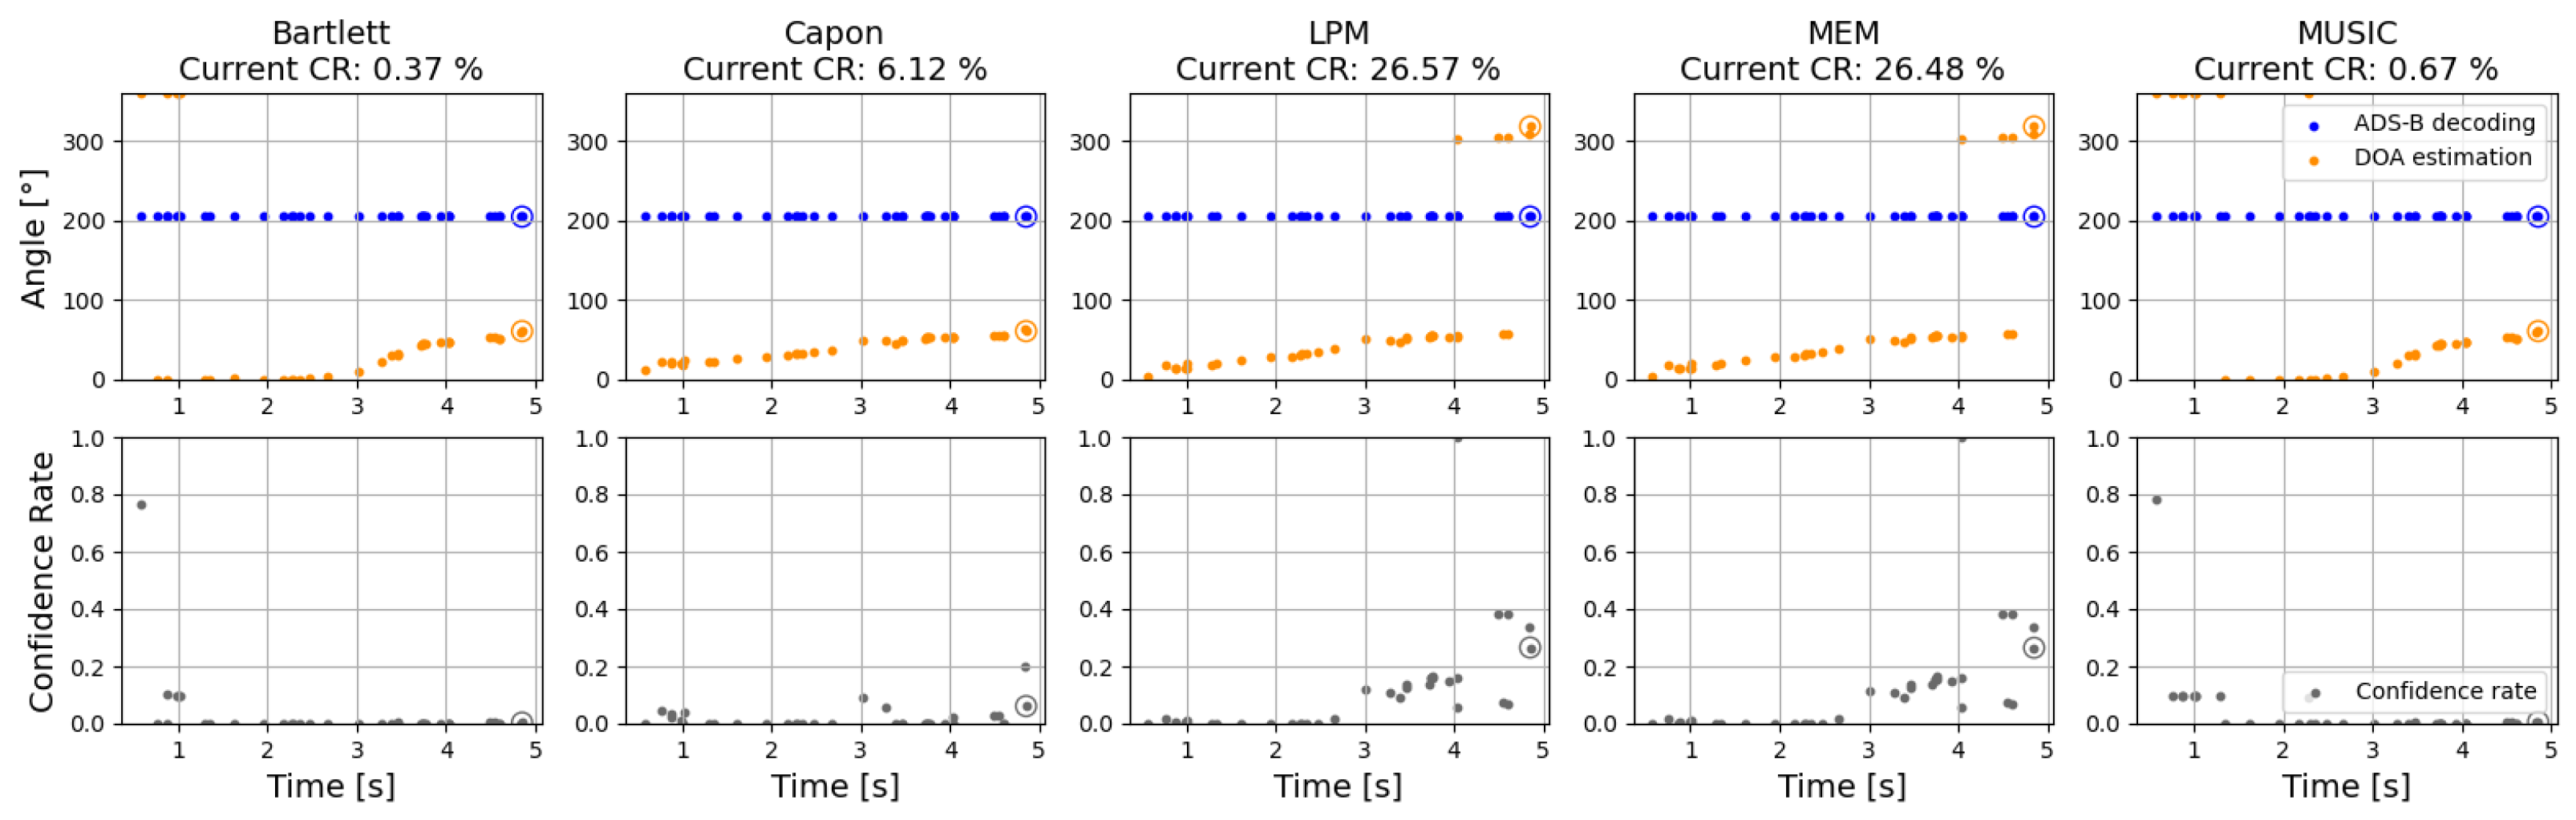
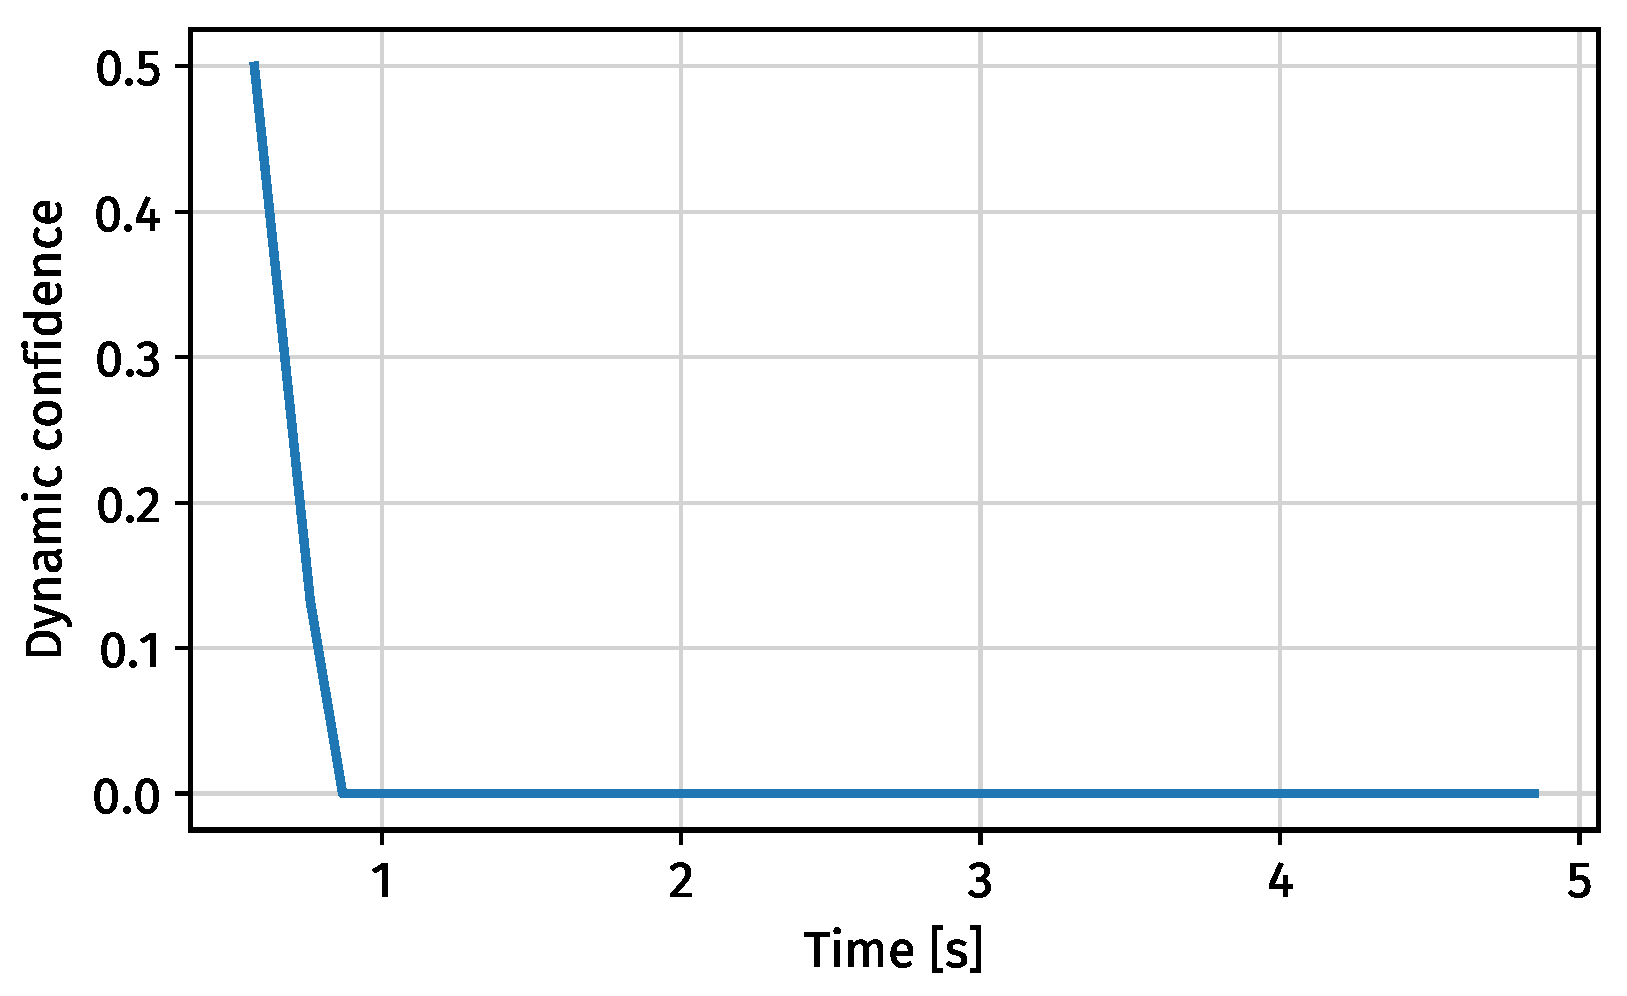
Figure 8 shows an example of the application of different DOA algorithms with injected signals. The 1090 MHz sample of real ADS-B data was rebroadcast at 868 MHz to simulate injection. This is an example of dynamic injection, since the transmitter is moving around the receiver while broadcasting the malicious signal. Therefore, the estimated DOA values (orange) move over time, while the azimuth angle based on the claimed position remains constant. The confidence rate values approach zero for maliciously injected incoming ADS-B signals. For the static injection scenario, both the receiver and transmitter have a fixed position, and the confidence results are comparable.
3.3. Dynamic Integrity
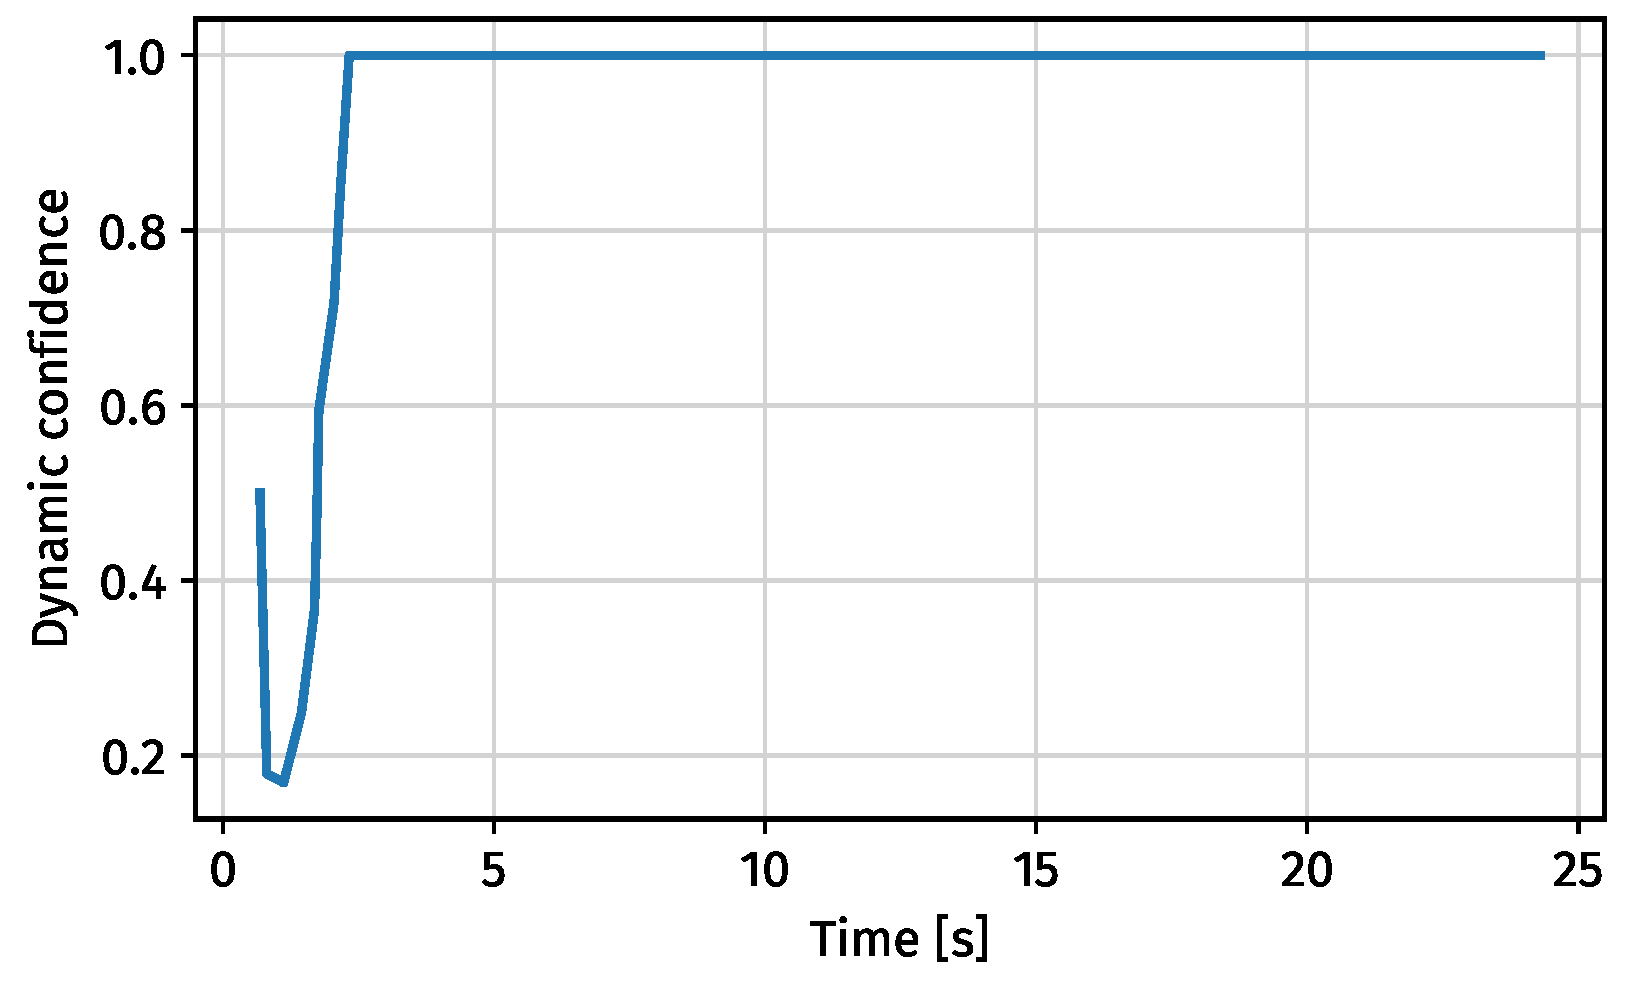
Misclassifications can cause some signals to be wrongly classified, especially when the calculated azimuth angle based on the claimed aircraft position is by chance close to the estimated angle of arrival. The confidence rate value will (unintentionally) approach a value of one, causing the injection to become undetected. In real operations, the bearing from aircraft is unlikely to remain constant. The integrity of the signal from
Figure 7 and
Figure 8 can be dynamically computed, and dynamic confidence can be observed in
Figure 9 and
Figure 10, respectively.
4. Conclusions
This research serves as a proof of concept for a cost-effective method that can identify maliciously injected ADS-B signals. Between two types of antenna setups and five different types of estimation methods, the best performance is achieved with the uniform circular antenna setup and Bartlett’s direction of arrival estimation method. Based on our experiment, dynamically injected malicious ADS-B signals can be identified with our approach. In addition, we have demonstrated that the integrity of real ADS-B data can be verified dynamically using the simple rolling confidence model we propose in this paper.
Author Contributions
W.H.: Methodology, software, validation, data Curation, visualization, writing—original draft, and writing—review and editing. J.S.: Conceptualization, methodology, software, resource, writing—original draft, writing—review and editing, and supervision. J.H.: Conceptualization, supervision, and writing—review and editing. All authors have read and agreed to the published version of the manuscript.
Institutional Review Board Statement
Not applicable.
Informed Consent Statement
Not applicable.
References
- Leonardi, M.; Di Gregorio, L.; Di Fausto, D. Air traffic security: Aircraft classification using ADS-B message’s phase-pattern. Aerospace 2017, 4, 51. [Google Scholar] [CrossRef] [Green Version]
- Strohmeier, M.; Lenders, V.; Martinovic, I. Security of ADS-B: State of the Art and Beyond. arXiv 2013, arXiv:1307.3664. [Google Scholar]
- Bhuiya, S.; Islam, F.; Matin, M. Analysis of direction of arrival techniques using uniform linear array. Int. J. Comput. Theory Eng. 2012, 4, 931–934. [Google Scholar] [CrossRef]
- Sun, J.; Vû, H.; Ellerbroek, J.; Hoekstra, J.M. pyModeS: Decoding Mode-S Surveillance Data for Open Air Transportation Research. IEEE Trans. Intell. Transp. Syst. 2019, 21, 2777–2786. [Google Scholar] [CrossRef]
- Li, Z.; Zhang, D. Application Research on DOA Estimation Based on Software-Defined Radio Receiver. J. Phys. Conf. Ser. 2020, 1617, 012047. [Google Scholar] [CrossRef]
- Long, J.A. Kinematic interpolation of movement data. Int. J. Geogr. Inf. Sci. 2016, 30, 854–868. [Google Scholar] [CrossRef] [Green Version]
- Godara, L.C. Applications of antenna arrays to mobile communications. I. Performance improvement, feasibility, and system considerations. Proc. IEEE 1997, 85, 1031–1060. [Google Scholar] [CrossRef]
- Adam, I.A.H.; Islam, M.R. Perfomance study of direction of arrival (DOA) estimation algorithms for linear array antenna. In Proceedings of the 2009 International Conference on Signal Processing Systems, Singapore, 15–17 May 2009; pp. 268–271. [Google Scholar]
- Godara, L.C. Application of antenna arrays to mobile communications. II. Beam-forming and direction-of-arrival considerations. Proc. IEEE 1997, 85, 1195–1245. [Google Scholar] [CrossRef] [Green Version]
- Capon, J. High-Resolution Frequency-Wavenumber Spectrum Analysis. Proc. IEEE 1969, 57, 1408–1418. [Google Scholar] [CrossRef] [Green Version]
- Burg, J.P. Maximum Entropy Spectral Analysis; Stanford University: Stanford, CA, USA, 1975. [Google Scholar]
- Chandran, S. Smart antennas for wireless communications (with matlab)(gross, f.; 2005)[reviews and abstracts]. IEEE Antennas Propag. Mag. 2009, 51, 134. [Google Scholar] [CrossRef]
- Monteiro, M.; Barreto, A.; Kacem, T.; Wijesekera, D.; Costa, P. Detecting malicious ADS-B transmitters using a low-bandwidth sensor network. In Proceedings of the 2015 18th International Conference on Information Fusion (Fusion), Washington, DC, USA, 6–9 July 2015. [Google Scholar]
| Publisher’s Note: MDPI stays neutral with regard to jurisdictional claims in published maps and institutional affiliations. |
© 2021 by the authors. Licensee MDPI, Basel, Switzerland. This article is an open access article distributed under the terms and conditions of the Creative Commons Attribution (CC BY) license (https://creativecommons.org/licenses/by/4.0/).


