Abstract
This paper presents an investigation of the influence of higher-order harmonics on the frequency-response characteristics of a full-bridge series-resonant DC-DC converter. A Fourier series-based analytical method is developed to include these harmonics, providing a more accurate representation of voltage and current waveforms within the resonant tank, as well as in the converter input and output. The frequency characteristics, total harmonic distortion (THD) and ripple factors of the converter are derived for various quality factors and normalized frequencies using GNU Octave for computational modeling. The results reveal that the higher-order harmonics considerably affect the shape and amplitude of the resonant current, especially below the resonant frequency. Experimental validation using a laboratory prototype demonstrates good correlation with the theoretical predictions obtained by the Fourier series analysis, whereas the FHA method shows noticeable deviations. The proposed approach offers improved precision and can serve as a practical tool for the filter design and performance optimization of resonant power converters.
1. Introduction
The First Harmonic Approximation (FHA) is a well-known and widely used approach for analyzing resonant converters. This method considers only the fundamental (first) harmonic of periodic signals [1,2]. This approach significantly simplifies the mathematical analysis and facilitates the study of converter behavior under various operating conditions. One of the main drawbacks of this method is the neglect of the higher-order harmonics effect, which could be significant in applications where the signals are not purely sinusoidal [3].
Studies considering the influence of higher-order harmonics can be found in the literature. For instance, in [4], a multi-harmonic analysis is employed to develop an AC small-signal equivalent circuit for dynamic control design. However, that work does not focus on the representation of THD, RMS current, ripple factor, or harmonic spectra.
This article examines a full-bridge series-resonant converter. In addition to providing high efficiency and enabling soft switching capability, an advantage of this topology is its inherent protection against short circuits. This behavior results from the converter’s inductance, which prevents a sudden rise in the current even when the output is shorted. In this way, a built-in current limiter is provided, protecting the switching elements and transformer from overload and potential damage [5,6,7].
The objective of this study is to emphasize the importance of expanded harmonic analysis in modeling series resonant converters and to demonstrate that highly accurate results could be achieved through simple computations, surpassing the accuracy of classical simplified models.
2. Fourier Series Analysis of the Series Resonant Converter
A circuit of a full-bridge voltage-switching series resonant converter is depicted in Figure 1. It consists of an inverter with four controllable switches, a series-resonant tank, a high-frequency rectifier and a load. The harmonic analysis of the circuit assumes operation without input and output filters, which allows the influence of different harmonics to be assessed. After performing the harmonic analysis of the input and output currents and voltages, suitable filters can be selected to attenuate the undesired harmonics that exhibit significant amplitudes.
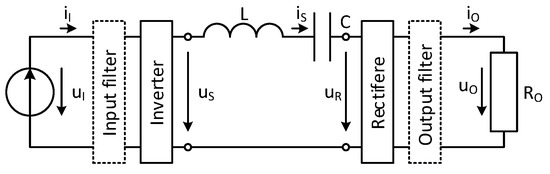
Figure 1.
Series resonant DC-DC converter block diagram.
2.1. Resonant Current of Series-Resonant Circuit
The input voltage of the series-resonant circuit is a square wave described in [1]. In the case of the square wave signal, the Fourier series includes the odd harmonics (k), and the input voltage of the resonant tank (uS) can be expressed with the equations shown in [1]. The Fourier series has a fundamental frequency ωf. The phasor voltage for the n-th consecutive element is expressed by (1). We restrict the analysis to odd-order harmonics by replacing the harmonic index k with k = 2n − 1. This keeps the series indexed by successive integers in the calculating procedure.
The analysis of the converter of Figure 1 is based on the equivalent circuit with the following assumptions [1]:
- The transistor and diode form a resistive switch whose on-resistance is linear; the parasitic capacitances of the switch are neglected, and with zero switching time.
- The series-resonant tank elements are passive, linear, and time-invariant and do not have parasitic reactive components.
The parameters of the series-resonant circuit are [1]: ω0 = 1/(LC)1/2—resonant frequency; Z0 = (L/C)1/2 = ω0L = 1/(ω0C)—characteristic impedance; QL = Z0/R—loaded quality factor; ν = ωf/ω0—normalized frequency. The impedance of the inductor and capacitor for the n-th consecutive element could be represented as ZL(n) = j(2n − 1)νZ0; ZC(n) = −jZ0/((2n − 1)ν), and the impedance of the resonant tank in Equation (1):
The phasor current for the n-th element expressed in Equation (2), and its time domain transformation is presented in Equation (3).
Figure 2 presents waveforms of uS, iS and iS(1) in relative units, using the base values Ub = USm(1); Ib = Ism(1). The total RMS current can be determined by the RMS current at each component in the Fourier series, as expressed in [2].
where .
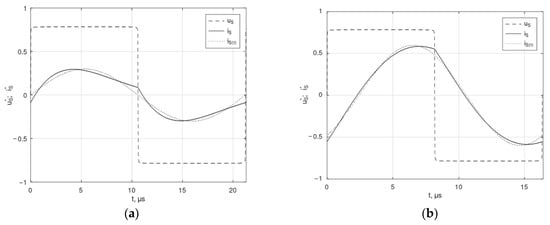
Figure 2.
Resonant voltage and current waveforms for: (a) QL = 0.8 and ν = 0.7; (b) QL = 2.5 and ν = 1.3.
The resonant tank input impedance for the n-th consecutive element is given by the following:
Using the proposed analysis the normalized frequency characteristics of the total re-sonant current for different values of QL are presented in Figure 3.
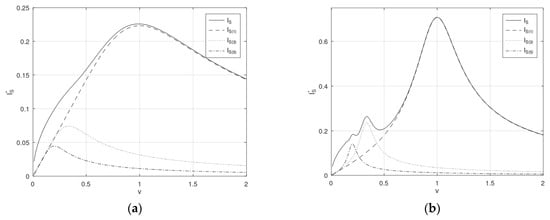
Figure 3.
Frequency characteristics of the resonant current and 1st, 3rd and 5th harmonics for: (a) QL = 0.8; (b) QL = 2.5.
Calculation of THD for the resonant current is made using the proposed analysis. The results for different values of QL and ν are presented in Table 1. Based on the results, the higher-order harmonics effect is more significant under resonant frequency (ν < 1). The converter load influences the THD results as well.

Table 1.
THD of the resonant current.
2.2. Input and Output Currents
The input and output currents of the converter could be determined by the resonant current, with the periodic switching of the inverter’s switches and rectifier’s diodes, respectively, reversing the current polarity [2]. The cycle of these currents is twice the operating frequency [1]: TfI = Tf/2; ωfI = 2ωf.
Fourier series analysis of the resultant waveform is performed, and the following parameters could be obtained for the input, as well as the output current: DC component I, amplitude Im(n) and phase shift ΨI(n) of the fundamental component and high-order harmonics. The plot between IIm(n) and IOm(n) versus harmonic sequence number n for different values of QL and ν are presented in Figure 4.
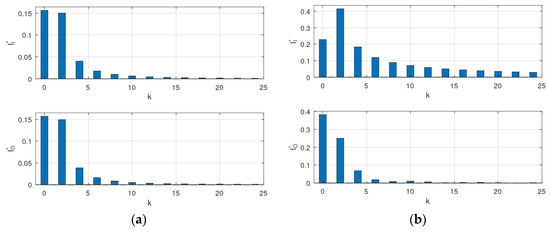
Figure 4.
Harmonic spectra of the input and output currents for: (a) QL = 0.8 and ν = 0.7; (b) QL = 2.5 and ν = 1.3.
Based on the harmonic spectra obtained for the desired nominal operating mode of the resonant converter, a decision can be made on whether to employ input and/or output filters. This decision should consider the magnitude of the higher-order harmonics and the specific requirements of the intended application. Appropriate filters can then be selected to attenuate the frequencies of the specific harmonics.
Calculation of the ripple factor (RF) for the input and output currents are made using the proposed analysis. It is defined as the ratio of the RMS value of the AC component to the average DC component. The results for different values of QL and ν are presented in Table 2.
Table 2.
Ripple Factor of the input and output current.
It can be observed that for frequencies away from the resonant, the RF of the input current is significantly higher than that of the output current, especially under near no-load operating conditions. The primary cause of this behavior is the presence of negative input current during part of the period. The Fourier series of the total input and output currents can be obtained by the amplitude and phase shift in each harmonic.
Waveforms of uI, iI and iI(1) in relative units as dependency of time are shown in Figure 5a and for uO, iO and iO(1) in Figure 5b.
Figure 5.
Voltage and current waveforms for QL = 2.5 and ν = 1.3: (a) input; (b) output.
3. Experimental Results
Test circuit of a series resonant DC-DC converter with frequency control has been developed. It consists of a signal logic board and a gate driver board, which controls the operation of a full-bridge transistor inverter. The operating mode of the converter is generated via a computer interface and subsequently stored in the signal board for execution. It generates a control sequence for the power switches. Output of the inverter is connected to a series resonant LC-circuit with a resonant frequency of 44 kHz. The converter supply voltage is 32 VDC. A full-bridge uncontrollable rectifier is used, as well as a resistive load with values between 6 Ω and 20 Ω. Test circuit parameters are given in Table 3:
Table 3.
Circuit parameters.
Figure 6 shows the waveforms of the resonant circuit voltage and current at quality factor QL = 2.5, corresponding to a load resistance RO = 5 Ω and normalized frequency ν = 1 (switching frequency of 44.13 kHz) and ν = 1.3, respectively. The experimental data in Figure 6b confirm the results of the theoretical analysis shown in Figure 2b.
Figure 6.
Resonant voltage and current waveforms for: (a) QL = 2.5 and ν = 1; (b) QL = 2.5 and ν = 1.3.
4. Conclusions
This study demonstrated the effectiveness of Fourier series analysis in analyzing resonant converters with higher accuracy than the classical First Harmonic Approximation (FHA). By including higher-order harmonics in the analysis, a more precise representation of circuit behavior has been achieved, especially under non-sinusoidal conditions. The quantitative evaluations of resonant-current THD and input/output ripple factor highlight the operating modes where FHA has significant deviations from the Fourier series analysis results, mainly for frequencies under the resonant and at relatively low-quality factor. Harmonic spectra of the converter’s input and output currents can be obtained using the proposed analysis. The results can be used for filter topology choice and sizing.
Experimental validation of the analytical results has been presented using a laboratory prototype of a full-bridge series resonant DC-DC converter. The experimental waveforms of input, resonant and output currents and voltages under various operating modes showed close compliance with the theoretical predictions derived using the Fourier method.
Author Contributions
Conceptualization, D.S., A.L., V.M. and Y.M.; Methodology Y.M. and H.V.; Software, H.V.; Validation, D.S., A.L., V.M., Y.M. and H.V.; Formal analysis, V.M. and Y.M.; Investigation, D.S., V.M., Y.M. and H.V.; Resources, A.L., H.V.; Writing—Original Draft Preparation, D.S., Y.M. and H.V.; Writing—Review and Editing, Y.M. and H.V. All authors have read and agreed to the published version of the manuscript.
Funding
This research has been funded by “Science” Fund at University of Food Technologies—Plovdiv, Bulgaria.
Institutional Review Board Statement
Not applicable.
Informed Consent Statement
Informed Consent Statement: Informed consent was obtained from all subjects involved in the study.
Data Availability Statement
The data presented in this study is available on request from the corresponding authors.
Conflicts of Interest
The authors declare no conflicts of interest.
References
- Kazimierczuk, M.K.; Czarkowski, D. Resonant Power Converters, 2nd ed.; Wiley: Hoboken, NJ, USA, 2011. [Google Scholar]
- Hart, D. Power Electronics; McGraw-Hill: Columbus, OH, USA, 2011. [Google Scholar]
- Rossetto, L.; Sipazzi, G. Series Resonant Converter with Wide Load Range. In Industry Applications Conference, Thirty-Third IAS Annual Meeting; IEEE: Piscataway, NJ, USA, 1998; Volume 2, pp. 1326–1331. [Google Scholar]
- Corti, F.; Bertolini, V.; Reatti, A.; Faba, A.; Cardelli, E. Advanced Modeling Approach for LLC Resonant Converters: From Multiharmonic Analysis to Small Signal Model. IEEE Trans. Power Electron. 2025, 40, 3899–3915. [Google Scholar] [CrossRef]
- Mukherjee, S.; Barbosa, P. Design and Optimization of an Integrated Resonant Inductor with High-Frequency Transformer for Wide Gain Range DC–DC Resonant Converters in Electric Vehicle Charging Applications. IEEE Trans. Power Electron. 2023, 38, 6380–6394. [Google Scholar] [CrossRef]
- Kasiran, M.A.N.; Ponniran, A.; Siam, N.N.M.; Yatim, M.H.; Che Ibrahim, N.A.; Md Yunos, A. DC-DC converter with 50 kHz-500 kHz range of switching frequency for passive component volume reduction. IJECE 2021, 11, 1114–1122. [Google Scholar] [CrossRef]
- M’barki, Z.; Senhaji Rhazi, K.; Mejdoub, Y. A novel fuzzy logic control for a zero current switching-based buck converter to mitigate conducted electromagnetic interference. IJECE 2023, 13, 1423–1436. [Google Scholar] [CrossRef]


Disclaimer/Publisher’s Note: The statements, opinions and data contained in all publications are solely those of the individual author(s) and contributor(s) and not of MDPI and/or the editor(s). MDPI and/or the editor(s) disclaim responsibility for any injury to people or property resulting from any ideas, methods, instructions or products referred to in the content. |
© 2026 by the authors. Licensee MDPI, Basel, Switzerland. This article is an open access article distributed under the terms and conditions of the Creative Commons Attribution (CC BY) license.