Proceeding Paper

An Open Source Water Quality Measurement System for Remote Areas †

1
Department of Electrical Engineering, Pakistan Institute of Engineering and Technology, Multan 60000, Pakistan
2
College of Underwater Acoustic Engineering, Harbin Engineering University, Harbin 150006, China
3
Department of Electrical Engineering, HITEC University, Taxila 47080, Pakistan
*
Author to whom correspondence should be addressed.
Presented at the 1st International Conference on Energy, Power and Environment, Gujrat, Pakistan, 11–12 November 2021.
Eng. Proc. 2021, 12(1), 50; https://doi.org/10.3390/engproc2021012050
Published: 29 December 2021
(This article belongs to the Proceedings of The 1st International Conference on Energy, Power and Environment)

Abstract

:
The unavailability of safe drinking water leads to poor conditions related to mental and physical health. To quantify the quality of water, laboratories testing the water are present in major cities which assess the basic quality parameters of drinking water, e.g., total dissolved salts (TDS), ion concentration (conductivity), turbidity, and pH value as recommended by the World Health Organization (WHO). The unavailability of such testing laboratories at remote locations makes the testing of the drinking water difficult. Establishing such laboratories is a tedious job as it requires a lot of costly equipment and specially trained personnel to operate them, making them difficult to handle. To address these issues, a water quality monitoring system for remote areas was designed which is capable of measuring basic measurable qualities of salt concentration, ion concentration, turbidity, and pH value. With the utilization of such a system, the user can qualify the water present in the vicinity as safe or unsafe for drinking purposes. The results from the proposed system are evaluated based on standard testing results and it is found that our water quality monitoring system is in agreement with the standard lab results with an average error of 2.9%, 1.4%, 1.2%, and 1.2% for pH, turbidity, conductivity, and TDS, respectively.

1. Introduction

Water is an essential commodity for living and is the heart of the biosphere which certifies all forms of life [1]. Good quality water plays a vital role in maintaining healthy human beings and is a key tool to undergo life [2]. Medical field experts consider that the availability of good quality water improves sanitation and domestic health issues which leads to a better environment [2].
Despite the fact that good quality water is essential for better health and a better environment, it is a fact that water becomes undrinkable because of demographic expansion, anthropogenic activities and contaminants from industries as well as from local communities [2]. When anthropogenic pollutants get dissolved in water, they directly affect the consumer’s health. These effects come in the form of water-borne diseases, such as diarrhea, cholera, typhoid, hepatitis, cancer, and leukemia [3,4]. One of the major causes of death at the worldwide level are these water-borne diseases [5]. According to WHO statistics, 80% of the diseases are due to unclean water [6], adding to which more than 14,000 people daily [5] and 20 million people yearly died due to undrinkable water intake [4]. One out of every five deaths under the age of five is said to be due to unsafe drinking water [7]. Around 30% to 40% of all diseases and deaths in Pakistan are only due to the intake of undrinkable water [8]. Monitoring physiochemical and biological parameters on a regular basis is important for protecting public health and the wellbeing of water reservoirs [9]. This is a tedious job for the regulatory authorities [9]. Water quality checking is crucial before it is distributed for drinking purposes. The determination of harmful materials such as physiochemical and suspended impurities in water is a dire need and can be judged on the quality range. Table 1 shows the acceptable ranges of physiochemical parameters considered safe for drinking purposes.
Maqbool Ali et al. [10] analyzed the water quality index of Rawal Watershed using supervised and unsupervised machine learning techniques. The system checks the water quality at watershed level which may get impure during distribution. Salin Peter et al. [11] calculated the quality index of water by examining the parameters, i.e., color, conductivity, salinity, turbidity, pH, biochemical oxygen demand (BOD), chemical oxygen demand (COD), TDS, iron and nitrates. Indu et al. [7] monitored the water quality by measuring the pH, TDS, conductivity and temperature. Niel Andre Cloete et al. [2] monitored the water quality by measuring flow, temperature, pH, conductivity and the oxidation reduction potential and displayed data at LCD transmitting through a ZIGBEE transmitter and receiver. The transmitter range was reported to be 13 m. John J. Barron et al. [12] observed microprocessor-based automatic monitoring of the effects of temperature on conductivity. Omar Faruq et al. [13] performed microcontroller-based monitoring of pH, temperature and turbidity of water and displayed the results on LCD; the system gave accuracy of turbidity and pH. Yuwono et al. [14] performed microcontroller-based conductivity monitoring by using the two electrodes method and transmitted data wirelessly through RF modules and an SMS gateway.
This paper is organized in such a manner that Section 2 describes the materials and methods utilized in this work, Section 3 presents and analyses the experimental results and Section 4 gives the conclusion.

2. Materials and Methods

There are a number of parameters that can be monitored to ensure water quality; however, the four extensively used parameters are pH, turbidity, conductivity and TDS. The samples were collected from ten different locations. For our testing, ten tests were performed on each of the ten samples, making it a hundred data units. For standard lab testing, only one of the sample from every location was sent. We have designed and fabricated a system consisting of a data acquisition system unit, sensors and battery. The experiments were conducted after calibrating and cleaning the sensors. A pH sensor is calibrated with a buffer tablet of pH value 4, and the turbidity and conductivity sensors were cleaned with laboratory grade distilled water. The system starts with self-diagnostics and gets ready to receive the water quality data just after 3 s. All the sensors transmit data to the data acquisition unit just after starting. The data acquisition unit rectifies the data and sends the respective sensor readings to the respective ports of the controller. The controller analyzes the data as per the pre-fed (WHO) data presented. After comparing the reading to the already pre-sent standards, the controller declares the sample to be fit or not fit for drinking. The decision is intimated the tester by audio buzzer as well as the display unit, which displays the actual values of the water being tested. This whole system is illustrated in Figure 1.

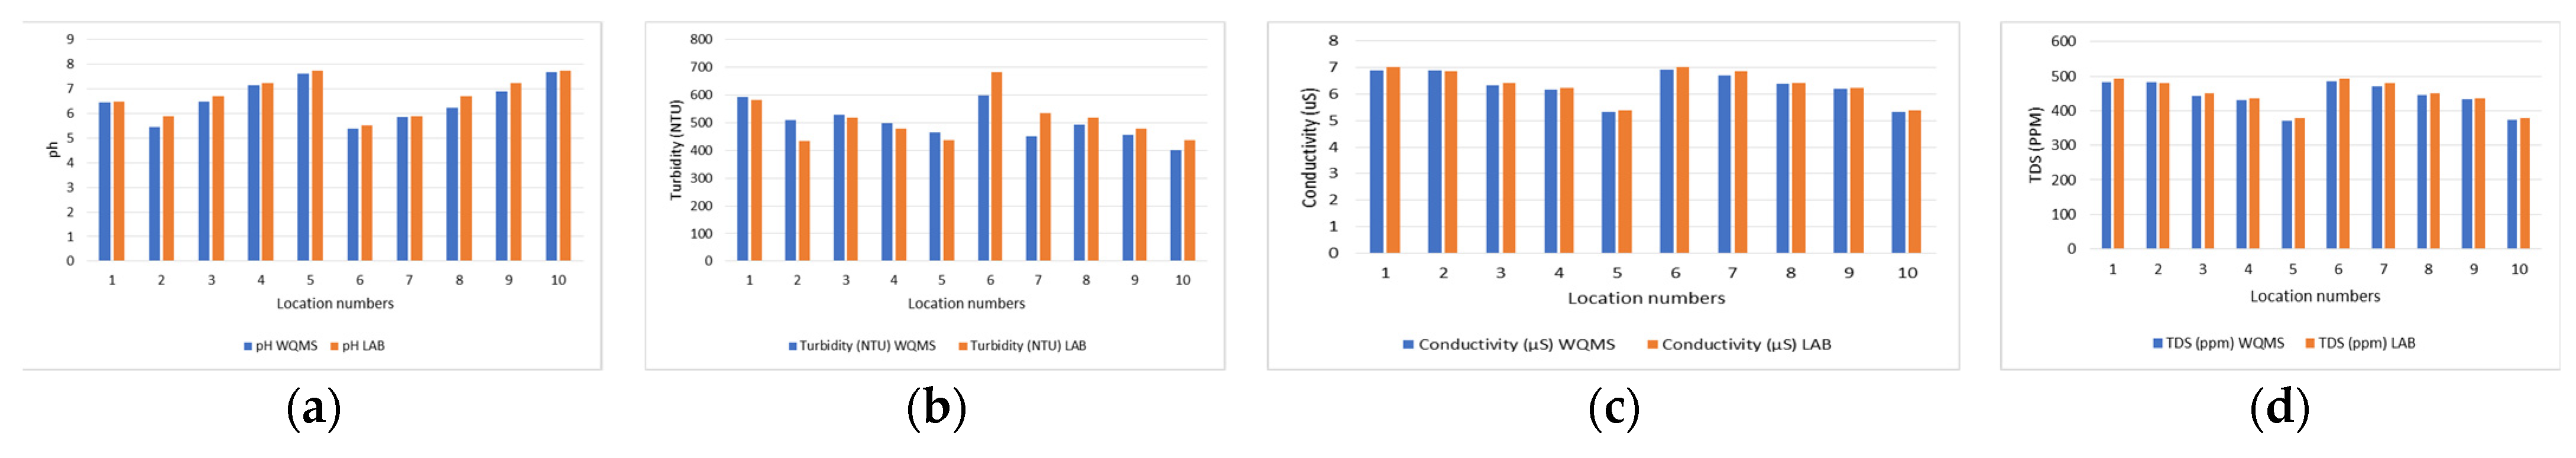
3. Results and Discussion

To demonstrate the performance of the water quality monitoring system (WQMS), a number of experiments were conducted. A total of 100 samples from different locations were collected to conduct experiments and to observe the performance of the WQMS as compared to standard water testing in laboratories. Table 2 depicts the results gathered from the WQMS and Soil and Water Testing Laboratory, Multan. The results clearly show that the average value of the WQMS readings are in line with the laboratory readings.
Figure 2 represents the comparison of pH, turbidity, and conductivity and TDS values of samples collected from ten different locations. The results presented in this work show close agreement with the results gathered from the standard water testing lab with an error of 2.9%, 1.4%, 1.2%, and 1.2% for pH, turbidity, conductivity and TDS, respectively. Table 3 shows a comparable result of our system and standard lab testing.

4. Conclusions

In any major city of the world, there are few water quality monitoring laboratories to monitor the quality of water. To overcome this deficiency, there is a need of a system that should be portable, small in size, low in cost and easily reproducible. The system presented in this paper possesses all these features and with its open source circuit and codes, it will be fairly easy to reproduce the system anywhere in the world. This project was developed in order to serve the community. WQMS was developed on small-scale costing around $50 that can be placed anywhere and can be operated by the common man with little training. WQMS has the advanced feature of operating on low voltages even on mobile phone battery banks, over conventional systems. The results of our WQMS shows a promising correlation with the lab readings, so this benchmarks WQMS to be used as a water quality tester.

Funding

This research received no external funding.

Institutional Review Board Statement

Not applicable.

Informed Consent Statement

Not applicable.

Data Availability Statement

Not applicable.

Conflicts of Interest

The authors declare no conflict of interest.

References

  1. Tzortzakis, G.; Katsiri, E.; Karavokiros, G.; Makropoulos, C.; Delis, A. Tethys: Sensor-based aquatic quality monitoring in waterways. In Proceedings of the 2016 17th IEEE International Conference on Mobile Data Management (MDM), Porto, Portugal, 13–16 June 2016. [Google Scholar]
  2. Cloete, N.A.; Malekian, R.; Nair, L. Design of smart sensors for real-time water quality monitoring. IEEE Access 2016, 4, 3975–3990. [Google Scholar] [CrossRef]
  3. Afshan, N.; Kazmi, M.; Khan, S.A.; Jafri, N. Bacteriological survey of drinking water in Karachi. In Proceedings of the 2014 11th International Bhurban Conference on Applied Sciences & Technology (IBCAST), Islamabad, Pakistan, 14–18 January 2014. [Google Scholar]
  4. Guan, L.-L.; Li, Q.-S.; Jin, B.-E. Research of the Healthy Drinkable Water–Bama Recreate Water. In Proceedings of the 2012 International Conference on Biomedical Engineering and Biotechnology, Macau, Macao, 28–30 May 2012. [Google Scholar]
  5. Reddy, P.R.; Swaroop, G.S.; Teja, M.K.R. Mathematical analysis for constant household monitor of water pollution. In Proceedings of the 2010 IEEE International Conference on Electro/Information Technology, Normal, IL, USA, 20–22 May 2010. [Google Scholar]
  6. Suthar, S.; Carpenter, N.; Chhatralia, M. Smart Water Hardness Monitoring System. In Information and Communication Technology for Intelligent Systems; Springer: Berlin/Heidelberg, Germany, 2019; pp. 595–601. [Google Scholar]
  7. Indu, K.; Choondal, J.J. Modeling, development & analysis of low cost device for water quality testing. In Proceedings of the 2016 IEEE Annual India Conference (INDICON), Bangalore, India, 16–18 December 2016. [Google Scholar]
  8. Haydar, S.; Arshad, M.; Aziz, J. Evaluation of drinking water quality in urban areas of Pakistan: A case study of Southern Lahore. Pak. J. Eng. Appl. Sci. 2016, 5, 16–23. [Google Scholar]
  9. Mounce, S.; Mounce, R.; Boxall, J. Case-based reasoning to support decision making for managing drinking water quality events in distribution systems. Urban Water J. 2016, 13, 727–738. [Google Scholar] [CrossRef] [Green Version]
  10. Ali, M.; Qamar, A.M. Data analysis, quality indexing and prediction of water quality for the management of rawal watershed in Pakistan. In Proceedings of the Eighth International Conference on Digital Information Management (ICDIM 2013), Islamabad, Pakistan, 10–12 September 2013. [Google Scholar]
  11. Peter, S.; Sreedevi, C. Water Quality Assessment and GIS mapping of ground water around KMML industrial area, Chavara. In Proceedings of the 2012 International Conference on Green Technologies (ICGT), Trivandrum, India, 18–20 December 2012. [Google Scholar]
  12. Barron, J.J.; Ashton, C. The effect of temperature on conductivity measurement. TSP 2005, 7, 1–5. [Google Scholar]
  13. Faruq, M.O.; Emu, I.H.; Haque, M.N.; Dey, M.; Das, N.K.; Dey, M. Design and implementation of cost effective water quality evaluation system. In Proceedings of the 2017 IEEE Region 10 Humanitarian Technology Conference (R10-HTC), Dhaka, Bangladesh, 21–23 December 2017. [Google Scholar]
  14. Yuwono, T.; Pramono, W.B.; Ardi, I.; Hakim, L.; Ismail, M. Design of the remote sensing circuit for water conductivity. In Proceedings of the 2015 International Conference on Space Science and Communication (IconSpace), Langkawi, Malaysia, 10–12 August 2015. [Google Scholar]
Figure 1. Flow chart of WQMS processing.
Engproc 12 00050 g001
Figure 2. Comparison between average values of water quality from WQMS and testing lab: (a) pH; (b) turbidity; (c) conductivity; and (d) TDS.
Engproc 12 00050 g002
Table 1. Acceptable ranges of pH, turbidity, conductivity and TDS.
Sample No #pH [10]Turbidity (NTU) [7]Conductivity (µS) [7]TDS (ppm) [7]
Admissible Range6.5 to 8.00 to 5000 to 50 to 500
Table 2. Comparison of average values from the WQMS and Soil and Water Testing Laboratory.
Sample from Location No #pH WQMSpH LABTurbidity (NTU) WQMSTurbidity (NTU) LABConductivity (µS) WQMSConductivity (µS) LABTDS (ppm)
WQMS
TDS (ppm)
LAB
16.456.505935836.907.03483492
25.455.905094356.96.87483481
36.486.705285176.336.43443.1450
47.147.234994786.176.25431.9437
57.627.754644375.325.40372.4378
65.385.505986836.927.03484.4492
75.875.904505356.726.87470.4481
86.236.704925176.386.43446.6450
96.907.234584786.206.25434437
107.687.754014375.335.40373.1378
Table 3. Analysis of the samples.
Sample No #LABWQMSQuality Decision
In RangeOut of RangeIn RangeOut of RangeIn RangeOut of Range
12222NeutralNeutral
22222NeutralNeutral
32213NeutralUndrinkable
42231NeutralGood
53131GoodGood
61313UndrinkableUndrinkable
71322UndrinkableNeutral
82222NeutralNeutral
93131GoodGood
103131GoodGood
Publisher’s Note: MDPI stays neutral with regard to jurisdictional claims in published maps and institutional affiliations.

