
A Hybrid MPPT Technique for Solar Photovoltaic System under Partial Shading †


Abstract
:1. Introduction
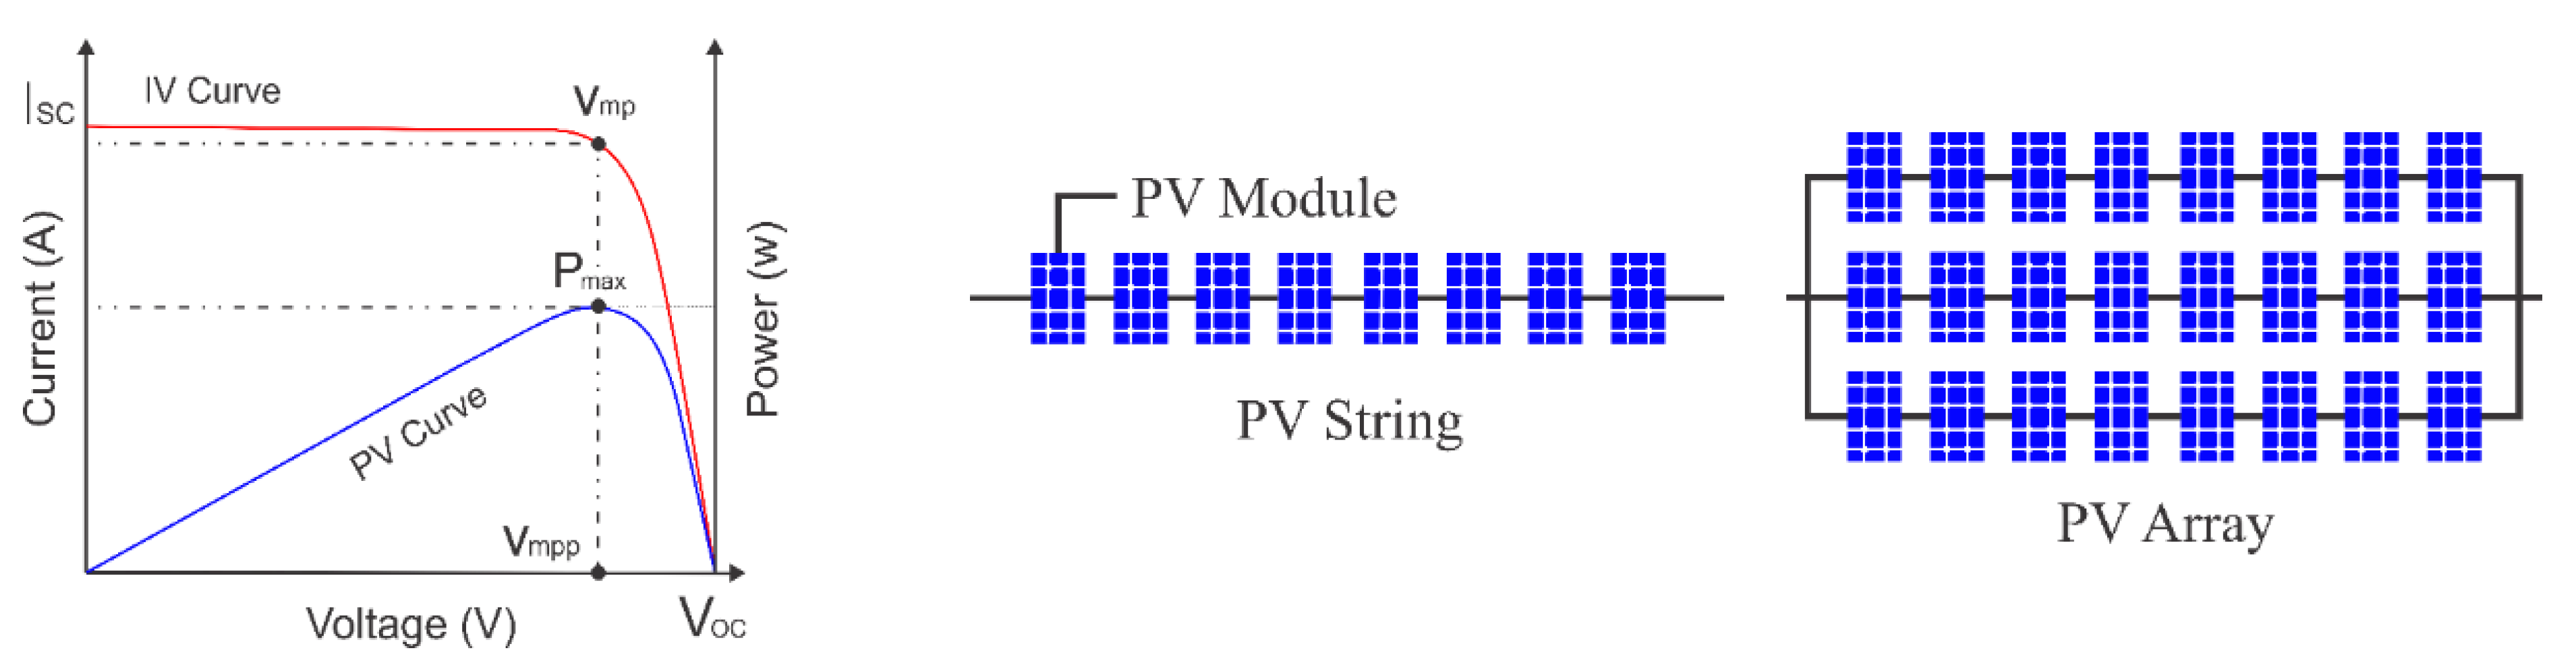
- A.
- PV Models
- B.
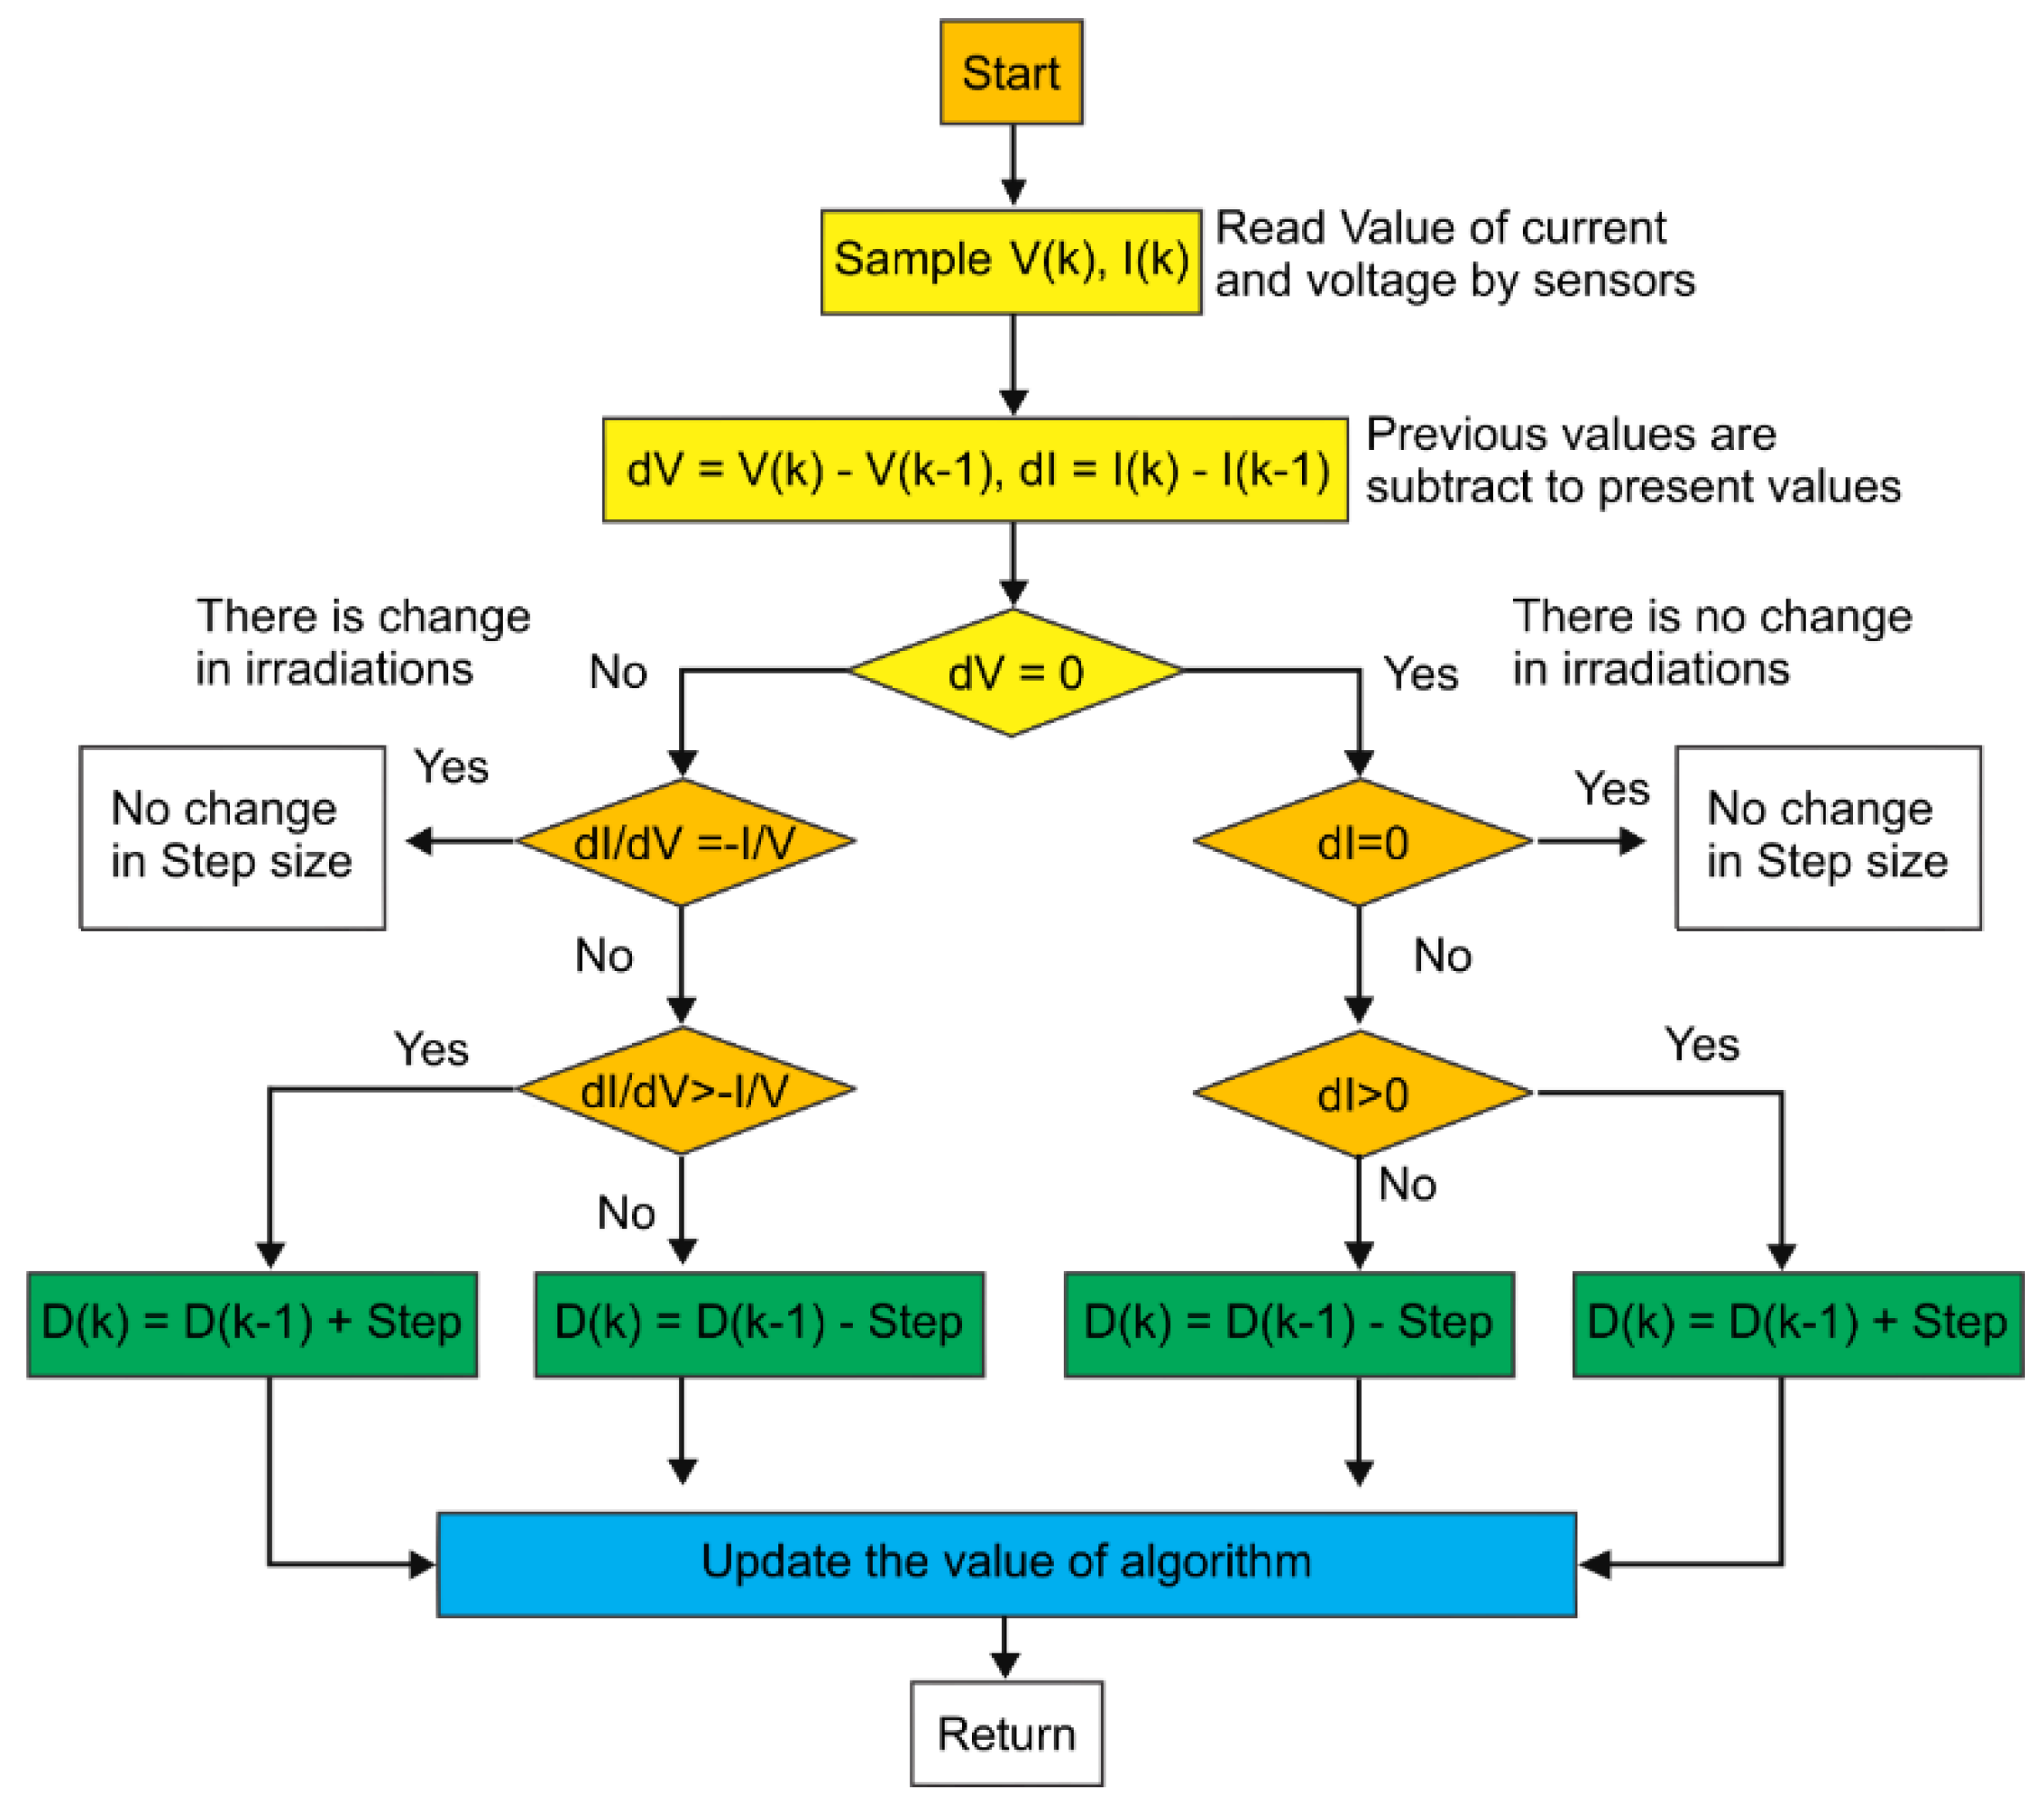
- Incremental Conductance
- C.
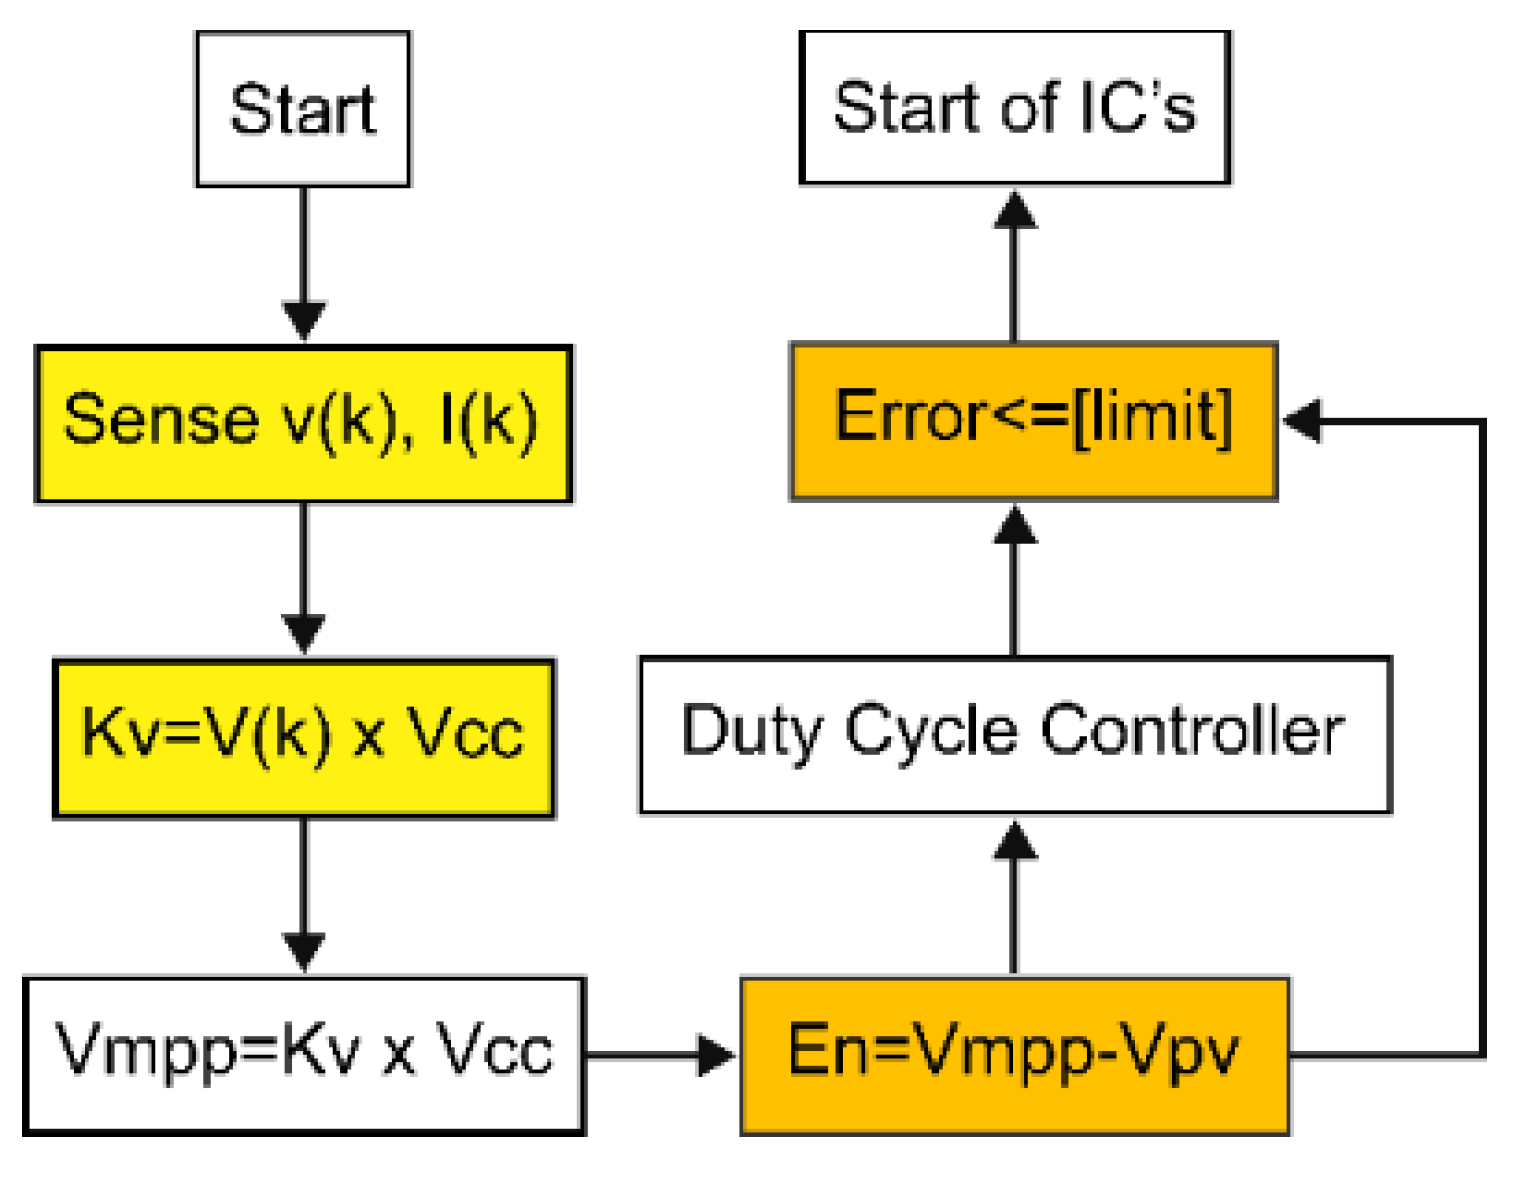
- Fractional Open Circuit Voltage
2. Proposed Technique
3. Result and Discussion
4. Conclusions
Institutional Review Board Statement
Informed Consent Statement
Data Availability Statement
References
- Ahmad, R.; Murtaza, A.F.; Sher, H.A.; Shami, U.T. An analytical approach to study partial shading effects on PV array supported by literature. Renew. Sustain. Energy Rev. 2017, 74, 721–732. [Google Scholar] [CrossRef]
- Dinniyah, F.S.; Wahab, W.; Alif, M. Simulation of Buck-Boost Converter for Solar Panels using PID Controller. Energy Procedia 2017, 115, 102–113. [Google Scholar] [CrossRef]
- Mohammad, S.S.; Devaraj, D. Simulation of Incremental Conductance MPPT based two phase interleaved boost converter using MATLAB/Simulink. In Proceedings of the 2015 IEEE International Conference on Electrical, Computer and Communication Technologies ICECCT, Coimbatore, India, 5–7 March 2015; pp. 1–6. [Google Scholar] [CrossRef]
- Ahmed, J.; Salam, Z. An Accurate Method for MPPT to Detect the Partial Shading Occurrence in a PV System. IEEE Trans. Ind. Inform. 2011, 13, 2151–2161. [Google Scholar] [CrossRef]
- Muni, T.V.; Lalitha, S.V.N.L.; Suma, B.K.; Venkateswaramma, B. A new approach to achieve a fast-acting MPPT technique for solar photovoltaic system under fast varying solar radiation. Int. J. Eng. Technol. 2018, 7, 131–135. [Google Scholar] [CrossRef]
- Sivakumar, P.; Kader, A.A.; Kaliavaradhan, Y.; Arutchelvi, M. Analysis and enhancement of PV efficiency with incremental conductance MPPT technique under non-linear loading conditions. Renew. Energy 2015, 81, 543–550. [Google Scholar] [CrossRef]
- Kamran, M.; Mudassar, M.; Fazal, M.R.; Asghar, M.U.; Bilal, M.; Asghar, R. Implementation of improved Perturb & Observe MPPT technique with confined search space for standalone photovoltaic system. J. King Saud Univ.-Eng. Sci. 2020, 32, 432–441. [Google Scholar] [CrossRef]


| Parameters | Unit | Electrical Data |
|---|---|---|
| Nominal Power Pmax | W | 200 |
| Maximum Voltage VMPP | V | 26.8 |
| Maximum Current IMPP | A | 7.61 |
| Open Circuit Voltage VOC | V | 32.9 |
| Open Circuit Current Isc | A | 8.24 |
| Output Efficiency | % | 13.5 |
| Maximum Voltage of System | VDC | 1000 |
| Temperature factor of PN | %/C0 | −0.0044 |
| Temperature factor of VDC | V/C0 | −0.0032 |
| Temperature factor of Isc | mA/C0 | 0.0004 |
| TNOCT | C0 | 47 |
| Number of Cell | ---- | 54 |
| No of Panels | No of Peaks | Open Circuit Voltage |
|---|---|---|
| 2 | 2 | 65.8 |
| 4 | 5 | 131.6 |
| 6 | 6 | 197.4 |
| 8 | 8 | 263.2 |
| 10 | 10 | 329 |
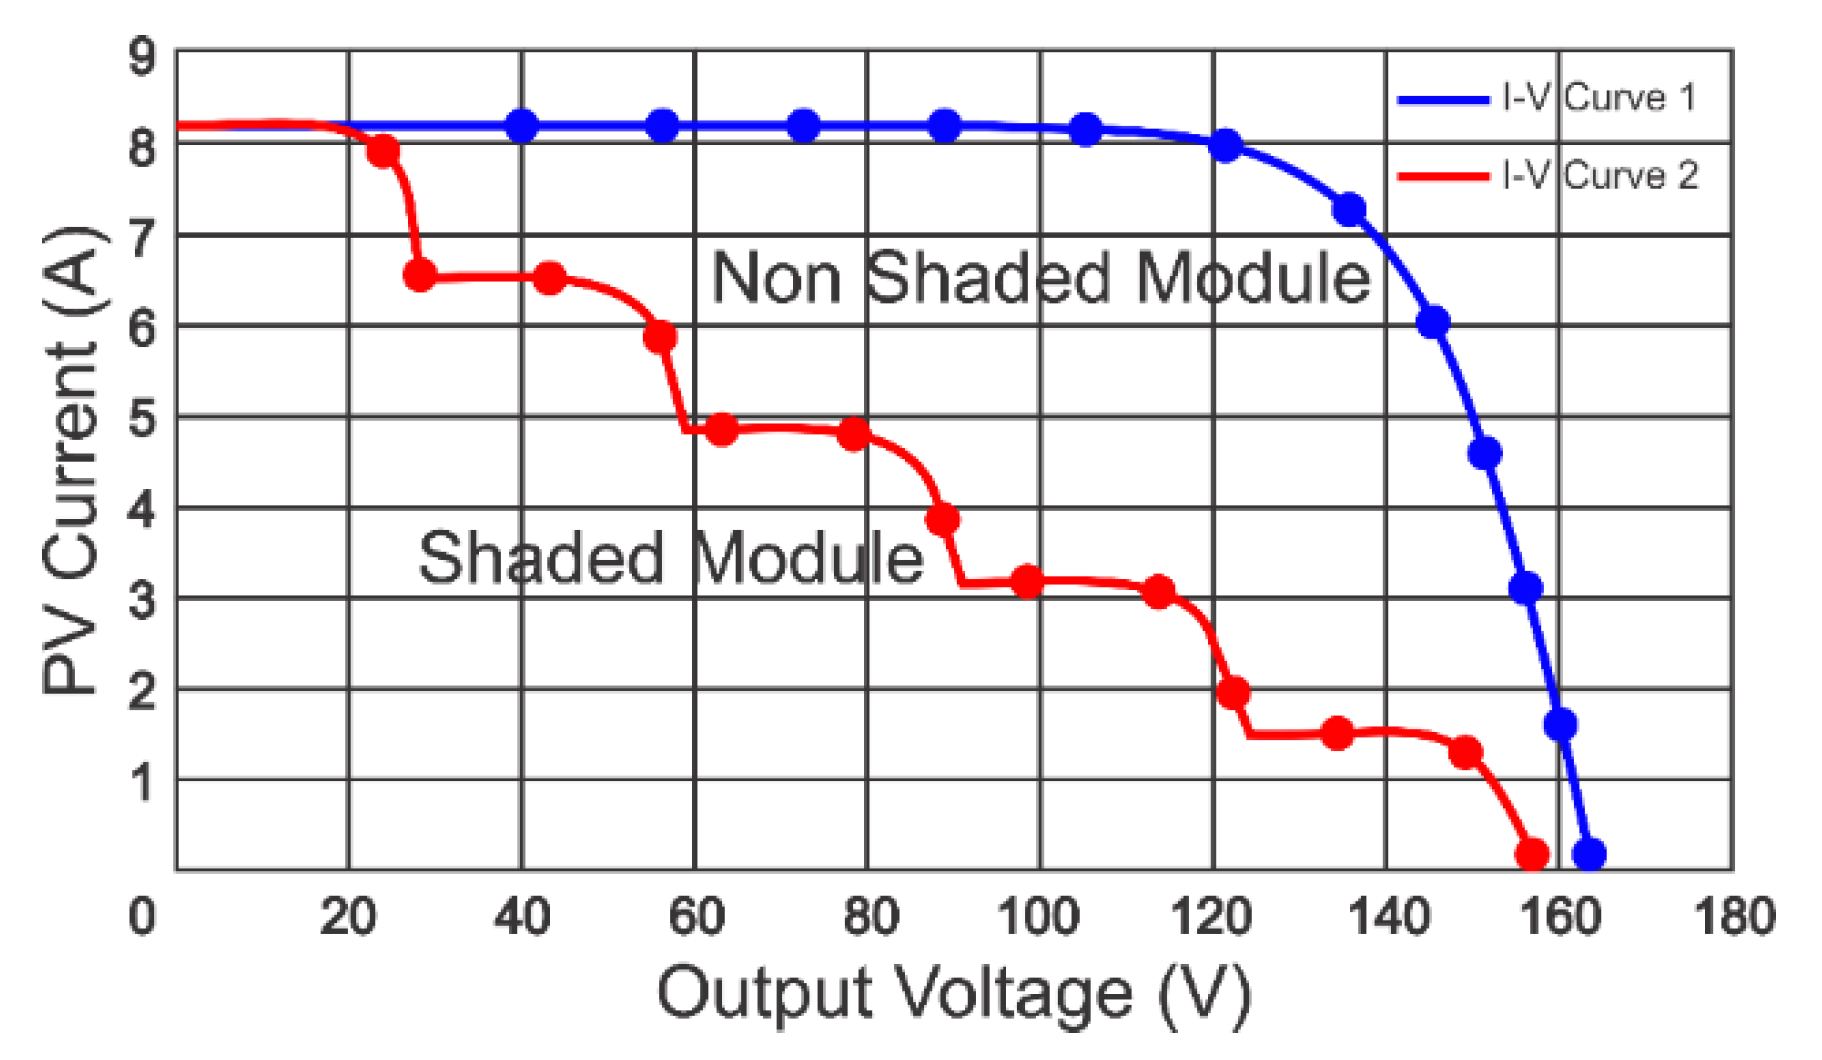
| No of Modules | 1st Peak | 2nd Peak | 3rd Peak | 4th Peak | 5th Peak | 6th Peak | 7th Peak | 8th Peak | 9th Peak | 10th Peak |
|---|---|---|---|---|---|---|---|---|---|---|
| 1 | 26.3 | |||||||||
| 2 | 26.3 | 52.64 | ||||||||
| 3 | 26.3 | 52.64 | 78.96 | |||||||
| 4 | 26.3 | 52.64 | 78.96 | 105.28 | ||||||
| 5 | 26.3 | 52.64 | 78.96 | 105.28 | 131.6 | |||||
| 6 | 26.3 | 52.64 | 78.96 | 105.28 | 131.6 | 157.92 | ||||
| 7 | 26.3 | 52.64 | 78.96 | 105.28 | 131.6 | 157.92 | 184.24 | |||
| 8 | 26.3 | 52.64 | 78.96 | 105.28 | 131.6 | 157.92 | 184.24 | 210.56 | ||
| 9 | 26.3 | 52.64 | 78.96 | 105.28 | 131.6 | 157.92 | 184.24 | 210.56 | 236.88 | |
| 10 | 26.3 | 52.64 | 78.96 | 105.28 | 131.6 | 157.92 | 184.24 | 210.56 | 236.88 | 263.2 |
Publisher’s Note: MDPI stays neutral with regard to jurisdictional claims in published maps and institutional affiliations. |
© 2021 by the authors. Licensee MDPI, Basel, Switzerland. This article is an open access article distributed under the terms and conditions of the Creative Commons Attribution (CC BY) license (https://creativecommons.org/licenses/by/4.0/).
Share and Cite
Tayyab, H.M.; Javed, Y.; Ullah, I.; Dogar, A.A.; Ahmed, B. A Hybrid MPPT Technique for Solar Photovoltaic System under Partial Shading. Eng. Proc. 2021, 12, 28. https://doi.org/10.3390/engproc2021012028
Tayyab HM, Javed Y, Ullah I, Dogar AA, Ahmed B. A Hybrid MPPT Technique for Solar Photovoltaic System under Partial Shading. Engineering Proceedings. 2021; 12(1):28. https://doi.org/10.3390/engproc2021012028
Chicago/Turabian StyleTayyab, Hafiz Muhammad, Yaqoob Javed, Irfan Ullah, Abid Ali Dogar, and Burhan Ahmed. 2021. "A Hybrid MPPT Technique for Solar Photovoltaic System under Partial Shading" Engineering Proceedings 12, no. 1: 28. https://doi.org/10.3390/engproc2021012028
APA StyleTayyab, H. M., Javed, Y., Ullah, I., Dogar, A. A., & Ahmed, B. (2021). A Hybrid MPPT Technique for Solar Photovoltaic System under Partial Shading. Engineering Proceedings, 12(1), 28. https://doi.org/10.3390/engproc2021012028