Proceeding Paper

Short Term Load Forecasting for Electric Power Utilities: A Generalized Regression Approach Using Polynomials and Cross-Terms †

1
Department of Planning and Design, Lahore Electric Supply Company, Lahore 54000, Pakistan
2
U.S. Pakistan Centers for Advanced Studies in Energy, National University of Sciences and Technology (NUST), Islamabad 44000, Pakistan
3
School of Engineering and Applied Science, Mechanical Engineering and Design, Aston University, Birmingham B4 7ET, UK
4
Department of Electrical Engineering, Mirpur University of Science and Technology (MUST), Mirpur 10250, Pakistan
5
Pakistan Meteorological Department, Islamabad 46000, Pakistan
6
Department of Load Forecast-Power System Planning, NTDC, Lahore 54000, Pakistan
7
Department of Electrical Engineering, College of Engineering, Majmaah University, Al-Majmaah 11952, Saudi Arabia
*
Author to whom correspondence should be addressed.
Presented at the 1st International Conference on Energy, Power and Environment, Gujrat, Pakistan, 11–12 November 2021.
Eng. Proc. 2021, 12(1), 21; https://doi.org/10.3390/engproc2021012021
Published: 23 December 2021
(This article belongs to the Proceedings of The 1st International Conference on Energy, Power and Environment)

Abstract

:
With the emergence of advanced computational technologies, the capacity to process data for developing machine learning-based predictive models has increased multifold. However, reliance on the model’s mere accuracy has swiftly shifted attention away from its interpretability. Resultantly, a need has emerged amongst forecasters and academics to have predictive models that are not only accurate but also interpretable as well. Therefore, to facilitate energy forecasters, this paper advances the knowledge of short-term load forecasting through generalized regression analysis using high degree polynomials and cross terms. To predict the irregularly changing energy demand at the consumer level, the proposed model uses a time series of an hourly load of three years of an electricity distribution company in Pakistan. Two variants of regression analysis are used: (a) generalized linear regression model (GLRM), and (b) generalized linear regression model with polynomials and cross-terms (GLRM-PCT) for comparative reasons. Experiments revealed that GLRM-PCT showed higher forecasting accuracy across a variety of performance metrics such as mean absolute percentage error (MAPE), mean absolute error (MAE), root mean squared error (RMSE), and r-squared values. Moreover, the enhanced interpretability of GLRM-PCT also explained a wide range of combinations of weather variables, public holidays, as well as lagged load and climatic variables.

1. Introduction

Electric power grids are evolving. As newer technologies are introduced, the behavior of both the grids and the consumers changes. To mediate between the continuously changing dynamics of grid and electricity consumers, electric utilities perform short term load forecasts (STLFs). These forecasts are aimed at, but not limited to, demand side management, unit commitment, peak demand shifting, and load scheduling [1,2]. Time leads for an STLF may vary from minutes to weeks ahead [1]. Over these time leads, many studies have appeared in the literature addressing a variety of business needs of the respective utility while using different forecasting methodologies [3]. However, almost all the load forecast studies that were carried out for the electric utilities of Pakistan primarily used artificial neural networks (ANNs) to demonstrate the forecasting accuracies of their models [4]. In contrast to this, regression analysis has not yet been used as a principal forecasting approach in any load forecast study for Pakistan’s power distribution sector. This resulted in a situation where forecasters in electric utilities in Pakistan were able to forecast with certain reliability, as well as high accuracy, but had no means to interpret the black-box modelling structures of ANNs (i.e., the global approximators).
Considering the prevailing challenges of low-resolution interpretability of ANN-based forecast models, the authors of this research have developed an accurate as well as an interpretable forecast model using load time series of Islamabad electric supply company (IESCO). The methods used in this study include a generalized linear regression model and a generalized linear regression model with polynomials and cross terms. Finally, the study offers the following major contributions to the existing scientific knowledge on the subject matter:
  • GLRM-PCT serves as a benchmark STLF model for electric utilities in Pakistan;
  • Use of synthetic weather stations for STLF models in electric utilities of Pakistan;
  • High-resolution interpretability, unlike previously developed black-box models;
  • Incorporates a diverse combination of both quantitative and qualitative variables;
  • The proposed model also takes advantage of the recency effects;
  • Evaluation using five different performance metrics for a broader readership.

2. Methodology

2.1. Data Collection and Model Development

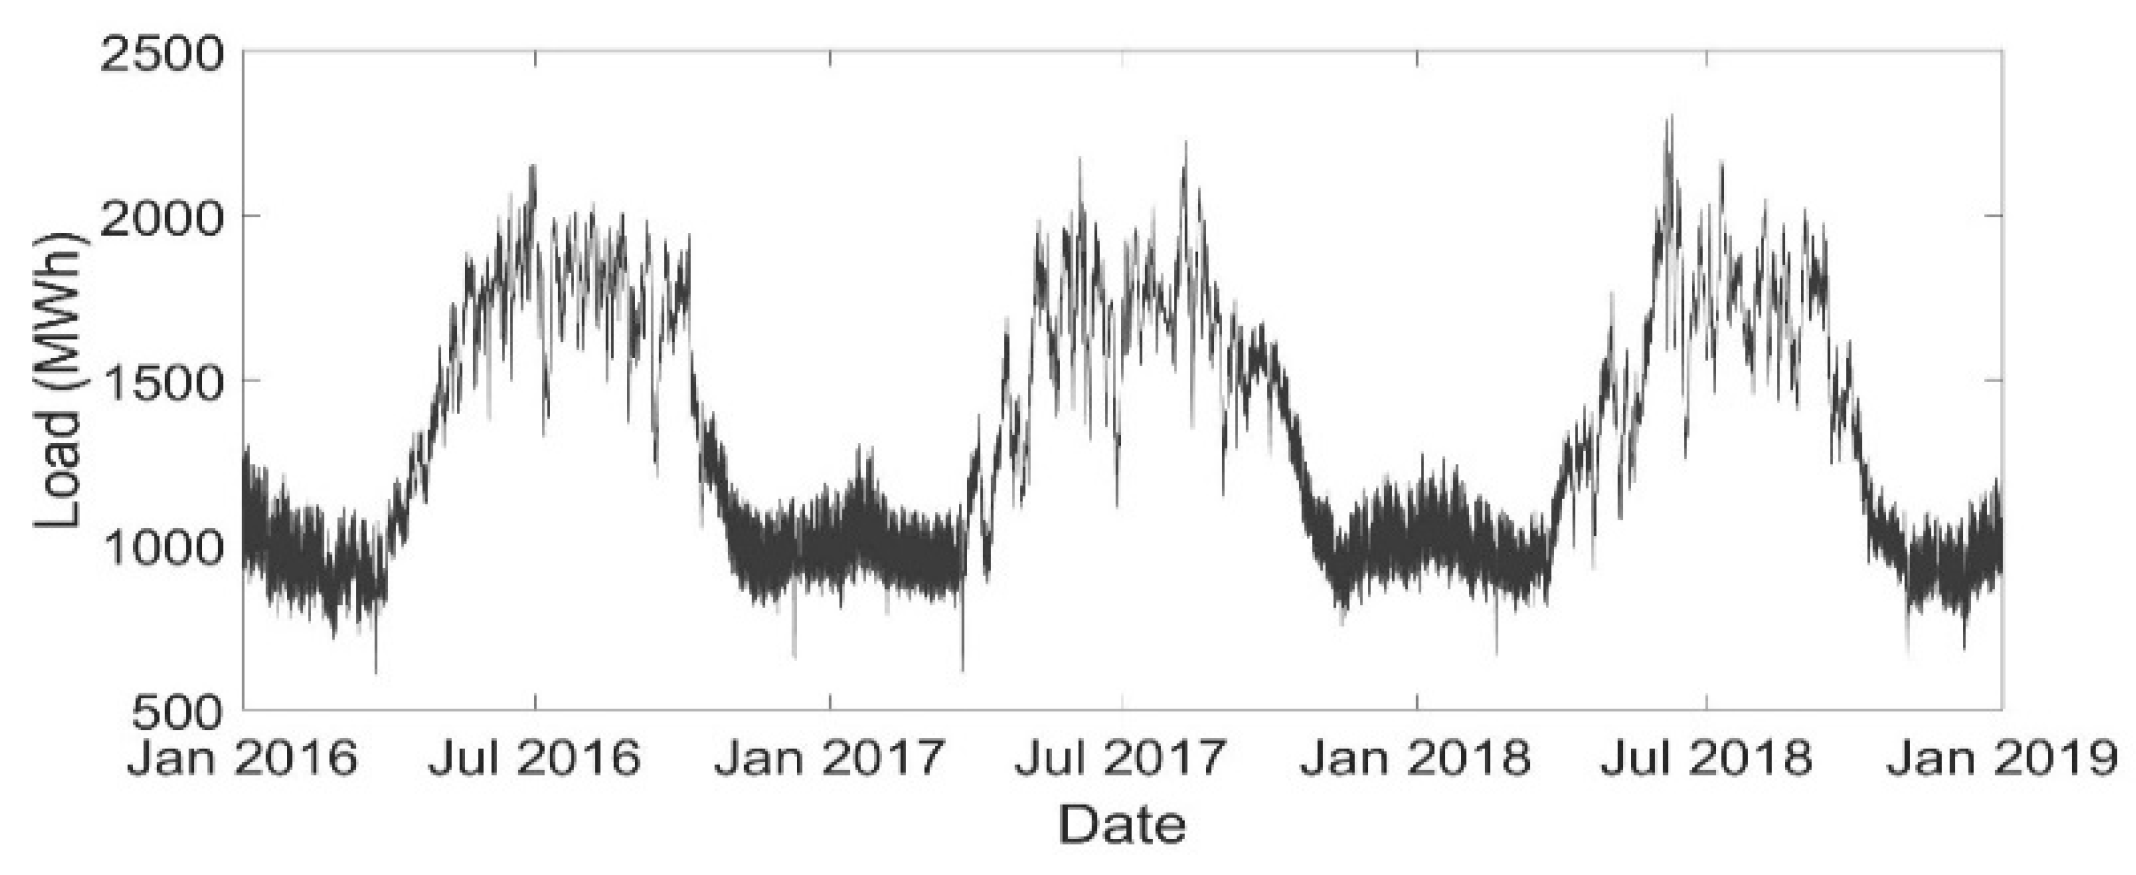
2.1.1. Target Variable; Load

The load time series used in this study consists of hourly load observations recorded between January of 2016 to December of 2018 as shown in Figure 1. After cleaning the data, load observations from January 2016 to December 2017 were used for training the model. Following the training, the model was run on an unseen load time-series from January 2018 to December 2018 to test its forecasting accuracy.

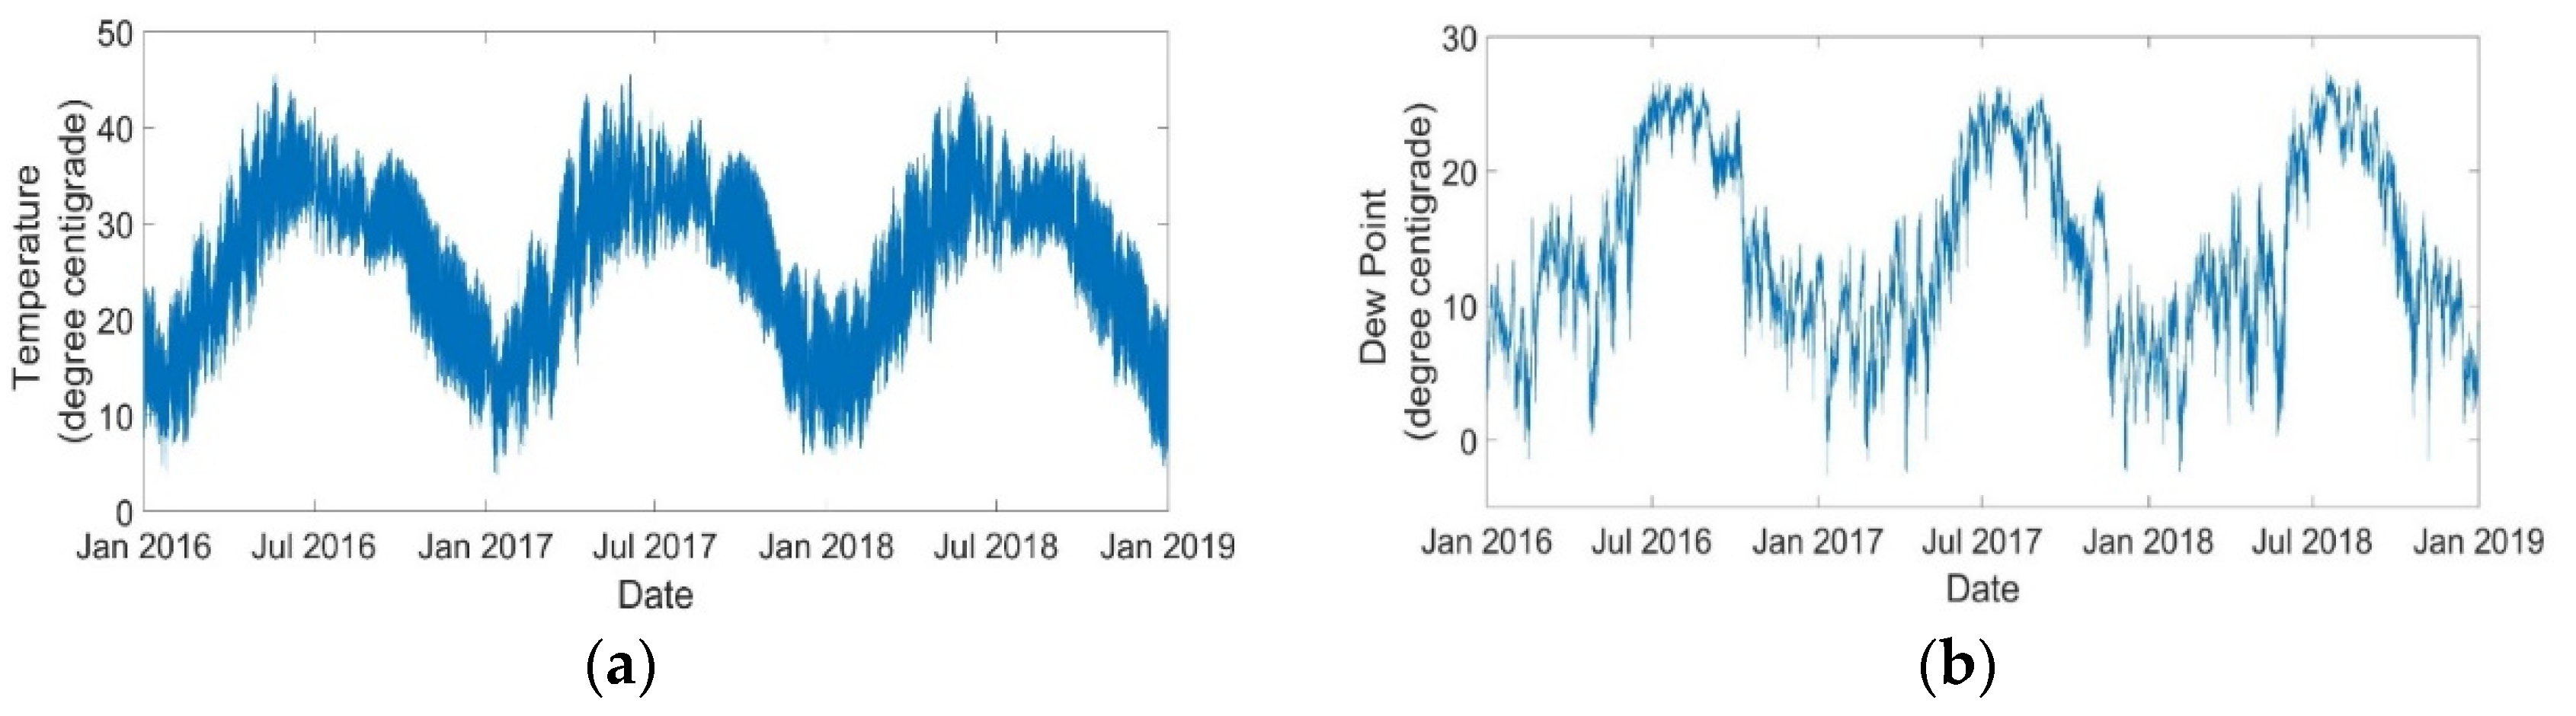
2.1.2. Demand Determinants

While developing a synthetic weather station, data for dry bulb temperature and dewpoint temperature were collected for eight different weather stations and averaged together. These data were acquired from an open access online data store and are shown in Figure 2a,b [5]. In addition to quantitative variables, this study has also incorporated some qualitative/class variables for their significance in load forecasting studies. These include variables such as weekdays and weekend effects, seasons (summers and winters), holiday effects and special events, hour of the day, day of the week, and month of the year etc.
Any time series can be well predicted by incorporating its own lagged variations as one of the predictor variables. Therefore, lagged variables that have been incorporated in this study are previous 24-h average load, previous 24-h average temperature, previous 24-h average dew point, prior day same hour load, prior day same hour temp, prior day same hour dew point, prior week same hour load, prior week same hour temp, and prior week same hour dew point.

3. Forecasting Techniques

3.1. Multiple Linear Regression

In load forecasting, the multiple linear regression method is used to seek a statistical insight into the relationship between dependent and independent variables. Regression analysis does so by using ordinary least square estimation to draw a linear relationship between load and its determinants. Mathematically, it can be represented as below.
Y = β 0 + β 1 X 1 + β 2 X 2 + β 3 X 3 + + β n X n + e
This is sometimes also known as the generalized linear regression model (GLRM). In the above expression, Y corresponds to the dependent variable and X 1 , X 2   , X 2 , , X n correspond to the independent variables, whereas β 0 ,     β 1 ,   β 2 , β 3 , ,   β n are the regression coefficients and e is the error between actual values and forecasted values.

3.2. Multiple Linear Regression with Polynomials and Cross Terms

Similarly, there can be multiple variants of a GLRM. For example, a GLRM can have polynomials and cross-terms (PCT) of its own independent variables. This makes a special case for a GLRM as GLRM-PCT, hence enhancing the predictive power of the model. One such example of a GLRM-PCT model with three independent variables is mathematically represented in (2).
Y = β 0 + β 1 X 1 + β 2 X 2 + β 3 X 1 2 + β 4 X 2 X 3 + β 4 X 1 3 X 2 X 3 + e
However, in this study, a pure quadratic regression model with upper second class polynomials and cross-terms was used. This constituted a combination of 102 variations of fifteen independent variables that were initially used in a simple GLRM model.

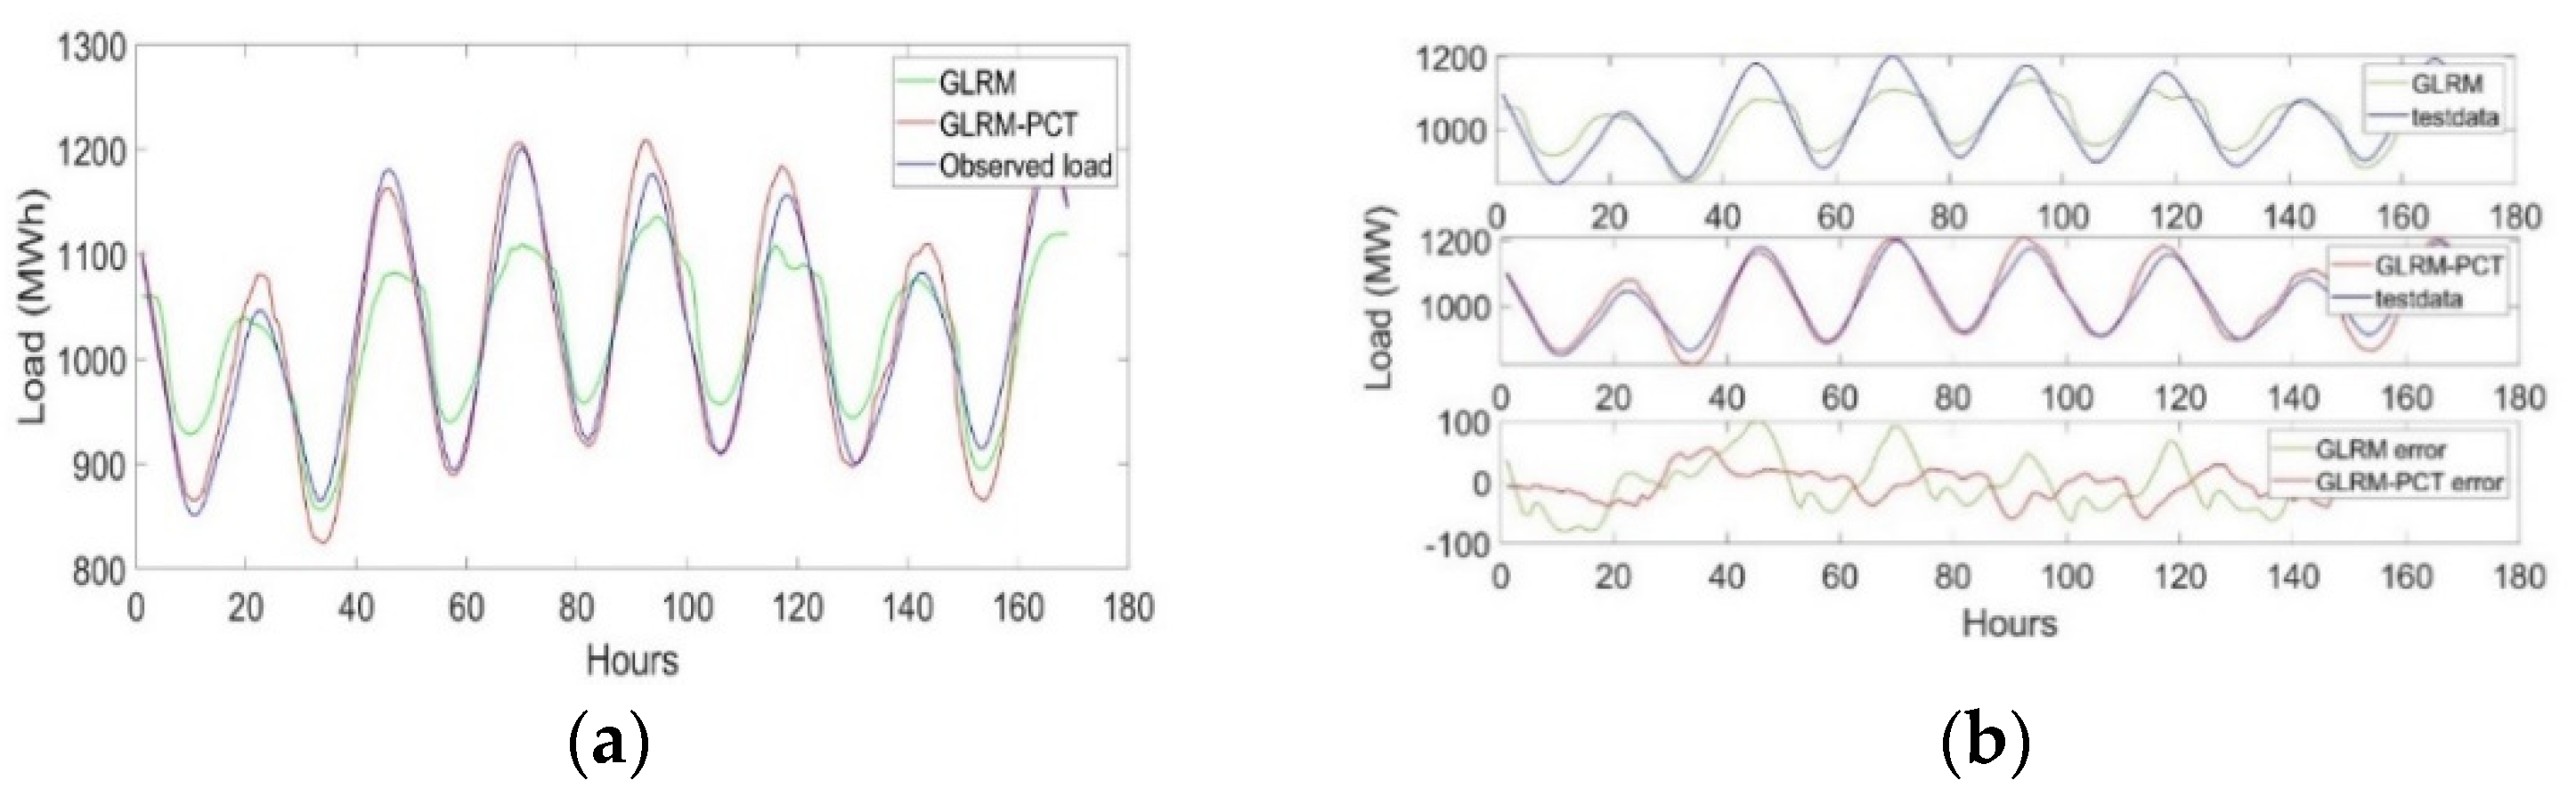
4. Results and Discussion

Following the simulations, this study used different performance metrics to evaluate the final forecasts. These include mean absolute error (MAE), mean absolute percentage error (MAPE), root mean squared error (RMSE), coefficient of determination (i.e., r-squared values), as well as adjusted r-squared values. These results are shown in Table 1.
While looking at MAPE results, GLRM-PCT results show only 2.83% error as compared to simple GLRM with the MAPE of 3.54%. In other words, GLRM-PCT was 97.17% accurate as compared to GLRM’s accuracy of 96.46%. This also indicates a choice between parsimony and accuracy that is crucial for forecasters to make in electric utilities. For example, as a less parsimonious model, GLRM-PCT used a larger set of explanatory variables (including polynomials and cross-terms) and showed enhanced forecasting accuracy as shown in Figure 3a. Whereas in GLRM, the model used comparatively fewer explanatory variables; hence simple but less accurate.
It can also be noted that a simple GLRM tends to under forecast on the peaks and over forecast on the load valleys much more than the GLRM-PCT, thereby forecasting around the mean value of the load curve. To further elaborate on the behavior of both models, Figure 3b illustrates the error terms that these models produced while producing their individual forecasts. It can be noted that the simple GLRM method produced higher error values around load peaks compared to the GLRM-PCT method.

5. Conclusions

To facilitate the electric power utilities in Pakistan, this study utilized multiple linear regression with and without higher-order polynomials and cross terms. To conceive a representative model for Pakistan, 15 different explanatory variables were used to forecast load using GLRM while 102 variations of these 15 independent variables were used in the GLRM-PCT model. Simulations showed that GLRM-PCT had less forecasting error as compared to a simple GLRM model. It was also concluded that the superior forecasting power of GLRM-PCT was due to the second-degree polynomials and the cross-terms it used. This also enhanced its interpretability as compared to the simple GLRM model.

Conflicts of Interest

The authors declare no conflict of interest.

References

  1. Hong, T.; Fan, S. Probabilistic electric load forecasting: A tutorial review. Int. J. Forecast. 2016, 32, 914–938. [Google Scholar] [CrossRef]
  2. Mir, A.A.; Alghassab, M.; Ullah, K.; Khan, Z.A.; Lu, Y.; Imran, M. A Review of Electricity Demand Forecasting in Low and Middle Income Countries: The Demand Determinants and Horizons. Sustainability 2020, 12, 5931. [Google Scholar] [CrossRef]
  3. Hu, R.; Wen, S.; Zeng, Z.; Huang, T. A short-term power load forecasting model based on the generalized regression neural network with decreasing step fruit fly optimization algorithm. Neurocomputing 2017, 221, 24–31. [Google Scholar] [CrossRef]
  4. Abbas, F.; Feng, D.; Habib, S.; Rahman, U.; Rasool, A.; Yan, Z. Short Term Residential Load Forecasting: An Improved Optimal Nonlinear Auto Regressive (NARX) Method with Exponential Weight Decay Function. Electronics 2018, 7, 432. [Google Scholar] [CrossRef] [Green Version]
  5. Copernicus. Available online: https://cds.climate.copernicus.eu/cdsapp#!/dataset/reanalysis-era5-pressure-levels (accessed on 14 July 2020).
Figure 1. Hourly observations of IESCO’s load time series.
Engproc 12 00021 g001
Figure 2. Timeseries of meteorological parameters (a) dry bulb temperature; (b) dewpoint.
Engproc 12 00021 g002
Figure 3. Model’s performance: (a) forecasting performance of GLRM and GLRM-PCT; (b) resulting error terms of GLRM and GLRM-PCT.
Engproc 12 00021 g003
Table 1. Performance evaluation of the proposed models.
Forecasting TechniquesPerformance Metrics
MAE (MW)MAPE (%)RMSE (MW)R-SquaredAdjusted r-Squared
TrainTestTrainTestTrainTest
GLRM43.34945.8153.3383.54459.35161.470.9720.972
GLRM-PCT35.34936.8832.6682.8350.6251.1080.9810.981
Publisher’s Note: MDPI stays neutral with regard to jurisdictional claims in published maps and institutional affiliations.

