Abstract
In power distribution systems of many countries, service lines are directly connected to the consumer meters without any load management system. Conventional meters lack in internal power quality measurement, and utility also cannot measure the power factor and other values during the month. This study aims to design a smart kit that aids conventional single-phase energy meters and calculates the power values of all phases by measuring the voltage, current, and power factor on the load side; and the calculated power values will be sent to the cloud data base Voltage and current are measured by a current transformer (CT) and a potential transformer (PT) connected on both the incoming side and the load side in order to avoid meter bypassing. A program-based algorithm has also been developed to calculate the power factor and other power quantities. This IoT-based energy meter uploads the measured quantities to an online database, and the same are also displayed on an LCD meter. An Android™-based application is also developed for user-end control. Consumers can observe the resultant values, switch loads remotely, and pay electricity bills through the same application. When the power factor of any consumer is less than the standard value, the system will automatically notify utility company about the affecting load.
1. Introduction
Electrical energy plays an important role in the industrial and economic development of any country. In order to reduce electricity costs, countries should utilize their available natural resources as much as possible [1]. Old transmission and distribution networks cause line losses in the system [2]. In Pakistan, service lines are directly connected to the consumer meters without any load management systems. Open-wire connection is commonly seen in every street. Consumers have no access to their energy meters, and cannot monitor their power demands and energy consumption records. Rather than line losses, power theft is a critical issue that should be resolved as soon as possible. Countries with strong economies have improved metering systems and closed-loop networks for distribution to overcome the power quality issues [3]. Home automation is a new concept in the engineering field, to which a lot of research and development is being devoted [4]. The purpose of home automation is to allow users to monitor and control home appliances remotely via the Internet [5,6]. Another problem with this outdated system is that there are no peak and off-peak time differences at the consumer end. Supply companies completely shut off whole feeder lines when the system is overloaded during peak times [7].
The main drawback of the conventional meters currently in use is that they have no internal power quality measuring system. The supply company only gets PF and other values after a month. The other lacking point is that more than 60% of power systems are based on domestic consumers, but there is no system available to measure the power factor or power quality levels for such consumers [8]. In industrial applications, power-related factors must be measured in order to judge the quality of electric power delivered. There should be a mechanism to differentiate between power and light loads [8]. The energy meter proposed in this paper is an IoT device linked with an Android application to monitor and control the connected loads; it measures power quantities, the real-time load, and the real-time power factor [9]; it also offers a smart billing method through online banking via the Android application.
2. Design and Implementation
2.1. Power Factor Measurement
The power factor is the cosine of the angle between voltage and current. To practically measure the power factor of the connected load, it is necessary to measure the phase angle of both the voltage and current signals, which can be easily measured with an oscilloscope, but in order to measure this with digital devices it is first necessary to convert it into pulses for which an operational amplifier is used in comparator mode. Two operational amplifiers are used for voltage and current signals.
2.2. Power Quantities Measurement
Active power is the product of the voltage, current, and power factor, measured in Watts, which is the actual power consumed by the load. Reactive power is the product of voltage, current, and the sine of the phase angle, measured in VARs, representing the power consumed by capacitors or inductors that is not usable and results in losses. Apparent power is the product of voltage and current, measured in VA, and represents the actual amount of power that is generated and can be available to the consumer.
2.3. Database and Android Communication
This smart energy meter is also an IoT device with which the user can control their home appliances remotely. To communicate with the Android application, an intermediate link is provided by a Firebase cloud database in order to store data that can also be accessed by an ESP microcontroller and Android application. ESP stores data on three power quantities—power factor load current, line voltages, and the state of load switches—and updates data whenever values change.
2.4. Measurement of Units
In order to connect the designed smart kit with the energy meter, an optocoupler was used that reads the pulse value and feeds it to the microcontroller. The ESP microcontroller is programmed similarly to the energy meter, and counts LED blinks. If the value reaches 3200, it will increase the units consumed by one. As the prepaid smart energy meter is also used for prepaid billing, it receives balance from the Android application via the Firebase database, and then calculates the credit units by dividing it by the rate per unit.
The microcontroller differentiates between consumed units and credit units. If credit units are greater than one, the Arduino will turn ON relays to connect the load, and will keep counting consumed units when the LED blinks. In that case, the consumed units increase and the credit units decrease. The increases and decreases in the values are calculated as follows:
2.5. Circuit Diagram
Figure 1 shows the circuit diagram, which is further divided into three categories. The power circuit of the energy meter contains a traditional energy meter, CT, and relays for the switching of loads that contain high voltages on terminals, which are further connected to power supply circuits to obtain low-voltage DC power for relays and the optocoupler, and also connect the CT to its conditioning circuit. In this smart energy meter, we need three voltage levels: 12 V for relays, 5 V for the CT and other transistors, and 3.3 V for the ESP32 microcontroller. In the power supply circuit, a full-wave bridge rectifier is used to convert AC into DC, giving a voltage of 12 V, which is further converted to 5 V and 3.3 V by the voltage regulator and buck converter. The secondary CT and PT are connected to the signal conditioning circuit for conversion. The output of this circuit is combined for the control circuit. The control circuit of the smart energy meter contains an ESP32 microcontroller, an OLED display for showing results on the screen, and a real-time clock (RTC) for disconnecting the power load when peak time starts. NPN-type transistors are used for controlling relays that that turn the light and power loads on or off. There is also an external power source option available for the ESP32 when supply power is not available.
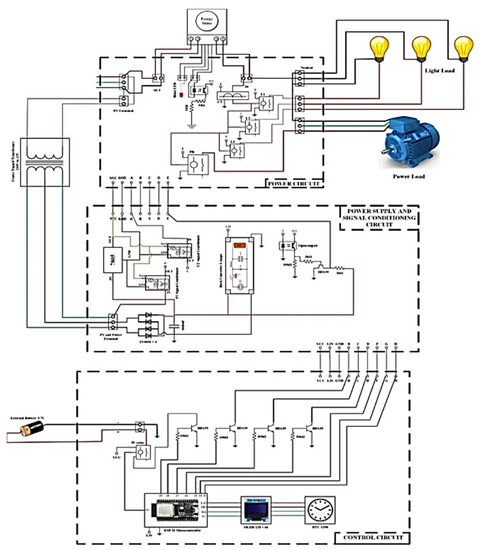
Figure 1.
Complete circuit diagram of the smart energy meter.
3. Results and Discussion
Inside the smart energy meter there are two sensors connected, which interact with the incoming power line or source. One potential transformer is connected on the incoming side to measure the line voltages, and one current transformer is connected on the load side to measure the load current. The power factor is then calculated by comparing the phase angles of these CT and PT waveforms using a microcontroller. All three power quantities are calculated based on the real-time voltage and current values. Both voltage and current waveforms first need to be converted into pulse forms from sinusoidal forms. Hence, there is a possibility of error in the active and reactive power values, but there will be less error in the apparent power value because it only depends on voltage and current. The apparent power value is independent from the power factor value. Most of the load part is based on the inductive type, and there is always power factor lag on the system. Thus, for checking the load power factor, we use a test energy meter with a low power factor. Incandescent lamps can be used for low power factor testing. In the final hardware we used an incandescent lamp rather than an induction motor. The lowest power factor value for one 200 W incandescent lamp is 0.9. In this smart energy meter, we connect three loads: LED bulbs, and 60 W incandescent lamps, and one power load—a 200 W incandescent lamp. The smart energy meter also measures peak time and off-peak time as defined by the grid. In this demo, peak time is from 6 p.m. to 8 p.m. At that time, the power load will be cut off from the supply no matter whether the user turned it on from the application. The power load will only be turned on during off-peak time. This is a proposed method to reduce load from the grid during peak times, as the grid needs to turn off specific areas during peak times. Hence, a technique is proposed to automatically turn off heavy power loads from the supply during peak times, while light loads will remain connected. This will also help to remove the heavy load of UPS batteries from the grid, which are now intended for people to use because of load shedding. In normal conditions, voltage ranging from 230 V to 280 V is required, and the meter performs its actions normally. In case of overvoltage faults, an autotransformer is used, which changes its turn ratio until the voltage rises to 280 V. In order to handle undervoltage faults, the turn ratio of the autotransformer is changed until it reaches 180 V or sless. In both cases, the meter identifies the fault and responds by turning off the load.
4. Conclusions
In this project, we proposed and implemented the design of a power-quality-measuring smart energy meter based on the Internet of Things (IoT), monitored and controlled by an Android application. An ESP32 is used as the main microcontroller, which is used for the measurement of PF; active, reactive, and apparent power quantities; tracking of peak time; and home automation. A technique has also been proposed to reduce load from the grid during peak time by simply disconnecting power loads rather than complete disconnection of feeders. This smart energy meter can reduce the heavy loads of UPS batteries when no blackouts occur in areas, as light loads will remain active during peak times. The new billing features can help to reduce the heavy load of taxes, which appears to be a non-resolvable issue in Pakistan’s economy. We have successfully designed and tested a smart energy meter with automatic power load disconnection during peak time, and it completely satisfies our aims. The proposed meter can be used in practice to overcome the targeted issues.
References
- Faheem, J.B. Energy Crisis in Pakistan. IRA-Int. J. Technol. Eng. 2016, 3, 1–16. [Google Scholar] [CrossRef][Green Version]
- Ren, D.; Li, H.; Ji, Y. Home energy management system for the residential load control based on the price prediction. In Proceedings of the 2011 IEEE Online Conference on Green Communications, (Online Conference), Piscataway, NJ, USA, 26–29 September 2011; pp. 1–6. [Google Scholar]
- Balasubramaniam, P.M.; Prabha, S.U. Power quality issues, solutions and standards: A technology review. J. Appl. Sci. Eng. 2015, 18, 371–380. [Google Scholar]
- Barman, B.K.; Yadav, S.N.; Kumar, S.; Gope, S. IOT Based Smart Energy Meter for Efficient Energy Utilization in Smart Grid. In Proceedings of the 2nd International Conference on Energy, Power and Environment: Towards Smart Technology, ICEPE 2018, Shillong, India, 1–2 June 2018. [Google Scholar]
- Muralidhara, S.; Hegde, N.; Rekha, P.M. An internet of things-based smart energy meter for monitoring device-level consumption of energy. Comput. Electr. Eng. 2020, 87, 106772. [Google Scholar] [CrossRef]
- Talwar, P.D.; Kulkarni, S.B. IOT Based Energy Meter Reading. Int. J. Recent Trends Eng. Res. 2017, 2, 61–65. [Google Scholar]
- Patil, S.; Pawaskar, G.; Patil, K. Electrical Power Theft Detection and Wireless Meter Reading. Int. J. Innov. Res. Sci. Eng. Technol. 2013, 2, 1114–1119. [Google Scholar]
- Risteska Stojkoska, B.L.; Trivodaliev, K.V. A review of Internet of Things for smart home: Challenges and solutions. J. Clean. Prod. 2017, 140, 1454–1464. [Google Scholar] [CrossRef]
- Agarwal, A.; Kumar, S.; Ali, S. A Research Review of Power Quality Problems in Electrical Power System. MIT Int. J. Electr. Instrum. Eng. 2012, 2, 88–93. [Google Scholar]

Publisher’s Note: MDPI stays neutral with regard to jurisdictional claims in published maps and institutional affiliations. |
© 2021 by the authors. Licensee MDPI, Basel, Switzerland. This article is an open access article distributed under the terms and conditions of the Creative Commons Attribution (CC BY) license (https://creativecommons.org/licenses/by/4.0/).