Abstract
Pre-defined motion command profiles enable precise positioning and dynamic control in mechanical and mechatronic systems, maximizing efficiency and reliability. Real-world applications introduce dynamic factors like mechanical compliance, friction, and external disturbances that significantly impact system performance. Understanding these influences improves motion control strategy accuracy, robustness, and system stability. This study emphasizes the role of systematic and stochastic disturbances in improving motion control and accuracy. It introduces a structured method for evaluating system behavior under realistic operational conditions using advanced vibration analysis and spatio-temporal similarity measures. Using vibration indicators like amplitude, frequency content, phase relationships, crest factor, and acceleration root mean square (RMS) values, a comprehensive framework is created to quantify motion profile deviations. These indicators identify resonant frequencies, transient disturbances, and system inconsistencies, improving compensation strategies and predictive maintenance. A key contribution of this research is the comparison of quantification methods for motion precision and robustness integrating vibration diagnostics and advanced motion similarity analysis to improve motion control and assessment. Multi-faceted motion deviation characterization is achieved by combining displacement, velocity, and acceleration measurements with statistical and mathematical analysis. To assess motion consistency, spatio-temporal similarity measures like Dynamic Time Warping (DTW), Hausdorff distance, and discrete Fréchet distance capture spatial alignment and temporal progression. These measures allow a more nuanced evaluation of motion quality than traditional error metrics, especially in variable-speed dynamics, sampling rate inconsistencies, and complex motion patterns. Frequency-domain methods like FFT and wavelet transforms detect oscillatory behaviors to improve motion analysis reliability. The study uses spectral analysis and time–frequency domain techniques to detect motion inconsistencies that may cause mechanical wear, instability, or energy waste. Crest factor analysis and phase relationship assessment can also detect misalignment, structural resonance, and transient perturbations that conventional metrics miss.
1. Introduction
Mechanical vibrations are present in numerous applications, as they naturally arise wherever there is motion coupled with non-negligible inertia and finite stiffness [1]. Whether dealing with purely mechanical structures [2], mechatronic devices [3], or even complex fluid–structure interactions [4], vibrations can exert a significant influence on system performances [5], longevity [6], and functionality [7]. Different utilization fields—ranging from industrial systems [8] and manufacturing equipment [9] or transportations [10] to medical devices [11] and diagnostic tools [12]—exhibit meaningful vibratory effects. In most scenarios, vibrations are undesired, imposing challenges such as increased wear [13], reduced efficiency [14], noise generation [15], and potential safety issues [16]. Consequently, considerable research efforts have been devoted to mitigating [17] or attenuating [18] these phenomena through the design of suitable actuators [19], sensors, and control strategies. However, in certain cases [20], vibratory motions can assume useful behavior for positive purposes, such as ultrasonic imaging in medicine [21] or high frequency shaking in industrial material processing [22]. In these contexts, their characterization, measurement, and control are fundamental tasks, and literature presents a variety of well-established metrics to quantify key aspects of vibratory signals, including amplitude [23], frequency content [24], damping ratios [25], and resonance phenomena [26].
In industrial machinery, vibrations often originate from rotating imbalance [27], misalignment [28], or wear in components such as gears [29], bearings [30], and shafts [31]. Excessive vibrations in these systems can degrade product quality in manufacturing lines [32], accelerate fatigue of critical machine elements [33], and reduce operational efficiency [34]. As a result, industries have long relied on vibration mitigation strategies—ranging from passive damping [35] to sophisticated active control schemes—to maintain stable and predictable performance [36]. In the automotive and aerospace sectors, vibrations affect both the structural integrity and comfort levels of vehicles [37] or aircraft [38], further underscoring the broad importance of effective vibration management. From a medical perspective, vibratory phenomena serve more specialized roles. One prominent example is ultrasonic imaging [21], where controlled mechanical waves in the ultrasonic frequency range provide detailed visualizations of internal tissues. Vibrational analysis has proven essential in diagnostic and therapeutic devices, for instance, in physiotherapy equipment where targeted vibrations can aid in muscle rehabilitation [39]. Furthermore, human body tremors are associated with different pathologies and must be measured [40] and, possibly, attenuated [41]. In mechatronic systems and robotic platforms [42], unwanted vibrations can result in positioning errors and degraded control performance [43]. Researchers in robotics often examine the dynamic interplay between actuators [44], mechanical linkages [45], and feedback loops [46] to suppress vibrations and achieve precise, stable movements [47].
Beyond these direct applications, vibrations play a pivotal role in metrology, particularly in the design and operation of precision instruments [48]. Even minute oscillations can hamper the accuracy of measurement devices such as atomic force microscopes, coordinate measuring machines, and other sensitive instrumentation [49]. Consequently, strategies for vibration isolation and damping have become integral to precision engineering [50]. Moreover, the measurement of vibratory signals themselves can serve as a valuable diagnostic tool. Within condition-monitoring frameworks, for instance, characteristic changes in vibrational patterns can indicate the onset of damage or wear in machinery [51]. These changes include shifts in natural frequencies, alterations in amplitude and phase, and the appearance of new spectral components, all of which are tracked using standardized metrics. If not identified early and addressed, small mechanical defects can propagate into serious, expensive failures [52]. As a result, vibration-based condition monitoring has emerged as a critical technique in predictive maintenance, reducing downtime and operational costs.
Despite the success of standard metrics for quantifying vibrations, researchers have increasingly acknowledged that real-world vibratory signals can be highly complex, combining non-linear behaviors, multiple interacting modes, and noise [53]. In such contexts, typical metrics like peak amplitude or RMS values may only offer a partial view of the underlying dynamics. Frequency-domain methods, such as Fourier transforms or wavelet analysis, can further tease out structure in these signals, but they may still require assumptions about stationarity or linearity that do not always hold [54]. Consequently, there is considerable motivation to explore methods with broader applicability and fewer assumptions.
Although traditional metrics, such as root mean square (RMS), peak acceleration, velocity, or displacement, power spectral density (PSD), and octave band analysis, among others, remain highly effective in capturing pertinent details of oscillatory behavior [55], a growing body of work can be explored to complement or enhance conventional approaches. In particular, the concept of signal “similarity”, typically employed in fields like data analysis, pattern recognition, and image processing, has garnered interest for its potential to capture complex relationships that may not be fully encapsulated by canonical metrics [56]. This interest has been further amplified by advancements in computational power and machine learning algorithms, which offer new possibilities for analyzing high-dimensional data sets in an efficient and scalable manner [57].
In essence, similarity-based approaches provide a way to compare two signals (or two data sets) to determine how closely they resemble each other. Various similarity or distance measures—such as the cosine similarity, dynamic time warping (DTW), and correlation coefficients—can capture different aspects of the relationship between signals [56].
Recent studies illustrate the potential relevance of these approaches. For example, in structural health monitoring (SHM), some researchers have employed correlation-based techniques to detect damage by comparing the structural response at different time intervals [58]. If the structural response in a nominally healthy state can be established as a reference signal, any subsequent changes in that response can be quantified by examining signal similarity, enabling the early detection of faults. Similar strategies have emerged in rotating machinery diagnosis, where the repeatability [59] of vibratory patterns across multiple cycles or operational regimes can serve as a diagnostic fingerprint [60]. By avoiding the need to rely solely on spectral peaks or amplitude-based thresholds, similarity measures can provide a holistic view of how the entire signal shape evolves over time, capturing subtle changes that might otherwise go unnoticed.
Nevertheless, the application of similarity metrics in vibration analysis also introduces some challenges. Unlike many image or text data sets, vibratory data are often continuous in nature and can be subject to measurement noise, phase lags, and time shifts. Thus, one must carefully select and adapt the similarity measures to account for potential phase differences or time warping. Dynamic Time Warping, initially introduced for speech recognition, is one technique that can be adapted to address variations in time or speed, offering a robust way to compare signals of different lengths or with non-uniform stretching [61]. Furthermore, the computational burden of similarity-based analysis can be non-trivial, especially when dealing with large data sets or real-time monitoring requirements. Therefore, implementing efficient algorithms and leveraging parallel computing infrastructures may be necessary in practical settings.
In light of these considerations, the present work aims to investigate the feasibility of using similarity metrics as a general-purpose tool for vibration analysis. More specifically, we seek to determine whether such measures can be correlated with established vibration metrics so that they might serve as surrogates or complementary indices in industrial or laboratory contexts. By doing so, one may reduce the reliance on highly specialized vibratory models and, instead, apply universal data analysis methodologies that remain robust across different hardware platforms and operational conditions. This approach could help streamline the diagnostic process, minimizing the need for parameter tuning and model customization while still delivering actionable insights.
2. Materials and Methods
In this testing campaign, a nominal (commanded) motion profile is defined and employed as reference. A set of realistic motion profiles is then generated by superimposing vibration signals onto this reference, thereby simulating operational disturbances. These perturbed motions are compared with the nominal ones using both commonly adopted vibration metrics from the literature and similarity measures. Finally, the correlation between the similarity measures and the vibration metrics is evaluated to determine whether similarity-based indicators accurately capture the effects of vibration on the motion profiles.
2.1. Vibrational Metrics
The vibration signals underwent quantitative analysis through multiple statistical and frequency-domain metrics extraction to fully understand their dynamic movement. The Amplitude measurement represented the difference between the highest and lowest signal values (1). The Standard Deviation (SD) (2) quantified signal dispersion around the mean. The RMS value calculation from (3) delivered both the effective vibration magnitude and energy content measurement. The Peak Value represented the highest absolute amplitude (4) and the Peak-to-Peak (P2P) amplitude (5) measured the largest signal fluctuations. The Crest Factor (CF) analysis measured vibration impulsiveness by dividing peak amplitude values by RMS values (6)) thus indicating more intense impulsive events.
The Fast Fourier Transform (FFT) analysis revealed the Dominant Frequency and its associated Dominant Amplitude which showed the main harmonic content of the signal. The Frequency Bandwidth (BW95%) represented the effective frequency range that contained 95% of the signal’s spectral energy and was determined from the cumulative energy spectrum. Kurtosis (7) and Skewness (8) statistical shape descriptors measured the distribution’s sharpness and symmetry, respectively. The vibration levels were analyzed using Mean (9) and Median xmed as central tendency measures. The ISO 10816 standard-based [51] vibration severity classification system was used with RMS values to divide the measurements into four categories: Class A (Good, RMS < 0.01), Class B (Acceptable, RMS < 0.03), Class C (Unsatisfactory, RMS < 0.07), and Class D (Unacceptable, RMS ≥ 0.07). The complete set of metrics provided strong capabilities for both detailed characterization and diagnostic analysis of vibration phenomena.
2.2. Similarity Metrics
Similarity between pairs of signals (commanded motion and realistic vibrating motion) was assessed using multiple quantitative metrics to comprehensively capture various aspects of their correspondence. The Mean Squared Error (MSE) (10) quantified average squared deviations, while the Root Mean Squared Error (RMSE) (11) provided a measure of error magnitude in the original scale. The Mean Absolute Error (MAE) (12) offered a robust indication of average absolute deviations. Linear correlation was assessed by the Pearson Correlation Coefficient (r) [62], which evaluated the strength and direction of the linear relationship between signals and is computed as in (13), where and represent the means of the respective signals. Vector-based similarity measures included the Euclidean Distance (14) indicating the magnitude difference [63], and Cosine Similarity (15) capturing directional similarity irrespective of amplitude differences [64]. A discretized Jaccard Index assessed overlap between sets A and B derived from binned signal amplitudes and is computed as in (16) [65]. Temporal alignment was examined through Dynamic Time Warping (DTW) [61], which finds the optimal alignment minimizing cumulative distance, accommodating temporal variations between signals, and is computed recursively as in (17) with the boundaries in (18). The Normalized Cross-Correlation (NCC) (19) quantified similarity considering lag and timing differences [66]. The adapted one-dimensional Structural Similarity Index (SSIM) (20) evaluated perceptual similarity based on mean (μ), variance (σ2), and covariance (σxy) [67]. Point-wise similarity was quantified by the Percentage of Similar Points within a tolerance τ = 5% (21), reflecting the proportion of values within the predefined tolerance. Shape and local discrepancies were captured by the Hausdorff Distance [68], which computes the maximum minimal distance (22) between points of two signals A and B as defined in (23) and the Fréchet Distance [69], defining the minimum length required to traverse both signals simultaneously, sensitive to sequential correspondence, as defined in (24), where α and β are continuous, non-decreasing reparameterizations of the signal curves and computed practically as in (25) via a recurrence relation using a cost matrix c(i, j) with proper initialization at the boundaries. The discrete-pattern similarity was measured by the normalized Levenshtein Distance [70], reflecting edit operations (insertions, deletions, or substitutions) required to transform one discretized signal sequence into another (26). Lastly, the Mahalanobis Distance (27), accounted for variance normalization, enabling comparisons considering signal dispersion [71]. These diverse metrics collectively facilitated a robust, multidimensional comparison of the investigated signals.
2.3. Correlation Analysis
Correlation analysis was performed to quantify the relationships between vibration metrics and various similarity metrics. Spearman’s rank-order correlation was selected for its robustness to outliers and its capacity to detect monotonic patterns regardless of linearity [72]. Spearman’s method internally ranks the data before calculating correlation, reducing the influence of extreme values or non-normally distributed variables. Each vibration metric (e.g., oscillatory amplitude, peak frequency, or nominal RMS) was correlated with each similarity metric (e.g., Euclidean distance, cosine similarity, cross-correlation coefficient), yielding a grid of correlation coefficients ρ values. Along with the correlation values, corresponding p-values were estimated to assess the significance of each monotonic relationship. While the primary interest lay in the magnitude of correlation, significance thresholds (e.g., α = 0.05) were applied to filter out results potentially attributable to sampling variability. High positive correlations (e.g., ρ ≈ 1) were interpreted as indicating that the similarity metric rose in tandem with the vibration metric, while strongly negative correlations (e.g., ρ ≈ −1) suggested an inverse monotonic relationship.
3. Results
A comprehensive synthetic database was generated with 150 motion signal pairs (Figure 1), each consisting of a nominal and a perturbed movement. The nominal signals were produced by simulating smooth rise profiles with variable rise times randomly sampled in the range of 0.5 to 1.5 s. To model realistic perturbations typically encountered in mechanical systems, each nominal trajectory was superimposed with random oscillatory components. These oscillations were characterized by:
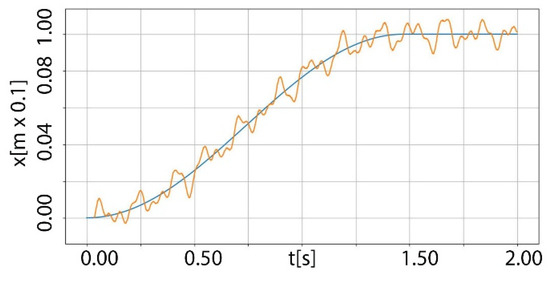
Figure 1.
Example of a signal pair: nominal (blue) and perturbed (orange).
- A random number of superimposed sine waves (3 to 7 oscillations),
- Frequency components ranging from 1 Hz to 50 Hz,
- Amplitude values between 0.01 and 0.15,
- Added white noise with an amplitude up to 0.02.
Spearman’s rank-order correlation coefficient was calculated to assess the monotonic relationship between the vibration metrics and the similarity metrics. The resulting correlation values are reported in Figure 2 and Figure 3.
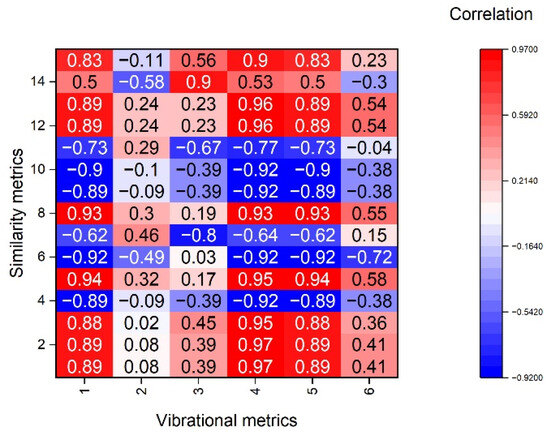
Figure 2.
Correlation matrix: similarity metrics vs. vibrational metrics. The numbers corresponding to vibrational metrics stay for: (1) oscillation amplitude, (2) standard deviation, (3) root mean square, (4) peak value, (5) peak-to-peak value, (6) crest factor. The numbers corresponding to similarity metrics stay for: (1) mean squared error, (2) root mean squared error, (3) mean absolute error, (4) Pearson correlation coefficient, (5) Euclidean distance, (6) cosine similarity, (7) Jaccard index, (8) DTW distance, (9) normalized cross-correlation, (10) structural similarity index, (11) percentage of similar points, (12) Hausdorff distance, (13) Frechet distance, (14) normalized Levenshtein distance, (15) Mahalanobis distance.
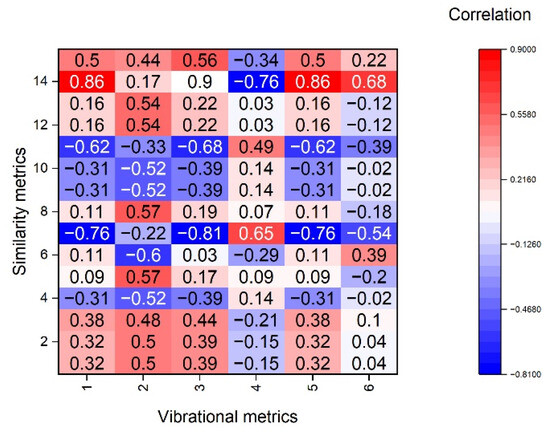
Figure 3.
Correlation matrix: similarity metrics vs. vibrational metrics. The numbers corresponding to vibrational metrics stay for: (1) dominant amplitude, (2) frequency Band Width (BW95%), (3) kurtosis coefficient, (4) skewness measure, (5) mean vibration, (6) median vibration. The numbers corresponding to similarity metrics stay for: (1) mean squared error, (2) root mean squared error, (3) mean absolute error, (4) Pearson correlation coefficient, (5) Euclidean distance, (6) cosine similarity, (7) Jaccard index, (8) DTW distance, (9) normalized cross-correlation, (10) structural similarity index, (11) percentage of similar points, (12) Hausdorff distance, (13) Frechet distance, (14) normalized Levenshtein distance, (15) Mahalanobis distance.
4. Discussion
The present study explored whether generic signal-similarity indices—widely used in data-science contexts—can serve as reliable surrogates or complements to classical vibration metrics when assessing motion quality in mechatronic systems. By superimposing realistic multi-frequency disturbances and broadband noise on 150 nominal motion profiles, and then computing a comprehensive battery of time-, frequency- and shape-based indicators, we created a controlled yet diverse corpus that enabled rigorous pairwise correlation analysis between the two families of metrics.
The Spearman matrix (Figure 2 and Figure 3) reveals two coherent clusters. Distance- or error-based similarity metrics—Mean-Squared Error (MSE), Root-MSE, Mean-Absolute Error, Euclidean, Dynamic Time Warping, Hausdorff and Fréchet distances—showed strong positive monotonic correlations (|ρ| ≥ 0.85) with amplitude-driven vibration descriptors such as peak-to-peak, RMS, standard deviation and crest factor. These measures essentially quantify absolute deviations between perturbed and nominal trajectories; therefore, larger vibration amplitudes directly inflate the calculated “distance”.
Conversely, shape-invariant similarity measures—Pearson’s r, cosine similarity and normalized cross-correlation—displayed strong negative correlations with the same vibration descriptors, reflecting the expected drop in linear alignment when disturbances grow. The adapted one-dimensional Structural Similarity Index (SSIM) mirrored this behavior, indicating that perceptual-quality criteria imported from imaging are sensitive to vibratory energy despite their origin in visual assessment.
Metrics grounded in set or sequence comparisons (Jaccard, Levenshtein, percentage of similar points) produced medium correlations (|ρ| ≈ 0.4–0.6). Their discretization or thresholding steps compress fine-grained amplitude information, explaining the attenuation relative to purely numerical distances. Interestingly, frequency-domain vibration features—dominant amplitude, BW95%—showed weaker associations with most similarity indices, except DTW, suggesting that time-warping is better suited to capture spectral spreading produced by multi-tone excitations.
These findings indicate that several off-the-shelf similarity measures can act as proxy health indicators without explicit vibration modeling. For example, a rising Euclidean distance or a falling cosine similarity could trigger maintenance alarms in real-time trajectory-tracking systems, bypassing the need for detailed spectral analysis. Moreover, because shape-based metrics are agnostic to operating frequency, they may generalize across machines with different actuation bandwidths—an advantage over narrowly tuned band-pass monitors common in industry.
The results also have implications for learning-based diagnostic frameworks: highly correlated metric pairs provide redundancy that can be pruned when designing feature vectors, whereas orthogonal pairs (e.g., DTW vs. crest factor) can enrich predictive models. Finally, the demonstrated sensitivity of SSIM and other imaging-derived indices suggests fertile cross-pollination between computer-vision quality assessment and motion monitoring.
Prior works have leveraged DTW for vibration classification in rotating machinery and used correlation coefficients for structural health monitoring, but direct, systematic benchmarking of a wide metric palette against canonical vibration descriptors has been scarce [73]. Our correlation-grid approach extends earlier case-specific studies by offering a quantitative map of metric inter-relationships over a synthetic yet statistically controlled data set, thereby filling a methodological gap highlighted in recent reviews of data-driven condition monitoring.
Several limitations temper the generality of these conclusions. First, the signal database was generated synthetically; although parameter ranges mimicked real trajectories [74], unmodelled nonlinearities, actuator saturations and sensor quantization present in hardware were absent. Second, excitation frequencies were restricted to 1–50 Hz; high-frequency resonances or impulsive shocks, common in high-speed machinery, may alter the metric landscape. Third, Spearman rank correlation captures monotonic but not necessarily causal relationships, and no attempt was made to model computational latency or memory footprint—critical factors for embedded implementations.
Future work should validate these findings on experimental data acquired from industrial robots and precision stages, extend the analysis to time–frequency similarity measures (e.g., wavelet-packet-based distances), and explore adaptive thresholding schemes that normalize similarity metrics for varying operating conditions. Integrating the most informative metric subset into closed-loop controllers—potentially via lightweight machine-learning surrogates—remains an open challenge. Finally, investigating how metric sensitivity scales with signal length and sampling rate will be essential for real-time deployment on resource-constrained edge devices.
5. Conclusions
This study quantitatively assessed the utility of 15 signal-similarity metrics as indicators of motion discrepancy in the presence of vibratory disturbances and established their statistical relationship with 12 classical vibration descriptors using a large synthetic corpus of 150 motion–signal pairs. Strong coupling was found between error-based similarity metrics and amplitude-driven vibration measures; i.e., metrics such as MSE, RMSE and Euclidean distance increased monotonically with RMS, peak and crest factor, achieving |ρ| ≥ 0.85. Inverse behavior can be observed for alignment-based similarity metrics; i.e., Pearson correlation, cosine similarity and NCC decreased sharply as vibratory energy rose, providing complementary information to distance measures. Selective sensitivity was measured in DTW to frequency-domain features; i.e., DTW captured bandwidth broadening effects more effectively than other indices. Finally, there is potential for redundancy reduction and feature selection. In fact, the correlation map identifies clusters of interchangeable metrics that can streamline diagnostic pipelines.
Author Contributions
Conceptualization, A.B., R.P. and C.A.; methodology, A.B., R.P. and C.A.; software, A.B.; validation, R.P. and C.A.; formal analysis, A.B.; investigation, A.B.; data curation, A.B.; writing—original draft preparation, A.B., R.P. and C.A.; writing—review and editing, A.B., R.P. and C.A.; visualization, R.P.; supervision, C.A. All authors have read and agreed to the published version of the manuscript.
Funding
This research received no external funding.
Institutional Review Board Statement
Not applicable.
Informed Consent Statement
Not applicable.
Data Availability Statement
The datasets analyzed during the current study include parameters derived from a real machine model. Due to confidentiality agreements and industrial privacy constraints, these specific parameters cannot be publicly disclosed. All other data supporting the findings of this study are available from the corresponding author upon reasonable request.
Conflicts of Interest
The authors declare no conflict of interest.
References
- Weiss, K.R. Vibration Problems in Engineering. Nature 1965, 208, 964–965. [Google Scholar] [CrossRef]
- Gomes, G.F.; Mendez, Y.A.D.; da Silva Lopes Alexandrino, P.; da Cunha, S.S.; Ancelotti, A.C. A Review of Vibration Based Inverse Methods for Damage Detection and Identification in Mechanical Structures Using Optimization Algorithms and ANN. Arch. Comput. Methods Eng. 2019, 26, 883–897. [Google Scholar] [CrossRef]
- Knezevic, B.Z.; Blanusa, B.; Marcetic, D.P. A synergistic method for vibration suppression of an elevator mechatronic system. J. Sound Vib. 2017, 406, 29–50. [Google Scholar] [CrossRef]
- Amabili, M.; Païdoussis, M.P. Review of studies on geometrically nonlinear vibrations and dynamics of circular cylindrical shells and panels, with and without fluid-structure interaction. Appl. Mech. Rev. 2003, 56, 349–356. [Google Scholar] [CrossRef]
- Burlaka, S. The influence of vibrations on the efficiency of the internal combustion engine. Vib. Eng. Technol. 2024, 112, 23–27. [Google Scholar] [CrossRef]
- Wang, R.; You, L.; Hu, X. Performance degradation modeling and continuous worktime assessment of ultrasonic vibration systems. Processes 2024, 12, 439. [Google Scholar] [CrossRef]
- Kazan State Energy University, Kazan, Russian Federation; Malyov, N.A. Analysis of vibrations and their influence on the operation of mechatronic systems. Ekon. I Upr. Probl. RESHENIYA 2024, 9, 74–81. [Google Scholar] [CrossRef]
- Ruiz-Cárcel, C.; Jaramillo, V.H.; Mba, D.; Ottewill, J.R.; Cao, Y. Combination of process and vibration data for improved condition monitoring of industrial systems working under variable operating conditions. Mech. Syst. Signal Process. 2016, 66–67, 699–714. [Google Scholar] [CrossRef]
- Liu, Y.; Zhao, Y.; Wang, W.; Sun, L.; Jiang, Z. A high-performance multi-beam microaccelerometer for vibration monitoring in intelligent manufacturing equipment. Sens. Actuators A Phys. 2013, 189, 8–16. [Google Scholar] [CrossRef]
- Saponi, M.; Borboni, A.; Adamini, R.; Faglia, R.; Amici, C. Embedded Payload Solutions in UAVs for Medium and Small Package Delivery. Machines 2022, 10, 737. [Google Scholar] [CrossRef]
- Negrini, S.; Serpelloni, M.; Amici, C.; Gobbo, M.; Silvestro, C.; Buraschi, R.; Borboni, A.; Crovato, D.; Lopomo, N.F. Use of wearable inertial sensor in the assessment of Timed-Up-and-Go Test: Influence of device placement on temporal variable estimation. In Proceedings of the Lecture Notes of the Institute for Computer Sciences, Social-Informatics and Telecommunications Engineering, LNICST, Melbourne, Australia, 20–22 June 2017; pp. 310–317. [Google Scholar]
- Lundborg, G.; Lie-Stenström, A.K.; Sollerman, C.; Strömberg, T.; Pyykkö, I. Digital vibrogram: A new diagnostic tool for sensory testing in compression neuropathy. J. Hand Surg. 1986, 11, 693–699. [Google Scholar] [CrossRef]
- Özbek, O.; Saruhan, H. The effect of vibration and cutting zone temperature on surface roughness and tool wear in eco-friendly MQL turning of AISI D2. J. Mater. Res. Technol. 2020, 9, 2762–2772. [Google Scholar] [CrossRef]
- Radford, S.; Li, T.; Jenkins, M.; Hughes, B. Novel concentric expandable stabilizer results in increased penetration rates and drilling efficiency with reduced vibration. In Proceedings of the SPE/IADC Drilling Conference, Proceedings, Amsterdam, The Netherlands, 17–19 March 2009; pp. 768–780. [Google Scholar]
- Thompson, D.J. Wheel-rail noise generation, part III: Rail vibration. J. Sound Vib. 1993, 161, 421–446. [Google Scholar] [CrossRef]
- Griffin, M.J. Minimum health and safety requirements for workers exposed to hand-transmitted vibration and whole-body vibration in the European Union; a review. Occup. Environ. Med. 2004, 61, 387–397. [Google Scholar] [CrossRef] [PubMed]
- Borboni, A.; Lancini, M. Commanded motion optimization to reduce residual vibration. J. Vib. Acoust. 2015, 137, 031016. [Google Scholar] [CrossRef]
- Kim, D.S.; Lee, J.S. Propagation and attenuation characteristics of various ground vibrations. Soil Dyn. Earthq. Eng. 2000, 19, 115–126. [Google Scholar] [CrossRef]
- Borboni, A.; Aggogeri, F.; Pellegrini, N.; Faglia, R. Innovative modular SMA actuator. In Proceedings of the Advanced Materials Research, Chengdu, China, 7–8 January 2012; pp. 405–410. [Google Scholar]
- Borboni, A.; Faglia, R. Stochastic evaluation and analysis of free vibrations in simply supported piezoelectric bimorphs. J. Appl. Mech. Trans. ASME 2013, 80, 021003. [Google Scholar] [CrossRef]
- Yamakoshi, Y.; Sato, J.; Sato, T. Ultrasonic Imaging of Internal Vibration of Soft Tissue under Forced Vibration. IEEE Trans. Ultrason. Ferroelectr. Freq. Control 1990, 37, 45–53. [Google Scholar] [CrossRef]
- Maul, G.P.; Thomas, M.B. A Systems Model and Simulation of the Vibratory Bowl Feeder. J. Manuf. Syst. 1997, 16, 309–314. [Google Scholar] [CrossRef]
- Sun, Y. Experimental modelling and amplitude-frequency response analysis of a piecewise linear vibration system. IEEE Access 2021, 9, 4279–4290. [Google Scholar] [CrossRef]
- Rigaud, E.; Perret-Liaudet, J. Experiments and numerical results on non-linear vibrations of an impacting Hertzian contact. Part 1: Harmonic excitation. J. Sound Vib. 2003, 265, 289–307. [Google Scholar] [CrossRef]
- Torvik, P.J. On estimating system damping from frequency response bandwidths. J. Sound Vib. 2011, 330, 6088–6097. [Google Scholar] [CrossRef]
- El-Bayoumy, L.E.; Srinivasan, A.V. Influence of mistuning on rotor-blade vibrations. AIAA J. 1975, 13, 460–464. [Google Scholar] [CrossRef]
- Yamamoto, G.K.; da Costa, C.; da Silva Sousa, J.S. A smart experimental setup for vibration measurement and imbalance fault detection in rotating machinery. Case Stud. Mech. Syst. Signal Process. 2016, 4, 8–18. [Google Scholar] [CrossRef]
- Sekhar, A.S.; Prabhu, B.S. Effects of coupling misalignment on vibrations of rotating machinery. J. Sound Vib. 1995, 185, 655–671. [Google Scholar] [CrossRef]
- Choy, F.K.; Polyshchuk, V.; Zakrajsek, J.J.; Handschuh, R.F.; Townsend, D.P. Analysis of the effects of surface pitting and wear on the vibration of a gear transmission system. Tribol. Int. 1996, 29, 77–83. [Google Scholar] [CrossRef]
- Maru, M.M.; Castillo, R.S.; Padovese, L.R. Study of solid contamination in ball bearings through vibration and wear analyses. Tribol. Int. 2007, 40, 433–440. [Google Scholar] [CrossRef]
- Kim, S.; Klamecki, B.E. Milling Cutter Wear Monitoring Using Spindle Shaft Vibration. J. Manuf. Sci. Eng. Trans. ASME 1997, 119, 118–119. [Google Scholar] [CrossRef]
- Jensen, N.J.; Parker, G.G.; Blough, J.R. Base Vibration Effects on Additive Manufactured Part Quality. Exp. Tech. 2024, 48, 159–170. [Google Scholar] [CrossRef]
- Salokyová, Š.; Krehel, R.; Pollák, M.; Koačiško, M. Research on impacts of mechanical vibrations on the production machine to its rate of change of technical state. Adv. Mech. Eng. 2016, 8, 1687814016655778. [Google Scholar] [CrossRef]
- RaviKumar, S.; Pandian, C.K.A.; Hameed, S.S.; Muralidharan, V.; Syed Wahid Ali, M. Application of machine learning for fault diagnosis and operational efficiency in EV motor test benches using vibration analysis. Eng. Res. Express 2025, 7, 015355. [Google Scholar] [CrossRef]
- Aggogeri, F.; Borboni, A.; Merlo, A.; Pellegrini, N. Machine tools thermostabilization using passive control strategies. In Proceedings of the Advanced Materials Research, Chengdu, China, 7–8 January 2012; pp. 252–257. [Google Scholar]
- Elias, S.; Matsagar, V. Research developments in vibration control of structures using passive tuned mass dampers. Annu. Rev. Control 2017, 44, 129–156. [Google Scholar] [CrossRef]
- Zhao, Y.; Zhang, Y.; Guo, L.; Ding, S.; Wang, X. Advances in machine learning-based active vibration control for automotive seat suspensions: A comprehensive review. Mech. Syst. Signal Process. 2025, 231, 112645. [Google Scholar] [CrossRef]
- Nunes, J.; Su, W.; He, T. Vibration Suppression and Trajectory Tracking with Nonlinear Model Predictive Control for Urban Air Mobility Aircraft. J. Dyn. Syst. Meas. Control 2025, 147, 041010. [Google Scholar] [CrossRef]
- Chanou, K.; Gerodimos, V.; Karatrantou, K.; Jamurtas, A. Whole-body vibration and rehabilitation of chronic diseases: A review of the literature. J. Sports Sci. Med. 2012, 11, 187–200. [Google Scholar]
- Dai, H.; Zhang, P.; Lueth, T.C. Quantitative assessment of parkinsonian tremor based on an inertial measurement unit. Sensors 2015, 15, 25055–25071. [Google Scholar] [CrossRef]
- Abbasi, M.; Afsharfard, A.; Arasteh, R.; Safaie, J. Design of a noninvasive and smart hand tremor attenuation system with active control: A simulation study. Med. Biol. Eng. Comput. 2018, 56, 1315–1324. [Google Scholar] [CrossRef]
- Aggogeri, F.; Borboni, A.; Faglia, R. Reliability roadmap for mechatronic systems. In Proceedings of the Applied Mechanics and Materials, Wuhan, China, 24–25 August 2013; pp. 130–133. [Google Scholar]
- Jo, M.; Chung, M.; Kim, K.; Kim, H.Y. Improving Path Accuracy and Vibration Character of Industrial Robot Arms with Iterative Learning Control Method. Int. J. Precis. Eng. Manuf. 2024, 25, 1851–1863. [Google Scholar] [CrossRef]
- Zhang, R.; Wang, Z.; Keogh, P. H-infinity optimised control of external inertial actuators for higher precision robotic machining. Int. J. Comput. Integr. Manuf. 2022, 35, 129–144. [Google Scholar] [CrossRef]
- Keppler, M.; Lakatos, D.; Ott, C.; Albu-Schäffer, A. A passivity-based controller for motion tracking and damping assignment for compliantly actuated robots. In Proceedings of the 2016 IEEE 55th Conference on Decision and Control, CDC 2016, Las Vegas, NV, USA, 12–14 December 2016; pp. 1521–1528. [Google Scholar]
- Aggogeri, F.; Borboni, A.; Merlo, A.; Pellegrini, N.; Ricatto, R. Real-time performance of mechatronic PZT module using active vibration feedback control. Sensors 2016, 16, 1577. [Google Scholar] [CrossRef] [PubMed]
- Futami, S.; Kyura, N.; Hara, S. Vibration Absorption Control of Industrial Robots by Acceleration Feedback. IEEE Trans. Ind. Electron. 1983, IE-30, 299–305. [Google Scholar] [CrossRef]
- Aggogeri, F.; Borboni, A.; Faglia, R.; Merlo, A.; De Cristofaro, S. Precision Positioning Systems: An overview of the state of art. In Proceedings of the Applied Mechanics and Materials, Wuhan, China, 24–25 August 2013; pp. 1170–1173. [Google Scholar]
- Smith, S.T. Foundations of Ultra-Precision Mechanism Design; CRC Press: Boca Raton, FL, USA, 2017. [Google Scholar]
- Borboni, A.; Aggogeri, F.; Pellegrini, N.; Faglia, R. Precision point design of a cam indexing mechanism. In Proceedings of the Advanced Materials Research, Chengdu, China, 7–8 January 2012; pp. 399–404. [Google Scholar]
- Salawu, O.S. Detection of structural damage through changes in frequency: A review. Eng. Struct. 1997, 19, 718–723. [Google Scholar] [CrossRef]
- Farrar, C.R.; Worden, K. Structural Health Monitoring: A Machine Learning Perspective; John Wiley & Sons: Hoboken, NJ, USA, 2012. [Google Scholar]
- Vakakis, A.F.; Gendelman, O.V.; Bergman, L.A.; McFarland, D.M.; Kerschen, G.; Lee, Y.S. Nonlinear Targeted Energy Transfer in Mechanical and Structural Systems; Springer: Berlin/Heidelberg, Germany, 2009. [Google Scholar]
- Cohen, L. Time-frequency analysis. In Englewood Cliffs; Prentice Hall: West Trenton, NJ, USA, 1995. [Google Scholar]
- Randall, R.B. Vibration-Based Condition Monitoring: Industrial, Aerospace and Automotive Applications; John Wiley & Sons: Hoboken, NJ, USA, 2010. [Google Scholar]
- Moon, T.K. Similarity methods in signal processing. IEEE Trans. Signal Process. 1996, 44, 827–833. [Google Scholar] [CrossRef]
- Raschka, S.; Patterson, J.; Nolet, C. Machine learning in python: Main developments and technology trends in data science, machine learning, and artificial intelligence. Information 2020, 11, 193. [Google Scholar] [CrossRef]
- Zhang, S.; Wang, T.; Worden, K.; Sun, L.; Cross, E.J. Canonical-correlation-based fast feature selection for structural health monitoring. Mech. Syst. Signal Process. 2025, 223, 111895. [Google Scholar] [CrossRef]
- Pagani, R.; Nuzzi, C.; Ghidelli, M.; Borboni, A.; Lancini, M.; Legnani, G. Cobot user frame calibration: Evaluation and comparison between positioning repeatability performances achieved by traditional and vision-based methods. Robotics 2021, 10, 45. [Google Scholar] [CrossRef]
- Chen, K.; Wang, W.; Ma, C.; Hartwig, M.; Narayanan, A. Vibro-Acoustic Analysis of Different Rotor Skewing Patterns on Permanent Magnet Synchronous Motor. In Proceedings of the SAE Technical Papers, Detroit, MI, USA, 8–10 April 2025. [Google Scholar]
- Li, H.L.; Liang, Y.; Wang, S.C. Review on dynamic time warping in time series data mining. Kongzhi Yu Juece/Control Decis. 2018, 33, 1345–1353. (In Chinese) [Google Scholar] [CrossRef]
- Benesty, J.; Chen, J.; Huang, Y.; Cohen, I. Pearson correlation coefficient. In Springer Topics in Signal Processing; Springer: Berlin/Heidelberg, Germany, 2009; Volume 2, pp. 1–4. [Google Scholar]
- Liberti, L.; Lavor, C.; Maculan, N.; Mucherino, A. Euclidean distance geometry and applications. SIAM Rev. 2014, 56, 3–69. [Google Scholar] [CrossRef]
- Xia, P.; Zhang, L.; Li, F. Learning similarity with cosine similarity ensemble. Inf. Sci. 2015, 307, 39–52. [Google Scholar] [CrossRef]
- Jaccard, P. New research on floral distribution (Nouvelles recherches sur la distribution florale). Bull. Soc. Vaud. Sci. Nat. 1908, 44, 223–270. (In French) [Google Scholar]
- Yoo, J.C.; Han, T.H. Fast normalized cross-correlation. Circuits Syst. Signal Process. 2009, 28, 819–843. [Google Scholar] [CrossRef]
- Brunet, D.; Vrscay, E.R.; Wang, Z. On the mathematical properties of the structural similarity index. IEEE Trans. Image Process. 2012, 21, 1488–1495. [Google Scholar] [CrossRef]
- Huttenlocher, D.P.; Klanderman, G.A.; Rucklidge, W.J. Comparing Images Using the Hausdorff Distance. IEEE Trans. Pattern Anal. Mach. Intell. 1993, 15, 850–863. [Google Scholar] [CrossRef]
- Bringmann, K. Why walking the dog takes time: Frechet distance has no strongly subquadratic algorithms unless SETH fails. In Proceedings of the Proceedings—Annual IEEE Symposium on Foundations of Computer Science, FOCS, Philadelphia, PA, USA, 18–21 October 2014; pp. 661–670. [Google Scholar]
- Yujian, L.; Bo, L. A normalized Levenshtein distance metric. IEEE Trans. Pattern Anal. Mach. Intell. 2007, 29, 1091–1095. [Google Scholar] [CrossRef]
- De Maesschalck, R.; Jouan-Rimbaud, D.; Massart, D.L. The Mahalanobis distance. Chemom. Intell. Lab. Syst. 2000, 50, 1–18. [Google Scholar] [CrossRef]
- Sedgwick, P. Spearman’s rank correlation coefficient. BMJ 2014, 349, g7327. [Google Scholar] [CrossRef]
- Yorston, C.; Chen, C.; Camelio, J. Advancing architectural frameworks for vibration signature classification in rotating machinery. Proc. Inst. Mech. Eng. Part B J. Eng. Manuf. 2025, 239, 711–725. [Google Scholar] [CrossRef]
- Borboni, A.; Aggogeri, F.; Elamvazuthi, I.; Incerti, G.; Magnani, P.L. Effects of profile interpolation in cam mechanisms. Mech. Mach. Theory 2020, 144, 103652. [Google Scholar] [CrossRef]


Disclaimer/Publisher’s Note: The statements, opinions and data contained in all publications are solely those of the individual author(s) and contributor(s) and not of MDPI and/or the editor(s). MDPI and/or the editor(s) disclaim responsibility for any injury to people or property resulting from any ideas, methods, instructions or products referred to in the content. |
© 2025 by the authors. Licensee MDPI, Basel, Switzerland. This article is an open access article distributed under the terms and conditions of the Creative Commons Attribution (CC BY) license (https://creativecommons.org/licenses/by/4.0/).