Proceeding Paper

A Multimodal Deep Learning Pipeline for Enhanced Detection and Classification of Oral Cancer †

by
Idriss Tafala
1,*,
Fatima-Ezzahraa Ben-Bouazza
1,2,3,
Manal Chakour El Mezali
1,
Ilyass Emssaad
1 and
Bassma Jioudi
1,4
1
BRET Lab, Mohammed VI University of Health Sciences, Casablanca 20220, Morocco
2
LaMSN, La Maison des Sciences Numériques, 92130 Paris, France
3
Artificial Intelligence Research and Application Laboratory (AIRA Lab), Faculty of Science and Technology, Hassan 1st University, Settat 26000, Morocco
4
Higher Institute of Nursing and Health Technical Professions, Rabat 10090, Morocco
*
Author to whom correspondence should be addressed.
Presented at the 7th edition of the International Conference on Advanced Technologies for Humanity (ICATH 2025), Kenitra, Morocco, 9–11 July 2025.
Eng. Proc. 2025, 112(1), 65; https://doi.org/10.3390/engproc2025112065
Published: 4 November 2025

Abstract

Oral cancer represents a life-threatening malignancy with profound implications for patient survival and quality of life. Oral squamous cell carcinoma (OSCC), the predominant histological variant of oral cancer, constitutes a substantial healthcare challenge wherein early detection remains critical for therapeutic efficacy and enhanced survival outcomes. Recent advances in deep learning methodologies have demonstrated superior performance in medical imaging applications. However, existing investigations have predominantly employed unimodal image data for oral lesion classification, thereby neglecting the potential advantages of multimodal data integration. To address this limitation, we propose a comprehensive multimodal pipeline for the classification of OSCC versus leukoplakia through the integration of histopathological imagery with tabular data encompassing anatomical characteristics and behavioral risk factors. Our methodology achieved a precision of 0.97, F1-score of 0.97, recall of 0.98, and accuracy of 0.97. These findings demonstrate the enhanced diagnostic precision and efficacy afforded by multimodal approaches in oral cancer classification, suggesting a promising avenue for improved diagnostic accuracy and treatment planning optimization.

1. Introduction

Malignancies of the oral cavity constitute a significant burden on global healthcare systems, contributing to considerable morbidity and mortality rates worldwide. Among these neoplasms, oral squamous cell carcinoma (OSCC) emerges as the most prevalent histological form, with global epidemiological data indicating roughly 378,000 newly diagnosed cases annually and mortality figures surpassing 177,000 deaths [1]. The clinical presentation of OSCC is particularly challenging due to its tendency to develop asymptomatically during initial stages, thereby hindering timely diagnostic intervention. Traditional diagnostic protocols depend heavily on histopathological examination of tissue specimens, an approach that introduces potential sampling errors and requires specialized pathological expertise [2].
The current gold standard for oral cancer diagnosis involves Conventional Oral Examination (COE) followed by histopathological evaluation under microscopic examination. These established methodologies face considerable obstacles, especially within resourceconstrained healthcare environments where access to specialized personnel and advanced diagnostic infrastructure remains limited [3]. While tissue biopsy remains essential for definitive diagnosis confirmation, its invasive nature and potential inadequacy in detecting early-stage malignancies highlight the urgent need for alternative diagnostic strategies that can provide both accessibility and accuracy, ultimately enhancing patient prognosis across varied clinical settings [4]. Contemporary research increasingly emphasizes multimodal diagnostic frameworks that capitalize on comprehensive data integration from multiple sources to improve disease detection capabilities. Within oral oncology, these innovative approaches combine visual examination data with patient-specific clinical information to enhance early OSCC identification. Conventional single-modality diagnostic methods frequently fail to incorporate essential contextual information that could significantly impact diagnostic precision [5]. The present investigation introduces a novel multimodal framework that synergistically combines histopathological imaging data—specifically targeting the differentiation between OSCC and leukoplakia—with comprehensive clinical patient records. This integrated approach leverages both visual pathological evidence and clinical contextual data to enhance diagnostic precision and facilitate more comprehensive medical assessment. This manuscript presents a systematic examination of the utilized dataset, encompassing both histopathological specimens and associated clinical documentation. Subsequently, we detail the data preprocessing methodologies implemented to optimize model training and analytical processes. The architecture of our proposed multimodal framework is then introduced, with comprehensive justification for our architectural decisions. Finally, we present our experimental outcomes and discuss their clinical implications for oral cancer detection and classification.

2. Related Works

Recent advancements in deep learning have revolutionized medical image analysis, with notable improvements in precision and diagnostic capabilities [6,7].
Sharkas and Attallah have developed Color-CADx, a computer-aided diagnostic (CAD) system designed for the classification of colorectal cancer (CRC) subtypes. This system employs a triad of convolutional neural networks (CNNs) to effectively capture spatial and spectral features, utilizing discrete cosine transform (DCT) for the purposes of dimensionality reduction and feature fusion. The architecture of the system facilitates classification without requiring explicit segmentation of disease regions, employing classifiers like support vector machines (SVMs) and ensemble models to achieve high accuracy [8].
Vanitha et al. introduced a system that integrates the Xception and MobileNet architectures within an ensemble model, specifically optimized for histopathological images of lung and colon tissues. The incorporation of Gradient-weighted Class Activation Mapping (GradCAM) enhances the model’s interpretability, offering visual explanations for cancer classification [9,10].
CNNs that have been tuned were utilized in an inquiry that was carried out by Qirui Huang and his colleagues to investigate the identification of oral cancer. A Combined Seagull Optimization Algorithm (CSOA) is incorporated into the architecture of the convolutional neural network (CNN), which results in an improvement to the configuration of the CNN. Specifically, the Seagull Optimization Algorithm and Particle Swarm Optimization are both incorporated into this methodology with the intention of enhancing the efficiency of convolutional neural networks in the diagnosis of oral cancer. The improvement of image quality was the primary focus of their methodology, which included the utilization of preprocessing techniques such as noise reduction, contrast enhancement, and data augmentation technologies. A validation process is carried out on the methodology by utilizing the Oral Cancer (Lips and Tongue) images (OCI) dataset [11].
Andeas Vollmer and colleagues integrated clinical, genomic, and histological data with histopathological images, employing machine learning and deep learning models to propose a multimodal approach for predicting outcomes in OSCC patients. Their research illustrated that multimodal models, which integrate clinical, genetic, and histological data, surpass unimodal methods in terms of predictive accuracy, with the Random Survival Forest attaining the highest concordance index (c-index) of 0.834 [12].
Sangeetha S.K.B et al. investigated the utilization of a Multimodal Fusion Deep Neural Network (MFDNN) for the classification of lung cancer, incorporating a variety of datasets including medical images, genomic data, and clinical records. Their research highlights the capacity of multimodal deep learning to improve early diagnosis and treatment, concurrently tackling ethical considerations, regulatory frameworks, and the practical challenges associated with the deployment of AI in healthcare settings [13].
Xieling Chen and his colleagues conducted an extensive examination of the convergence of artificial intelligence (AI) and multimodal data fusion methodologies within the context of smart healthcare applications. The authors conducted a comprehensive review and analysis of research trends pertaining to AI-powered multimodal fusion within healthcare applications. Their investigation included an examination of the evolution of publication patterns, citation trends, and the dynamics of scientific collaborations across various countries, institutions, and authors. Therefore, it is essential to identify and present research topics, emerging technologies, as well as key challenges and prospective future directions in the realm of multimodal in healthcare [14].

3. Materials and Methods

3.1. Data Description

The dataset we utilized comprises histopathological images and corresponding clinical metadata (Figure 1), collected between 2010 and 2021 through the Oral Diagnosis Project (NDB) at the Federal University of Espírito Santo (UFES) in Brazil [15]. It includes representative samples of OSCC and leukoplakia, two clinically significant oral lesions.
In addition to high-resolution histopathological slides, the dataset integrates a variety of patient-specific clinical features, such as age, sex, skin tone, tobacco and alcohol usage, sun exposure, type of lesion, lesion color and texture, biopsy method, and final diagnosis. This multimodal structure enables the development of comprehensive models that learn from both visual pathology and contextual clinical indicators.
For consistency in diagnosis, three expert oral pathologists collaboratively reviewed the slides to reach a consensus classification. The availability of both image and tabular data makes this dataset particularly suited for developing and evaluating multimodal machine learning approaches for early and accurate oral cancer detection.

3.2. Data Preparation

To develop our approach and train our models efficiently, we prepared our data with a series of preprocessing steps (see Figure 2). To match our computational capabilities, we resized the images to smaller dimensions. Since we have a limited data sample size, we used data augmentation techniques, namely random flipping, random rotation, and random brightness [16,17].
For each augmented image, we retained the original tabular characteristics associated with the source image, effectively expanding the tabular dataset in parallel with the image data. This approach allowed us to maintain consistent patient and case-specific features across the augmented dataset, thus synchronizing the image and the tabular augmentation. After applying data augmentation, we obtained a total of 792 images, each accompanied by its corresponding tabular data for training.

3.3. The Proposed Approach

This investigation employs a comprehensive multimodal analytical framework that synthesizes information from diverse data sources to achieve enhanced understanding of individual patient conditions during diagnostic evaluation. Through the strategic combination of imaging and clinical tabular data, our methodology (Figure 3) facilitates more sophisticated case differentiation, thereby supporting personalized treatment protocol development tailored to specific patient profiles. The process of harmonizing heterogeneous data modalities to enable effective machine learning is termed multimodal fusion [18].
Within multimodal computational pipelines, four principal fusion strategies are recognized. The first strategy, early fusion, involves data integration at the input stage, generating a unified data representation that undergoes unified model processing. This methodology enables simultaneous learning from all data modalities from the initial processing phase. The second approach, intermediate fusion, processes each modality independently to generate distinct latent representations, which are subsequently combined for additional computational analysis. This strategy preserves modality-specific information characteristics before comprehensive integration.
The third methodology, late fusion, involves independent processing of each modality through separate computational models, followed by aggregation of resulting outputs or prediction scores. Late fusion enables specialized modality-specific modeling prior to result integration, often yielding more flexible analytical approaches. The fourth strategy, hybrid fusion, combines elements from early, intermediate, and late fusion methodologies. This comprehensive approach enables flexible integration across multiple processing levels, potentially capturing relationships that might be missed through singular fusion strategies [19,20,21].
Our research presents a multimodal architecture utilizing intermediate fusion principles, specifically designed to integrate imaging and clinical tabular data for enhanced oral cancer classification. The computational process comprises four essential phases, each optimized to maximize diverse data source utilization for precise disease detection [22,23].
Phase 1: Feature Extraction Network Training: The initial phase involves training a specialized feature extraction network, serving as the architectural foundation of our model. We employ the ConvNeXt architecture, pre-trained on the ImageNet dataset, for this purpose. ConvNeXt represents a cutting-edge convolutional neural network architecture that has demonstrated exceptional performance in image classification applications and provides robust feature extraction capabilities. By leveraging a pre-trained model, we utilize stored knowledge within its parameters to efficiently extract discriminative features from medical imagery.
Phase 2: Image Feature Derivation: Following feature extractor establishment, we proceed to derive features from dataset images. These features are obtained by processing images through the pre-trained ConvNeXt model and extracting representations from intermediate layers, typically preceding the final classification layer. The pre-trained model layers remain frozen during this process to preserve learned features, enabling utilization of the model’s pre-trained knowledge while focusing on optimizing image and clinical data fusion.
Phase 3: Image Features and Tabular Data Integration: The third phase involves concatenating extracted image features with corresponding tabular data. The clinical tabular data encompasses variables such as age, gender, tobacco usage, and other relevant risk factors, providing complementary information to visual features derived from images. This fusion of imaging and clinical data enables simultaneous learning from both modalities, integrating visual and contextual insights for improved classification performance.
Phase 4: Fusion Mechanism Training: The final phase involves training the fusion mechanism or classifier using the concatenated image and tabular data. During this phase, the model learns to optimally combine visual and clinical features to maximize classification performance. Various approaches can be implemented for this fusion, including dense neural layers, decision trees, or ensemble methods such as XGBoost. Ultimately, the classifier generates predictions regarding disease status, such as distinguishing between OSCC and leukoplakia.
In our multimodal model, we employ ConvNeXt [24] as the feature extractor. Incorporating key ideas from Vision Transformers (ViTs) [25], this architecture is a big step forward from previous convolutional neural networks (CNNs) like ResNet. Notably, ConvNeXt includes self-attention mechanisms that let the model change the order of features, making it better at detecting complex patterns across multiple layers. The hyperparameters of the ConvNeXt feature extractor are summarized in Table 1.
As mentioned in Table 1, the feature extractor is initialized with pretrained weights from the ImageNet dataset. The input images are resized to a shape of (384, 512, 3), representing the height, width, and RGB color channels.
To concentrate on feature extraction, we exclude the final classification head by setting Include Top to False, allowing the model to generate a 768-dimensional feature vector rather than a class prediction. The feature vector is obtained by implementing GlobalAveragePooling2D (1) on the output of the last convolutional layer.
G A P ( x ) = 1 H × W i = 1 H j = 1 W x i j
where:
  • x i j represents the feature map value at position ( i , j ) for a particular feature map;
  • H is the height (number of rows) of the feature map;
  • W is the width (number of columns) of the feature map;
  • G A P ( x ) is the output feature vector, which is a 1D vector containing one value per feature map channel.
During feature extraction, layer normalization (2) and GELU activation (3) algorithms are employed, promoting steady training and effective learning.
LayerNorm ( x ) = x μ σ · γ + β
where:
  • x is the input vector of features;
  • μ = 1 d i = 1 d x i is the mean of the input features;
  • σ = 1 d i = 1 d ( x i μ ) 2 is the standard deviation of the input features;
  • γ and β are learnable parameters (scaling and shifting).
GELU ( x ) = 0.5 x 1 + tanh 2 π x + 0.044715 x 3
where:
  • x is the input to the GELU function.
Our ConvNeXt feature extractor is designed with a hierarchical architecture consisting of four stages. Each stage is composed of multiple ConvNeXt blocks Figure 4 that progressively refine the extracted features. This staged design ensures that the model captures features at varying levels of abstraction, beginning with low-level details and advancing to high-level features.
Depthwise convolutions (4) form the foundation of the ConvNext block. Unlike traditional 2D convolutions, which process all input channels simultaneously, depthwise convolutions operate independently on each channel. This approach reduces computational costs while preserving spatial information within each channel.
Y m , n , c = i = 0 K h 1 j = 0 K w 1 X m + i , n + j , c · W i , j , c
where:
  • X m , n , c : Input feature map at spatial position ( m , n ) and channel c.
  • W i , j , c : Depthwise convolution kernel at spatial position ( i , j ) for channel c.
  • K h : Kernel height.
  • K w : Kernel width.
  • Y m , n , c : Output feature map at spatial position ( m , n ) and channel c.
To ensure training stability and improved generalization, layer normalization is applied after the convolutional operations. This normalization technique scales and shifts the input features, promoting consistency across different layers. Following normalization, the GELU activation function introduces smooth non-linear transformations, allowing the model to capture complex patterns effectively.
Each ConvNeXt block also incorporates a lightweight Multi-Layer Perceptron (MLP). This feedforward network includes an intermediate expansion of the input channel size, significantly increasing the model’s capacity to learn diverse and complex features.
As previously mentioned, the feature extractor is organized into four stages, which are illustrated in the architecture Figure 3; each containing multiple convolutional blocks.
The first stage of the feature extractor consists of three ConvNeXt blocks and is responsible for the initial downsampling of the input image. At this stage, the model focuses on extracting low-level features, which form the foundational building blocks for subsequent feature representations.
The second stage, also comprising three ConvNeXt blocks, further reduces the spatial dimensions of the feature map while deepening the feature representation. This stage allows the model to transition from low-level to more complex features, enabling a better understanding of patterns within the data.
The third stage includes nine ConvNeXt blocks, marking a significant expansion in model depth. At this stage, we refine the extracted features at a higher level of abstraction, capturing intricate details necessary for more complex representations.
Finally, the fourth stage, containing three ConvNeXt blocks, performs the last level of feature extraction. This step gets the refined feature map ready for the next step, which is pooling. This makes sure that the feature extractor gets the most important parts of the input data.
With these blocks, we obtain approximately 49.5 million trainable parameters, demonstrating the complexity and power of the ConvNeXt architecture in extracting useful features from our histopathological images.
After extracting the features, we performed intermediate fusion, combining the features from the tabular data of the clinical records and the features from the images extracted using ConvNeXt. We then fed this fused representation into a classifier to make final predictions. To test how well our model worked, we used k-nearest neighbors (KNN) [26], support vector machine (SVM), Random Forest, Logistic Regression, and XGBoost, among other machine learning algorithms. Among these models, KNN demonstrated superior performance, yielding the highest accuracy in our classification task.

4. Results and Discussion

All experiments were conducted using Google Colab with access to an NVIDIA A100 GPU, featuring 40 GB of VRAM and 83.5 GB of system RAM. The performance of the proposed multimodal pipeline was evaluated using standard classification metrics: accuracy, precision, recall, and F1-score.
To assess the classification of oral cancer cases, we compared several machine learning algorithms on the fused image and tabular features. These models included k-nearest neighbors (KNN), XGBoost, support vector machine (SVM), Random Forest, and Logistic Regression. Table 2 summarizes the performance of each model [27].
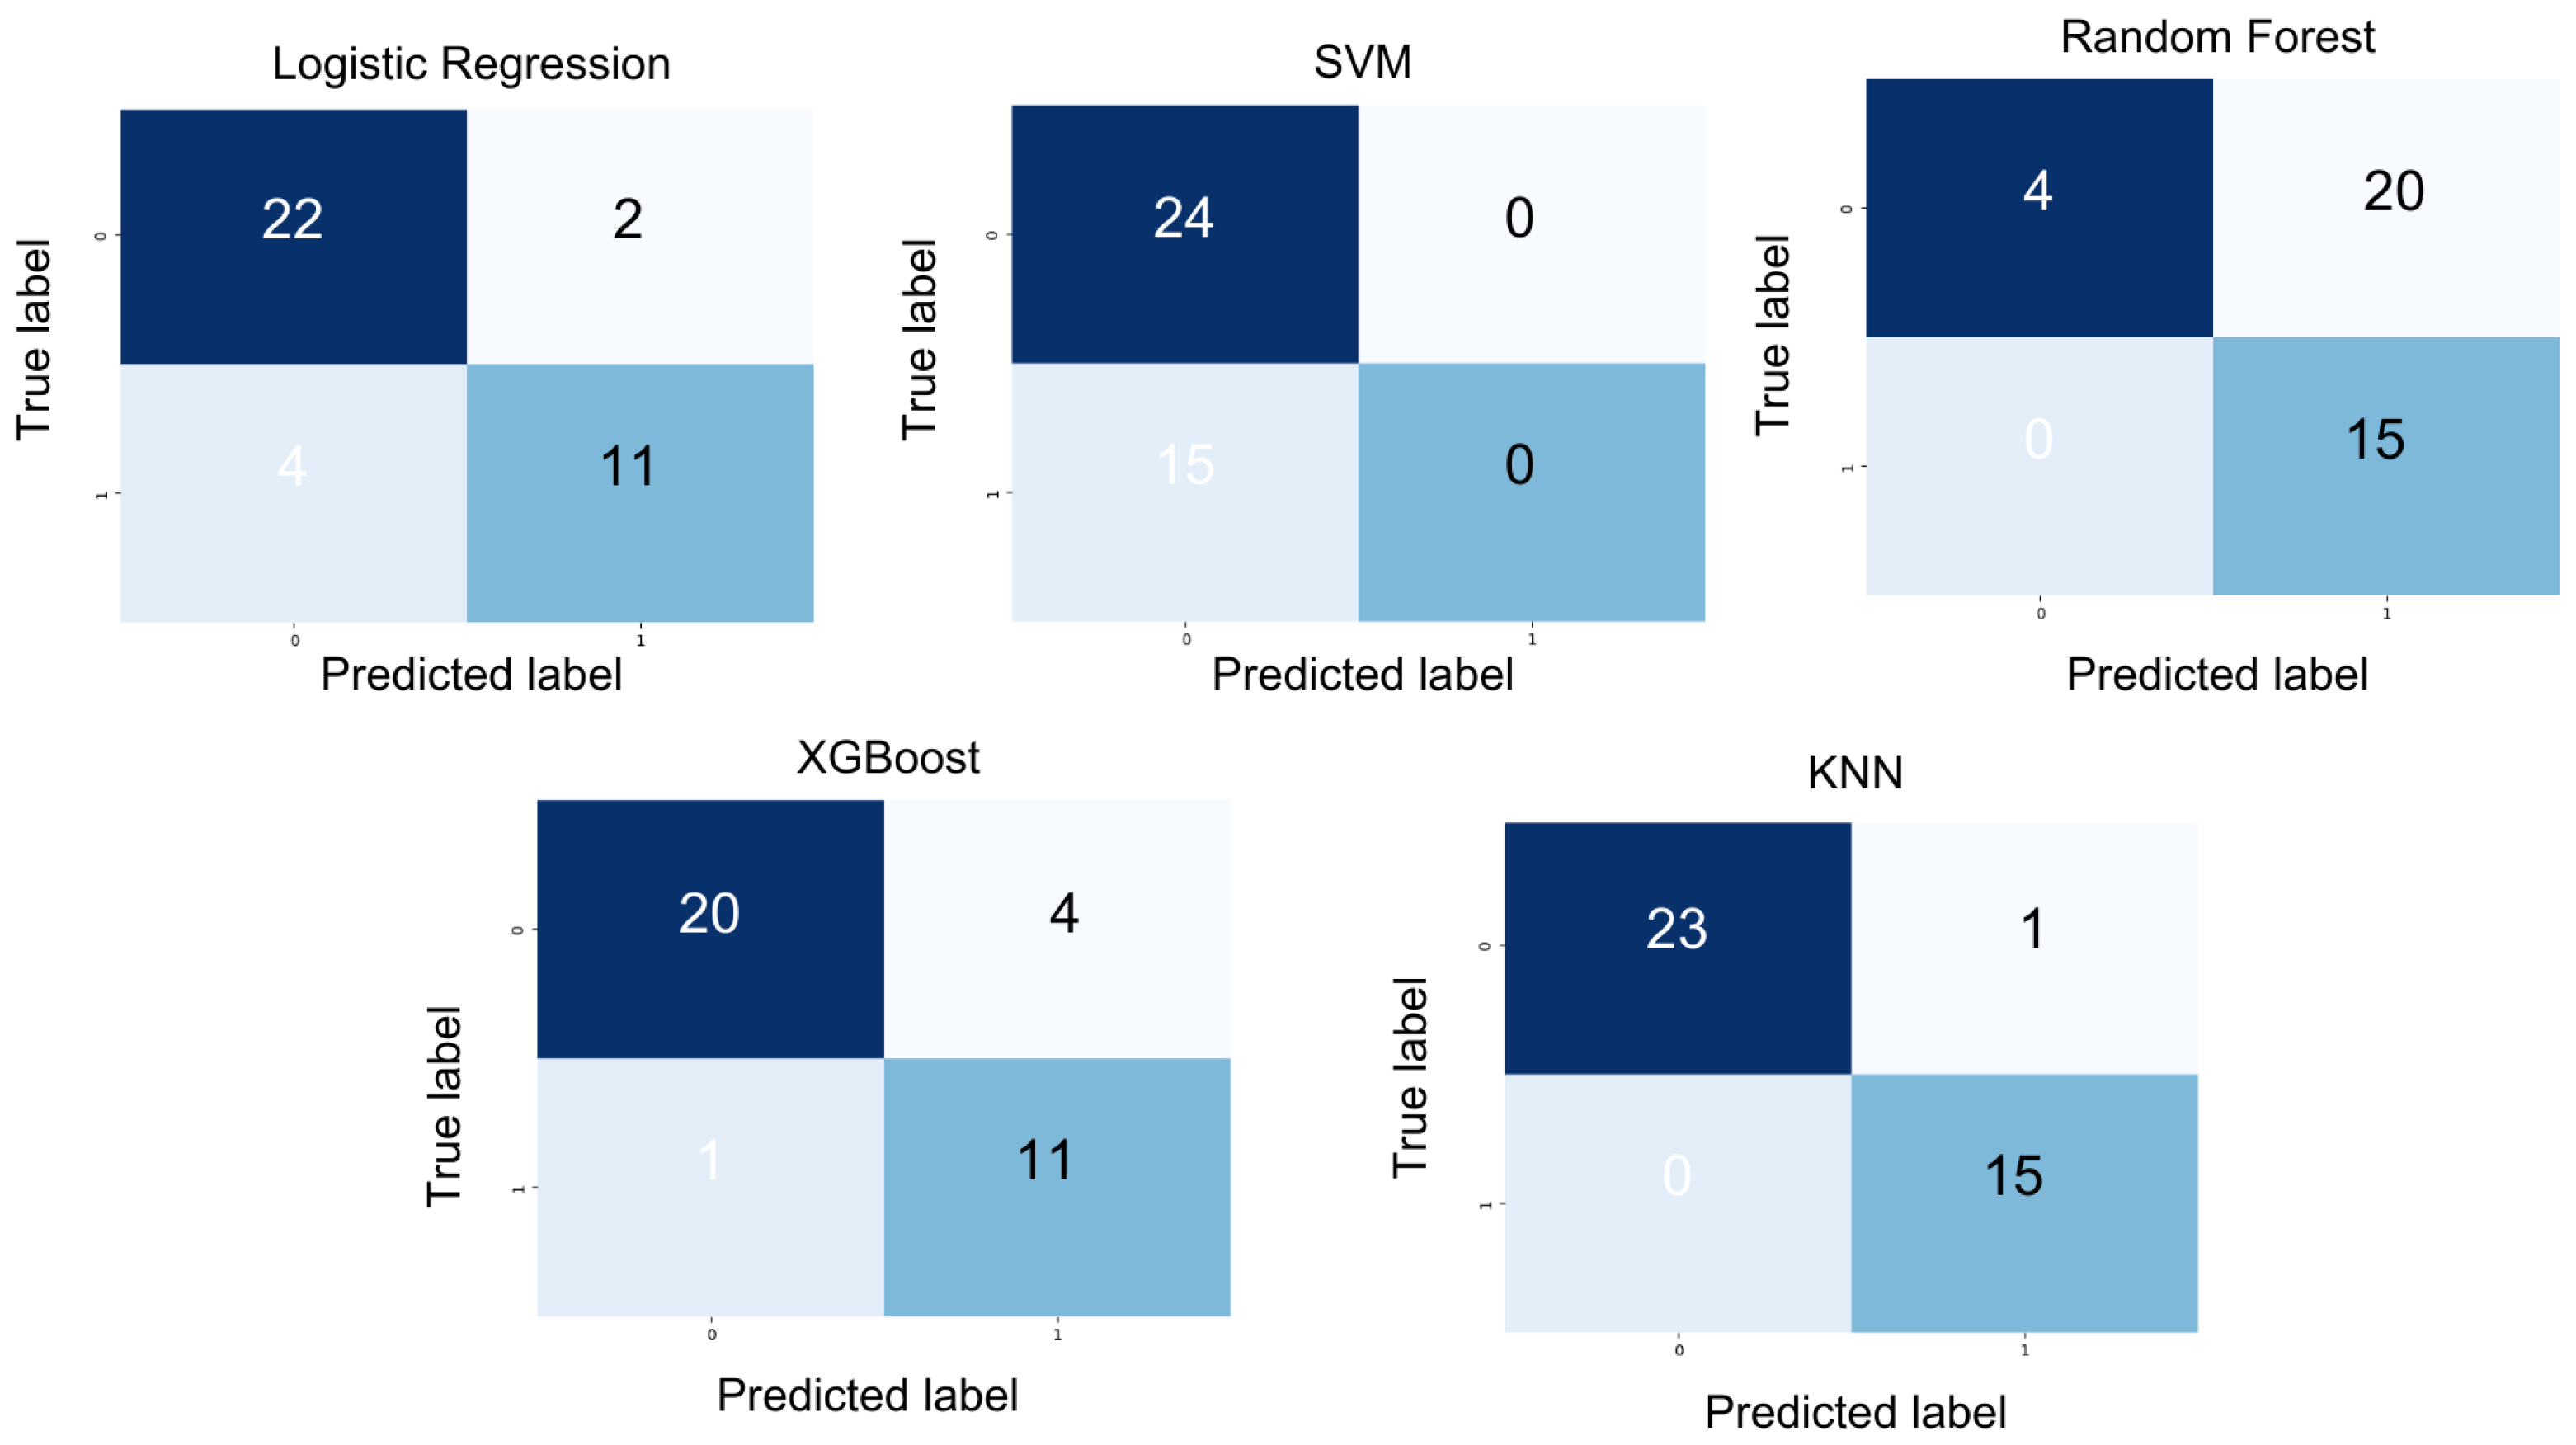
XGBoost achieved a precision of 0.87, an F1 score of 0.87, a recall of 0.88, and an accuracy of 0.87. Random Forest yielded a precision of 0.71, an F1 score of 0.44, a recall of 0.58, and an accuracy of 0.48. SVM attained a precision of 0.31, an F1-score of 0.38, a recall of 0.50, and an accuracy of 0.61. Logistic regression produced a precision of 0.85, an F1 score of 0.83, a recall of 0.82, and an accuracy of 0.84. However, KNN outperformed all other models with a precision of 0.97, an F1 score of 0.97, a recall of 0.98, and an accuracy of 0.97, as depicted in the confusion matrix (see Figure 5).
K-nearest neighbors (KNN) emerged as the most effective classifier for our dataset, demonstrating superior performance across all key metrics, including precision, recall, F1-score, and accuracy. This makes it particularly well suited for applications where both the accurate detection of relevant instances and the minimization of false positives are critical.
The confusion matrix (Figure 5) further highlights its exceptional performance, reflecting its ability to achieve both high precision—effectively identifying positive cases—and high recall, with minimal false negatives. Additionally, KNN is well-suited for relatively small datasets, leveraging its simplicity and instance-based learning approach [28]. Therefore, we choose KNN as the classifier, taking into account the characteristics, size, and task requirements of our dataset.
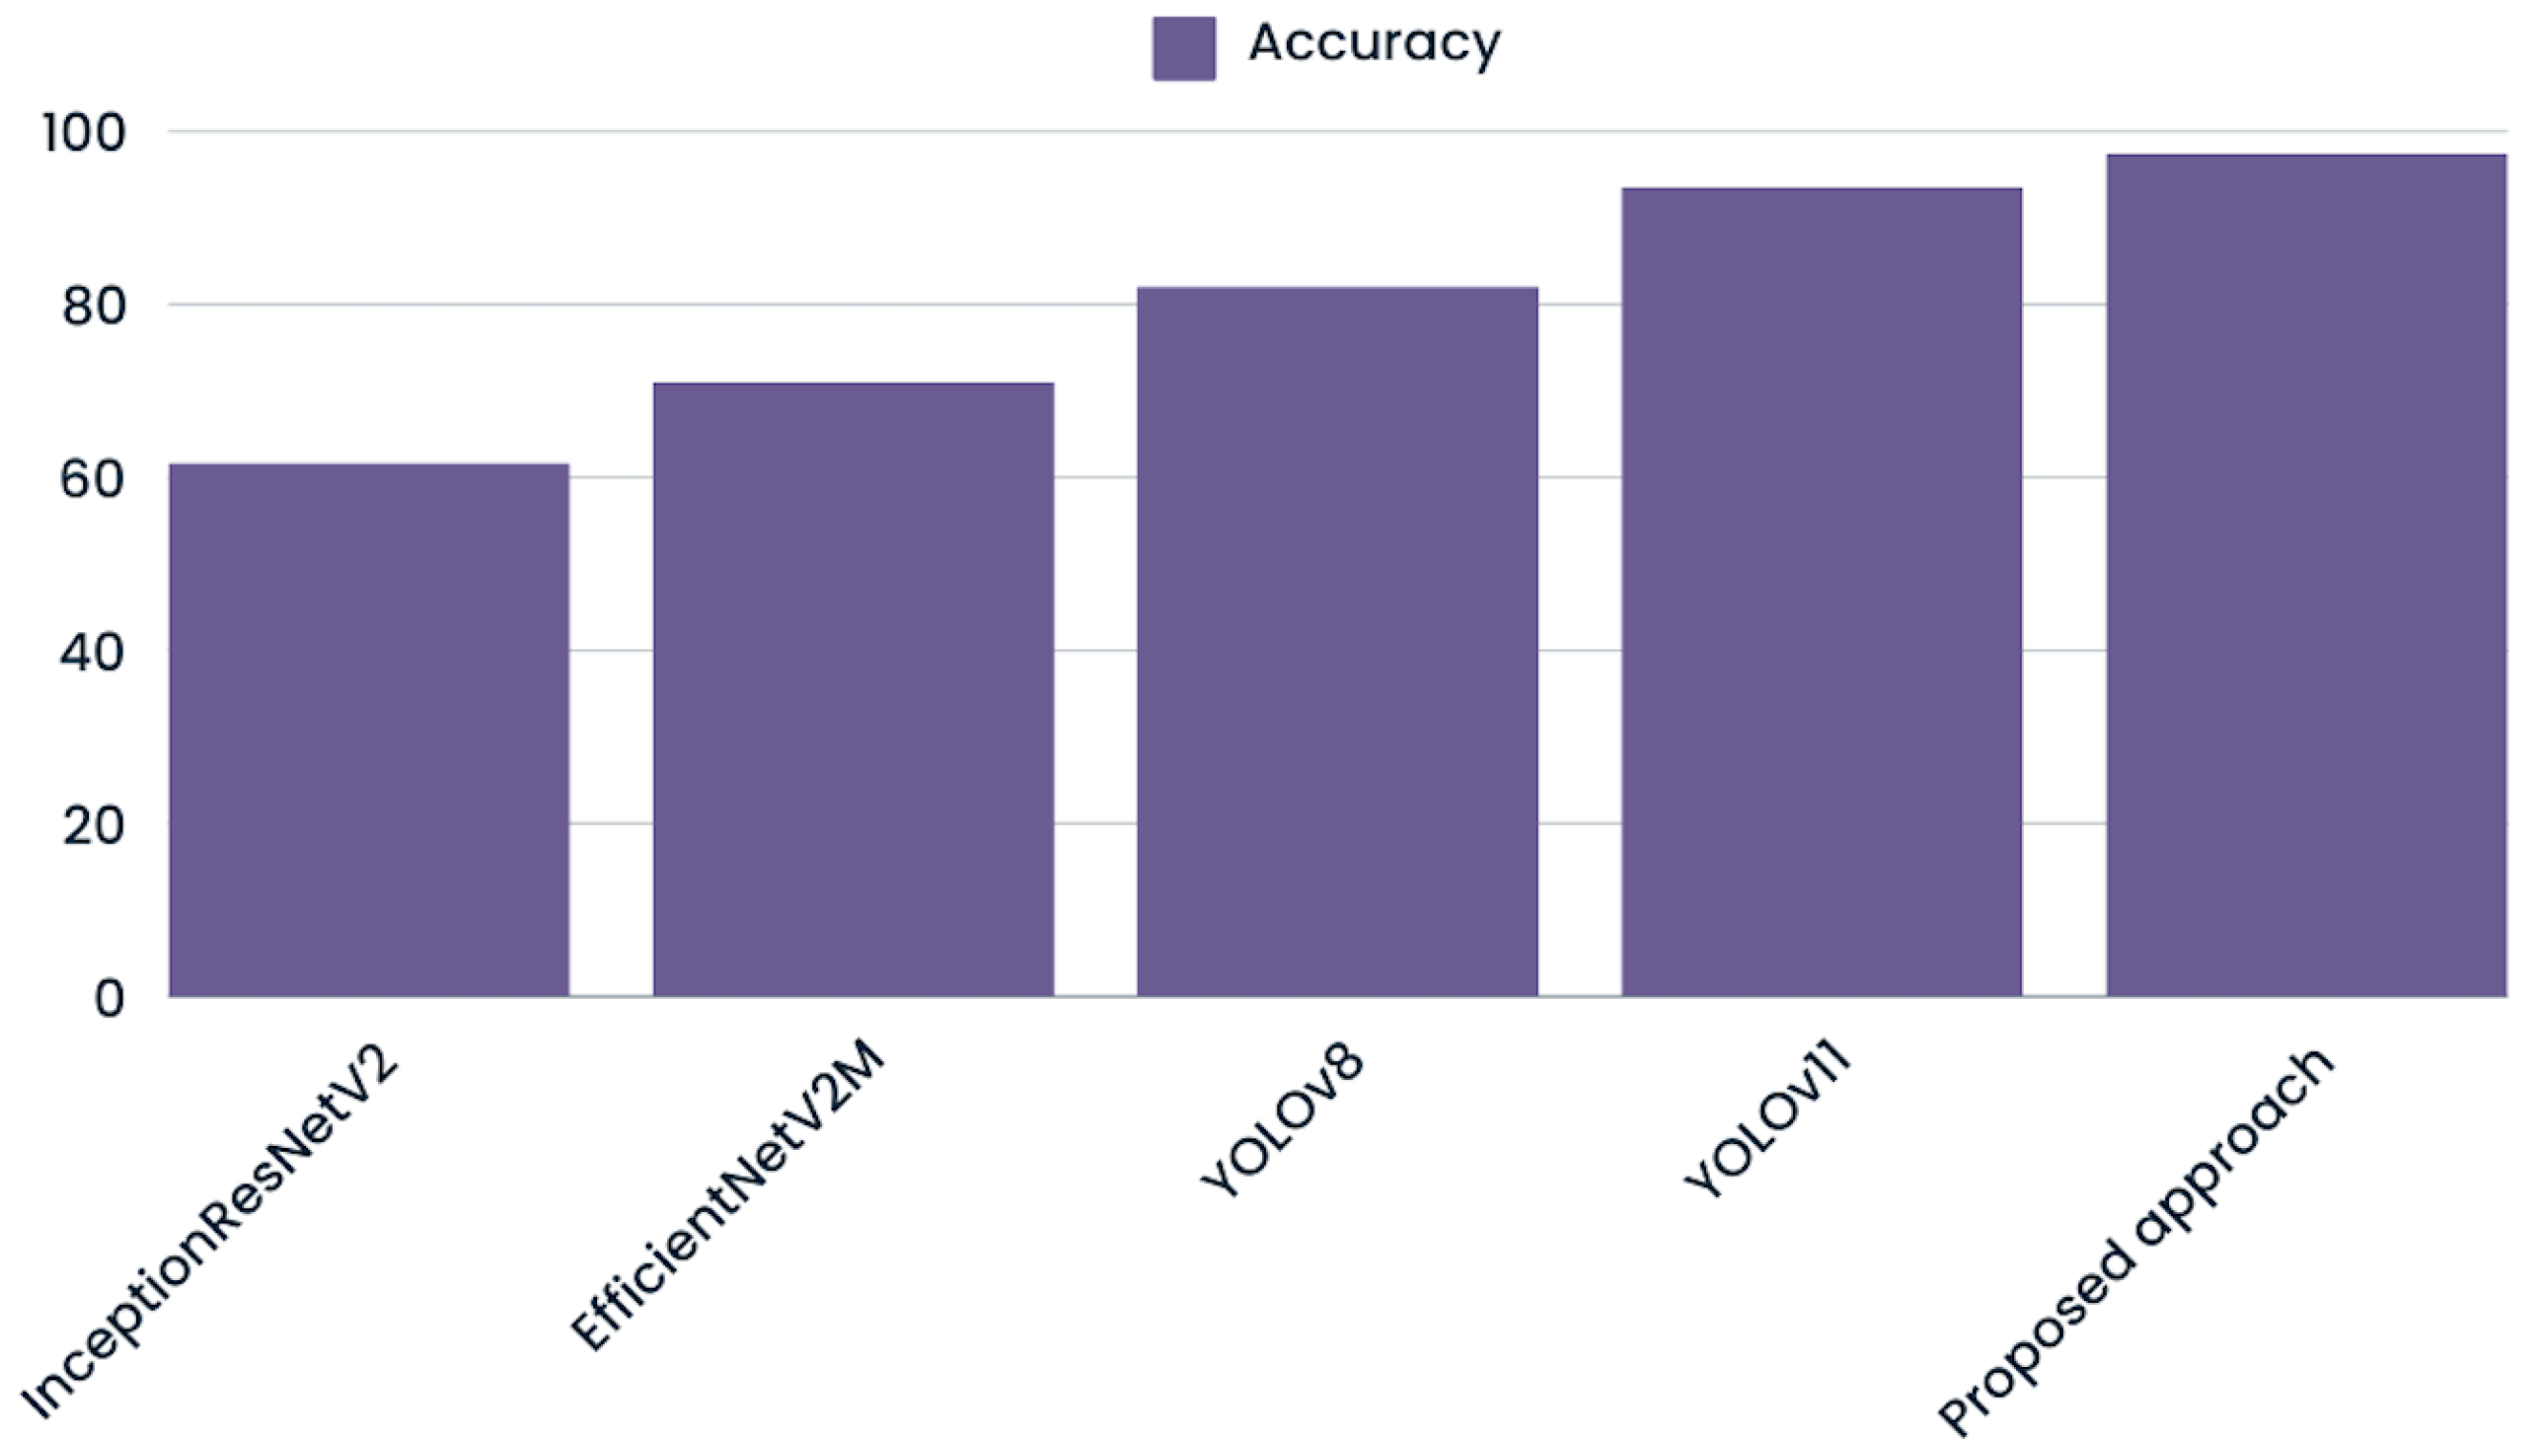
To evaluate the effectiveness of multimodal integration in oral cancer detection, we evaluated several state-of-the-art deep learning models on our augmented image dataset (Figure 6). These models were selected for their robust architectures and proven track records in image classification and object detection tasks [29]. Different models had different classification accuracy after training, which showed that they could extract and use complex image features in different ways.
InceptionResNetV2 [30], known for its hybrid architecture that integrates inception modules with residual connections, attained an accuracy of 0.62. With an accuracy of 0.71, EfficientNetV2 [31], a model that focuses on model scaling and computer efficiency, showed a small improvement. Meanwhile, YOLOv8 [32] an advanced object detection framework optimized for speed and precision, achieved 0.82 accuracy, outperforming both previous models. Finally, YOLOv11, the newest version in the YOLO series with better methods for extracting features and training, obtained the highest accuracy score of 0.94, showing that it is very good at finding complex patterns in data.
The fact that our multimodal approach obtained an accuracy score of 0.97 shows that combining image and tabular data made it easier to classify cases of oral cancer more accurately. This shows that using more than one modality in a classification task can help with more accurate diagnosis in difficult classification problems compared to using just one modality.
In the present study, we developed a comprehensive multimodal diagnostic framework by integrating state-of-the-art deep learning and classical machine learning techniques to improve the accuracy of oral cancer detection. Specifically, we employed the ConvNeXt deep neural network for automated feature extraction from histopathological images, which was subsequently combined with a range of machine learning classifiers, including SVM, KNN, XGBoost, Random Forest, and Logistic Regression. This hybrid approach was designed to leverage the strengths of both deep representation learning and traditional classification paradigms to enhance diagnostic performance.
In the clinical context, achieving high diagnostic accuracy is of paramount importance. Our experimental results demonstrate that the proposed multimodal pipeline is capable of accurately identifying and classifying histopathological patterns associated with oral cancer. The deep learning backbone, ConvNeXt, proved effective in capturing complex morphological features from the imaging data, while the integration of structured clinical data contributed to improved predictive performance. Notably, incorporating patient metadata—such as demographic and risk factor profiles—augmented the discriminative power of the model, underscoring the potential of multimodal fusion in clinical decision support systems.
Despite these promising findings, several limitations must be acknowledged. First, the study was conducted on a single dataset derived from a specific demographic population, which may constrain the external validity and generalizability of the results to broader or more heterogeneous populations. Second, the relatively small sample size introduces potential concerns regarding statistical power and the robustness of the findings. Third, the clinical data modalities utilized were limited in scope, thereby constraining the depth of multimodal integration.
Future research efforts should focus on validating the proposed framework using larger, more diverse datasets and incorporating a wider spectrum of clinical parameters, including genomic, proteomic, and longitudinal health records. Such enhancements could further strengthen the applicability of multimodal artificial intelligence systems in realworld clinical environments and contribute to the development of personalized diagnostic tools for early cancer detection.

5. Conclusions

In this work, we present a multimodal pipeline for detecting and classifying oral cancer cases. Utilizing an intermediate fusion technique, we evaluated various model architectures across multiple data modalities. The integration of ConvNeXt for image feature extraction and KNN for classification of the fused features yielded promising results. Our findings indicate that multimodal approaches can significantly enhance predictive accuracy in the diagnosis of oral cancer cases, leveraging the strengths of different data modalities to capture diverse feature levels. These methodologies demonstrate significant promise in enhancing the accuracy of management and treatment strategies for cancer patients.

Author Contributions

The authors contributed to this work as follows: Conceptualization, I.T., F.-E.B.-B. and B.J.; methodology, I.T., M.C.E.M. and I.E.; software, I.T., I.E. and M.C.E.M.; validation, I.T., M.C.E.M. and I.E.; formal analysis, I.T., F.-E.B.-B. and M.C.E.M.; investigation, I.T., F.-E.B.-B. and I.E.; resources, I.T., B.J. and F.-E.B.-B.; data curation, I.T., M.C.E.M. and I.E.; writing—original draft preparation, I.T., M.C.E.M. and F.-E.B.-B.; writing—review and editing, I.T., B.J., F.-E.B.-B. and M.C.E.M.; visualization, I.T., M.C.E.M. and I.E.; and supervision, B.J. All authors have read and agreed to the published version of the manuscript.

Funding

This research received no external funding.

Institutional Review Board Statement

This study utilized the widely recognized The CirCor DigiScope Phonocardiogram Dataset. Ethical review and approval were waived for this study, due to the use of publicly available datasets.

Informed Consent Statement

This study used publicly available dataset where informed consent was obtained from all subjects involved in the study.

Data Availability Statement

The data presented in this study are openly available: NDB-UFES: An oral cancer and leukoplakia dataset composed of histopathological images and patient data.

Conflicts of Interest

The authors declare no conflicts of interest.

References

  1. Sung, H.; Ferlay, J.; Siegel, R.L.; Laversanne, M.; Soerjomataram, I.; Jemal, A.; Bray, F. Global cancer statistics 2020: GLOBOCAN estimates of incidence and mortality worldwide for 36 cancers in 185 countries. CA Cancer J. Clin. 2021, 71, 209–249. [Google Scholar] [CrossRef]
  2. Chen, P.H.; Wu, C.H.; Chen, Y.F.; Yeh, Y.C.; Lin, B.H.; Chang, K.W.; Lai, P.Y.; Hou, M.C.; Lu, C.L.; Kuo, W.C. Combination of structural and vascular optical coherence tomography for differentiating oral lesions of mice in different carcinogenesis stages. Biomed. Opt. Express 2018, 9, 1461–1476. [Google Scholar] [CrossRef]
  3. Yang, E.C.; Tan, M.T.; Schwarz, R.A.; Richards-Kortum, R.R.; Gillenwater, A.M.; Vigneswaran, N. Noninvasive diagnostic adjuncts for the evaluation of potentially premalignant oral epithelial lesions: Current limitations and future directions. Oral Surg. Oral Med. Oral Pathol. Oral Radiol. 2018, 125, 670–681. [Google Scholar] [CrossRef] [PubMed]
  4. Rimal, J.; Shrestha, A.; Maharjan, I.K.; Shrestha, S.; Shah, P. Risk assessment of smokeless tobacco among oral precancer and cancer patients in eastern developmental region of Nepal. Asian Pac. J. Cancer Prev. APJCP 2019, 20, 411. [Google Scholar] [CrossRef] [PubMed]
  5. Devindi, G.; Dissanayake, D.; Liyanage, S.; Francis, F.; Pavithya, M.; Piyarathne, N.; Hettiarachchi, P.; Rasnayaka, R.; Jayasinghe, R.; Ragel, R.; et al. Multimodal Deep Convolutional Neural Network Pipeline for AI-Assisted Early Detection of Oral Cancer. IEEE Access 2024, 12, 124375–124390. [Google Scholar] [CrossRef]
  6. Tafala, I.; Ben-Bouazza, F.E.; Edder, A.; Manchadi, O.; Et-Taoussi, M.; Jioudi, B. EfficientNetV2 and Attention Mechanisms for the automated detection of Cephalometric landmarks. In Proceedings of the 2024 International Conference on Intelligent Systems and Computer Vision (ISCV), Fez, Morocco, 8–10 May 2024; IEEE: New York, NY, USA, 2024; pp. 1–6. [Google Scholar]
  7. Warin, K.; Suebnukarn, S. Deep learning in oral cancer-a systematic review. BMC Oral Health 2024, 24, 212. [Google Scholar] [CrossRef] [PubMed]
  8. Tafala, I.; Ben-Bouazza, F.E.; Edder, A.; Manchadi, O.; Et-Taoussi, M.; Jioudi, B. Cephalometric Landmarks Identification Through an Object Detection-based Deep Learning Model. Int. J. Adv. Comput. Sci. Appl. 2024, 15. [Google Scholar] [CrossRef]
  9. Sharkas, M.; Attallah, O. Color-CADx: A deep learning approach for colorectal cancer classification through triple convolutional neural networks and discrete cosine transform. Sci. Rep. 2024, 14, 6914. [Google Scholar] [CrossRef]
  10. Vanitha, K.; Sree, S.S.; Guluwadi, S. Deep learning ensemble approach with explainable AI for lung and colon cancer classification using advanced hyperparameter tuning. BMC Med. Inform. Decis. Mak. 2024, 24, 222. [Google Scholar] [CrossRef]
  11. Huang, Q.; Ding, H.; Razmjooy, N. Oral cancer detection using convolutional neural network optimized by combined seagull optimization algorithm. Biomed. Signal Process. Control 2024, 87, 105546. [Google Scholar] [CrossRef]
  12. Vollmer, A.; Hartmann, S.; Vollmer, M.; Shavlokhova, V.; Brands, R.C.; Kübler, A.; Wollborn, J.; Hassel, F.; Couillard-Despres, S.; Lang, G.; et al. Multimodal artificial intelligence-based pathogenomics improves survival prediction in oral squamous cell carcinoma. Sci. Rep. 2024, 14, 5687. [Google Scholar] [CrossRef]
  13. Sangeetha, S.; Mathivanan, S.K.; Karthikeyan, P.; Rajadurai, H.; Shivahare, B.D.; Mallik, S.; Qin, H. An enhanced multimodal fusion deep learning neural network for lung cancer classification. Syst. Soft Comput. 2024, 6, 200068. [Google Scholar]
  14. Chen, X.; Xie, H.; Tao, X.; Wang, F.L.; Leng, M.; Lei, B. Artificial intelligence and multimodal data fusion for smart healthcare: Topic modeling and bibliometrics. Artif. Intell. Rev. 2024, 57, 91. [Google Scholar] [CrossRef]
  15. Ribeiro-de Assis, M.C.F.; Soares, J.P.; de Lima, L.M.; de Barros, L.A.P.; Grão-Velloso, T.R.; Krohling, R.A.; Camisasca, D.R. NDB-UFES: An oral cancer and leukoplakia dataset composed of histopathological images and patient data. Data Brief 2023, 48, 109128. [Google Scholar] [CrossRef]
  16. Yang, S.; Xiao, W.; Zhang, M.; Guo, S.; Zhao, J.; Shen, F. Image data augmentation for deep learning: A survey. arXiv 2022, arXiv:2204.08610. [Google Scholar]
  17. Plompen, A.J.; Cabellos, O.; De Saint Jean, C.; Fleming, M.; Algora, A.; Angelone, M.; Archier, P.; Bauge, E.; Bersillon, O.; Blokhin, A.; et al. The joint evaluated fission and fusion nuclear data library, JEFF-3.3. Eur. Phys. J. A 2020, 56, 1–108. [Google Scholar] [CrossRef]
  18. Atrey, P.K.; Hossain, M.A.; El Saddik, A.; Kankanhalli, M.S. Multimodal fusion for multimedia analysis: A survey. Multimed. Syst. 2010, 16, 345–379. [Google Scholar] [CrossRef]
  19. Huang, B.; Yang, F.; Yin, M.; Mo, X.; Zhong, C. A review of multimodal medical image fusion techniques. Comput. Math. Methods Med. 2020, 2020, 8279342. [Google Scholar] [CrossRef]
  20. Azam, M.A.; Khan, K.B.; Salahuddin, S.; Rehman, E.; Khan, S.A.; Khan, M.A.; Kadry, S.; Gandomi, A.H. A review on multimodal medical image fusion: Compendious analysis of medical modalities, multimodal databases, fusion techniques and quality metrics. Comput. Biol. Med. 2022, 144, 105253. [Google Scholar] [CrossRef]
  21. Pawłowski, M.; Wróblewska, A.; Sysko-Romańczuk, S. Effective techniques for multimodal data fusion: A comparative analysis. Sensors 2023, 23, 2381. [Google Scholar] [CrossRef]
  22. Woo, S.; Debnath, S.; Hu, R.; Chen, X.; Liu, Z.; Kweon, I.S.; Xie, S. Convnext v2: Co-designing and scaling convnets with masked autoencoders. In Proceedings of the IEEE/CVF Conference on Computer Vision and Pattern Recognition, Vancouver, BC, Canada, 17–24 June 2023; pp. 16133–16142. [Google Scholar]
  23. Yu, W.; Zhou, P.; Yan, S.; Wang, X. Inceptionnext: When inception meets convnext. In Proceedings of the IEEE/CVF Conference on Computer Vision and Pattern Recognition, Seattle, WA, USA, 16–22 June 2024; pp. 5672–5683. [Google Scholar]
  24. Liu, Z.; Mao, H.; Wu, C.Y.; Feichtenhofer, C.; Darrell, T.; Xie, S. A convnet for the 2020s. In Proceedings of the IEEE/CVF Conference on Computer Vision and Pattern Recognition, New Orleans, LA, USA, 18–24 June 2022; pp. 11976–11986. [Google Scholar]
  25. Khan, S.; Naseer, M.; Hayat, M.; Zamir, S.W.; Khan, F.S.; Shah, M. Transformers in vision: A survey. ACM Comput. Surv. (CSUR) 2022, 54, 1–41. [Google Scholar] [CrossRef]
  26. Guo, G.; Wang, H.; Bell, D.; Bi, Y.; Greer, K. KNN model-based approach in classification. In Proceedings of the on the Move to Meaningful Internet Systems 2003: CoopIS, DOA, and ODBASE: OTM Confederated International Conferences, CoopIS, DOA, and ODBASE 2003, Catania, Sicily, Italy, 3–7 November 2003; Springer: Berlin/Heidelberg, Germany, 2003; pp. 986–996. [Google Scholar]
  27. Hossin, M.; Sulaiman, M.N. A review on evaluation metrics for data classification evaluations. Int. J. Data Min. Knowl. Manag. Process 2015, 5, 1. [Google Scholar]
  28. Halder, R.K.; Uddin, M.N.; Uddin, M.A.; Aryal, S.; Khraisat, A. Enhancing K-nearest neighbor algorithm: A comprehensive review and performance analysis of modifications. J. Big Data 2024, 11, 113. [Google Scholar] [CrossRef]
  29. Abhisheka, B.; Biswas, S.K.; Purkayastha, B. A comprehensive review on breast cancer detection, classification and segmentation using deep learning. Arch. Comput. Methods Eng. 2023, 30, 5023–5052. [Google Scholar] [CrossRef]
  30. Szegedy, C.; Ioffe, S.; Vanhoucke, V.; Alemi, A. Inception-v4, inception-resnet and the impact of residual connections on learning. In Proceedings of the AAAI Conference on Artificial Intelligence, San Francisco, CA, USA, 4–9 February 2017; Volume 31. [Google Scholar]
  31. Tan, M.; Le, Q. Efficientnetv2: Smaller models and faster training. In Proceedings of the International Conference on Machine Learning, PMLR, Virtual, 18–24 July 2021; pp. 10096–10106. [Google Scholar]
  32. Reis, D.; Kupec, J.; Hong, J.; Daoudi, A. Real-time flying object detection with YOLOv8. arXiv 2023, arXiv:2305.09972. [Google Scholar] [CrossRef]
Figure 1. Description of the modalities in the dataset used.
Engproc 112 00065 g001
Figure 2. Process of preparing the data for training. From resizing to augmenting the image data.
Engproc 112 00065 g002
Figure 3. Pipeline combining ConvNext-extracted image features with clinical parameters to classify the patient’s health state.
Engproc 112 00065 g003
Figure 4. ConvNext Block.
Engproc 112 00065 g004
Figure 5. Overview of model prediction outcomes in the form of a confusion matrix for patient condition labels using different models.
Engproc 112 00065 g005
Figure 6. Graph visualizing the model’s ability to classify patient conditions using only image features compared to the proposed approach.
Engproc 112 00065 g006
Table 1. Hyperparameters Table.
HyperparameterValue
Model NameConvNext feature extractor
Pretrained Weightsimagenet
Input Shape(384, 512, 3)
Output Feature Dimension768
Include TopFalse (the classification head is excluded to use the model as a feature extractor)
Final Layer (before pooling)LayerNormalization with output shape (12, 16, 768)
Pooling LayerGlobalAveragePooling2D (output shape becomes (None, 768))
Activation FunctionGELU
NormalizationLayer normalization (LayerNorm) is used instead of BatchNorm for all layers.
Convolutional Kernel Size7 × 7 (depthwise convolutions in ConvNeXt blocks)
Stem Convolution Type4 × 4 Conv with stride = 4 for initial downsampling
Number of Stages4
Blocks per Stage[3, 3, 9, 3] (block count for stages 1 to 4)
Expansion Ratio4 × (for the MLPs inside the blocks)
Dropout Rate0.3
Trainable Parameters49,454,688
Table 2. Comparison of the obtained results using different machine learning models as the classifier.
PrecisionF1-ScoreRecallAccuracy
XG-Boost0.870.870.880.87
Random Forest0.710.440.580.48
SVM0.310.380.500.61
Logistic Regression0.850.830.820.84
KNN0.970.970.980.97
Disclaimer/Publisher’s Note: The statements, opinions and data contained in all publications are solely those of the individual author(s) and contributor(s) and not of MDPI and/or the editor(s). MDPI and/or the editor(s) disclaim responsibility for any injury to people or property resulting from any ideas, methods, instructions or products referred to in the content.