Proceeding Paper

A Deep Learning Framework for Early Detection of Potential Cardiac Anomalies via Murmur Pattern Analysis in Phonocardiograms †

by
Aymane Edder
1,*,
Fatima-Ezzahraa Ben-Bouazza
1,2,3,
Oumaima Manchadi
1,
Youssef Ait Bigane
1,
Djeneba Sangare
1 and
Bassma Jioudi
1,4
1
BRET Lab, Mohammed VI University of Health Sciences, Casablanca 82403, Morocco
2
LaMSN, La Maison des Sciences Numériques, 75001 Paris, France
3
Artificial Intelligence Research and Application Laboratory (AIRA Lab), Faculty of Science and Technology, Hassan 1st University, Settat 26002, Morocco
4
Higher Institute of Nursing and Health Technical Professions, Rabat 10000, Morocco
*
Author to whom correspondence should be addressed.
Presented at the 7th edition of the International Conference on Advanced Technologies for Humanity (ICATH 2025), Kenitra, Morocco, 9–11 July 2025.
Eng. Proc. 2025, 112(1), 63; https://doi.org/10.3390/engproc2025112063
Published: 31 October 2025

Abstract

Heart murmurs, resulting from turbulent blood flow within the cardiac structure, represent some of the initial acoustic manifestations of potential underlying cardiovascular anomalies, such as arrhythmias. This research presents a deep learning framework aimed at the early detection of potential cardiac anomalies through the analysis of murmur patterns in phonocardiogram (PCG) signals. Our methodology employs a spectro-temporal feature fusion technique that integrates Mel spectrograms, Mel Frequency Cepstral Coefficients (MFCCs), Root Mean Square (RMS) energy, and Power Spectral Density (PSD) representations. The features are derived from segmented 5-second phonocardiogram (PCG) windows and subsequently input into a two-dimensional convolutional neural network (CNN) for the purpose of classification. In order to mitigate class imbalance and enhance generalization, We employ data augmentation techniques, including pitch moving and noise injection. The model under consideration has undergone training and evaluation utilizing a carefully selected subset of the CirCor DigiScope dataset. The experimental findings indicate a robust performance, with a classification accuracy recorded at 92.40% and a cross-entropy loss measured at 0.2242. The results indicate that an analysis of PCG signals informed by murmurs may function as an effective non-invasive method for the early screening of conditions that may include arrhythmias, particularly in clinical environments with limited resources.

1. Introduction

Cardiovascular diseases (CVDs) persist as the predominant cause of global mortality, underscoring the imperative for the development of early and accessible diagnostic methodologies [1]. Arrhythmias, characterized by irregular heart rhythms, are a significant category of CVDs that can range from benign to life-threatening. While electrocardiography (ECG) is the gold standard for arrhythmia diagnosis, its accessibility can be limited in resource-constrained settings or for continuous, long-term monitoring [2].
Phonocardiography (PCG), the technique of recording and analyzing the acoustic signals produced by the heart, has emerged as a valuable non-invasive and cost-effective modality for cardiovascular assessment, particularly in resource-constrained settings [3]. This method captures heart sounds that arise from the mechanical events within the cardiac cycle, primarily the first (S1) and second (S2) heart sounds. These correspond to the closure of the atrioventricular (mitral and tricuspid) valves and the semilunar (aortic and pulmonary) valves, respectively, and provide insight into the timing and synchronization of cardiac events. In addition to the normal heart sounds, PCG can detect abnormal acoustic phenomena such as additional heart sounds (e.g., S3, S4) and, importantly, heart murmurs [4,5].
Heart murmurs are generated by turbulent blood flow within the heart or great vessels and often result from structural abnormalities such as valvular stenosis or regurgitation, septal defects, or congenital anomalies. These murmurs may vary in intensity, timing, frequency, and duration, characteristics that can be analyzed to infer their underlying etiology [6,7]. The presence of pathological murmurs can be an early marker of cardiovascular dysfunction and may precede more overt clinical manifestations.
Moreover, structural heart abnormalities that cause murmurs can also disrupt normal electrical conduction pathways, thereby increasing the risk of arrhythmias. For example, mitral valve prolapse or ventricular septal defects are known to be associated with arrhythmic events. As such, the auscultatory findings from PCG can guide clinicians toward further diagnostic evaluations, including electrocardiography (ECG) or echocardiography, to assess both the structural integrity and electrical activity of the heart [8,9,10].
In summary, the detection and analysis of heart murmurs through phonocardiography not only facilitates the early identification of structural heart disease but also serves as a useful screening tool to flag patients who may be at risk for or are already experiencing arrhythmias. This reinforces the clinical relevance of PCG in comprehensive cardiac monitoring and preventive cardiology [11,12].
Traditional auscultation, a fundamental and time-honored technique in the realm of physical examinations, consists of carefully listening to the intricate nuances of heart sounds through the utilization of a stethoscope in order to evaluate and analyze the performance of the cardiac system. However, it is important to note that the reliability and accuracy of this method are inherently subjective and greatly influenced by the level of proficiency and experience of the healthcare provider as well as the prevailing ambient conditions in which the examination takes place [13]. Factors such as the level of ambient noise present in the environment, the overall quality and performance of the stethoscope being used during the examination, as well as the extensive level of expertise and practical knowledge possessed by the healthcare provider conducting the assessment all play significant roles in contributing to the potential variability observed when attempting to identify and discern subtle irregularities such as murmurs, additional heart sounds, or abnormal heart rhythms. This variability may, in turn, lead to the possibility of certain abnormalities being overlooked or the diagnosis being rendered inconsistent [14,15]. The introduction of innovative digital stethoscopes has completely transformed this medical practice by capturing heart sounds as high-fidelity digital phonocardiogram (PCG) signals, which can be easily amplified, meticulously filtered, and conveniently stored for in-depth analysis and comprehensive evaluation. Combined with advanced computational methodologies, such as sophisticated signal processing algorithms and complex feature extraction techniques, these innovative devices facilitate the impartial, replicable, and automated analysis of cardiac sounds, significantly reducing the potential for human inaccuracies. Furthermore, recent advancements in the field of machine learning, and more specifically in deep learning, have shown remarkable potential in revolutionizing the field of cardiac diagnostics by precisely categorizing different types of heart sounds and effectively detecting various pathological conditions [16,17]. These sophisticated algorithms have the capability to thoroughly examine intricate patterns present in PCG signals, including factors such as frequency, amplitude, and temporal characteristics. This enables them to accurately identify irregularities such as valvular heart disease or heart failure with exceptional precision and reliability. By strategically incorporating these cutting-edge technologies into existing clinical processes and procedures, healthcare providers have the opportunity to significantly elevate the precision of diagnostic assessments, optimize patient results, and streamline the monitoring of individuals from a distance, ultimately establishing a foundation for the provision of more widely available and uniformly implemented cardiac healthcare services.
This paper proposes a deep learning framework for the detection of heart murmurs from PCG signals which can, in turn, act as a valuable screening tool for conditions often associated with murmurs, including certain arrhythmias. Our approach leverages a fusion of spectro-temporal features—Mel spectrograms, Mel Frequency Cepstral Coefficients (MFCCs), Root Mean Square (RMS) energy, and Power Spectral Density (PSD)—extracted from 5-second PCG segments. The comprehensive features are subsequently input into a two-dimensional Convolutional Neural Network (2D-CNN) for the purpose of classification. To address the common challenge of class imbalance in medical datasets and to improve model robustness, data augmentation techniques are employed. We validate our model on the CirCor DigiScope dataset [18,19,20], demonstrating its potential as an effective tool for early cardiovascular risk stratification, particularly in settings with limited access to advanced diagnostic equipment.
The main contributions of this work are as follows:
  • A robust feature engineering approach combining four distinct spectro-temporal representations of PCG signals.
  • The application of a 2D-CNN architecture tailored for classifying these fused PCG features for murmur detection.
  • An effective data augmentation strategy to enhance model performance and generalization.
  • Demonstration of the model’s efficacy on a publicly available dataset, highlighting its potential for clinical applicability as an early indicator for conditions potentially involving arrhythmias.

2. Materials and Methods

This section outlines the dataset employed, the preprocessing methodologies implemented, the feature extraction pipeline established, the proposed convolutional neural network architecture, as well as the training and evaluation framework. The comprehensive methodology is illustrated in Figure 1.

2.1. Dataset Description

This research employs the “CirCor DigiScope Phonocardiogram Dataset” [9] for analysis. The dataset consists of 5272 phonocardiogram recordings obtained from 1568 subjects gathered during a clinical study conducted in Brazil utilizing a DigiScope digital stethoscope. The recordings exhibit variability in duration and were sampled at a frequency of 4000 Hz. Each recording is accompanied by metadata that encompasses patient identification and the specific recording location (pulmonary valve (PV), aortic valve (AV), mitral valve (MV), or tricuspid valve (TV)); additionally, clinical labels denote the presence or absence of murmurs, along with the comprehensive assessment of the cardiac condition. This investigation concentrated on the task of murmur detection. The dataset underwent processing to isolate individual recordings associated with murmur labels, specifically categorized as ‘Present’ or ‘Absent’. Recordings from all four standard auscultation locations were taken into consideration. Individuals categorized with an ‘Unknown’ murmur status were omitted from this analysis. The principal designation employed for classification was ‘Murmur,’ with ‘Present’ assigned to class 1 and ‘Absent’ allocated to class 0.

2.2. Data Preprocessing

Each PCG recording was processed as follows:
  • Loading: Audio files in .wav format were loaded using the Librosa library [21], preserving the original sampling rate of 4000 Hz.
  • Segmentation: To standardize input size for the CNN, recordings were segmented into 5-second durations. Recordings shorter than 5 s were zero-padded to ensure uniform length.
  • Framing for Training Data: In the primary data preparation phase for model training, recordings underwent processing through a sliding window mechanism set at 5 s (win_len = sr * 5), accompanied by a stride of 1 s (stride = sr * 1). This methodology enhances the quantity of samples accessible for training purposes. Each 5 s segment was assigned the murmur label corresponding to the parent recording.

2.3. Feature Extraction

For each 5 s phonocardiogram (PCG) segment y ( t ) , four distinct spectro-temporal features were extracted to characterize both the time and frequency domains. The analysis was conducted using the following parameters: sampling rate f s = 4000 Hz , number of Mel bands N mel = 40 , number of MFCCs N MFCC = 40 , and maximum frequency f max = 1000 Hz for Mel spectrogram computation [22,23].
  • Mel Spectrogram: The Mel spectrogram S mel ( m , t ) R N mel × T was computed by applying a Mel filter bank to the power spectrum of the short-time Fourier transform (STFT) of y ( t ) :
    S mel ( m , t ) = MelFilterBank | F { y ( t ) } | 2 ,
    where F { y ( t ) } denotes the STFT of the signal and T is the number of time frames (approximately 40 for a 5-s segment).
  • Mel Frequency Cepstral Coefficients (MFCCs): The MFCCs C ( n , t ) R N MFCC × T were computed by applying a discrete cosine transform (DCT) to the logarithm of the Mel spectrogram:
    C ( n , t ) = DCT log ( S mel ( m , t ) ) .
  • Root Mean Square (RMS) Energy: The RMS energy E rms ( t ) R 1 × T was calculated as:
    E rms ( t ) = 1 N i = 1 N y i 2 ,
    where y i represents the samples in each analysis frame.
  • Power Spectral Density (PSD): A simplified estimate of the power spectral density P ( f ) R 1 × T was obtained using the one-sided magnitude of the Fourier transform:
    P ( f ) = F { y ( t ) } 2 , f 0 , f s 2 ,
    with the resulting array resized to match the temporal resolution T of the other features.
Feature Fusion: The extracted features were concatenated along the feature axis to form a unified representation. Specifically, the Mel spectrogram S mel R 40 × T , MFCCs C R 40 × T , RMS energy E rms R 1 × T , and power spectral density P R 1 × T were vertically stacked to form a combined feature map:
F = S mel C E rms P R 82 × T .
Assuming T 40 time frames for each 5-second segment, the resulting input tensor for the convolutional neural network (CNN) is:
X R 82 × 40 × 1 ,
where the last dimension corresponds to a single input channel.
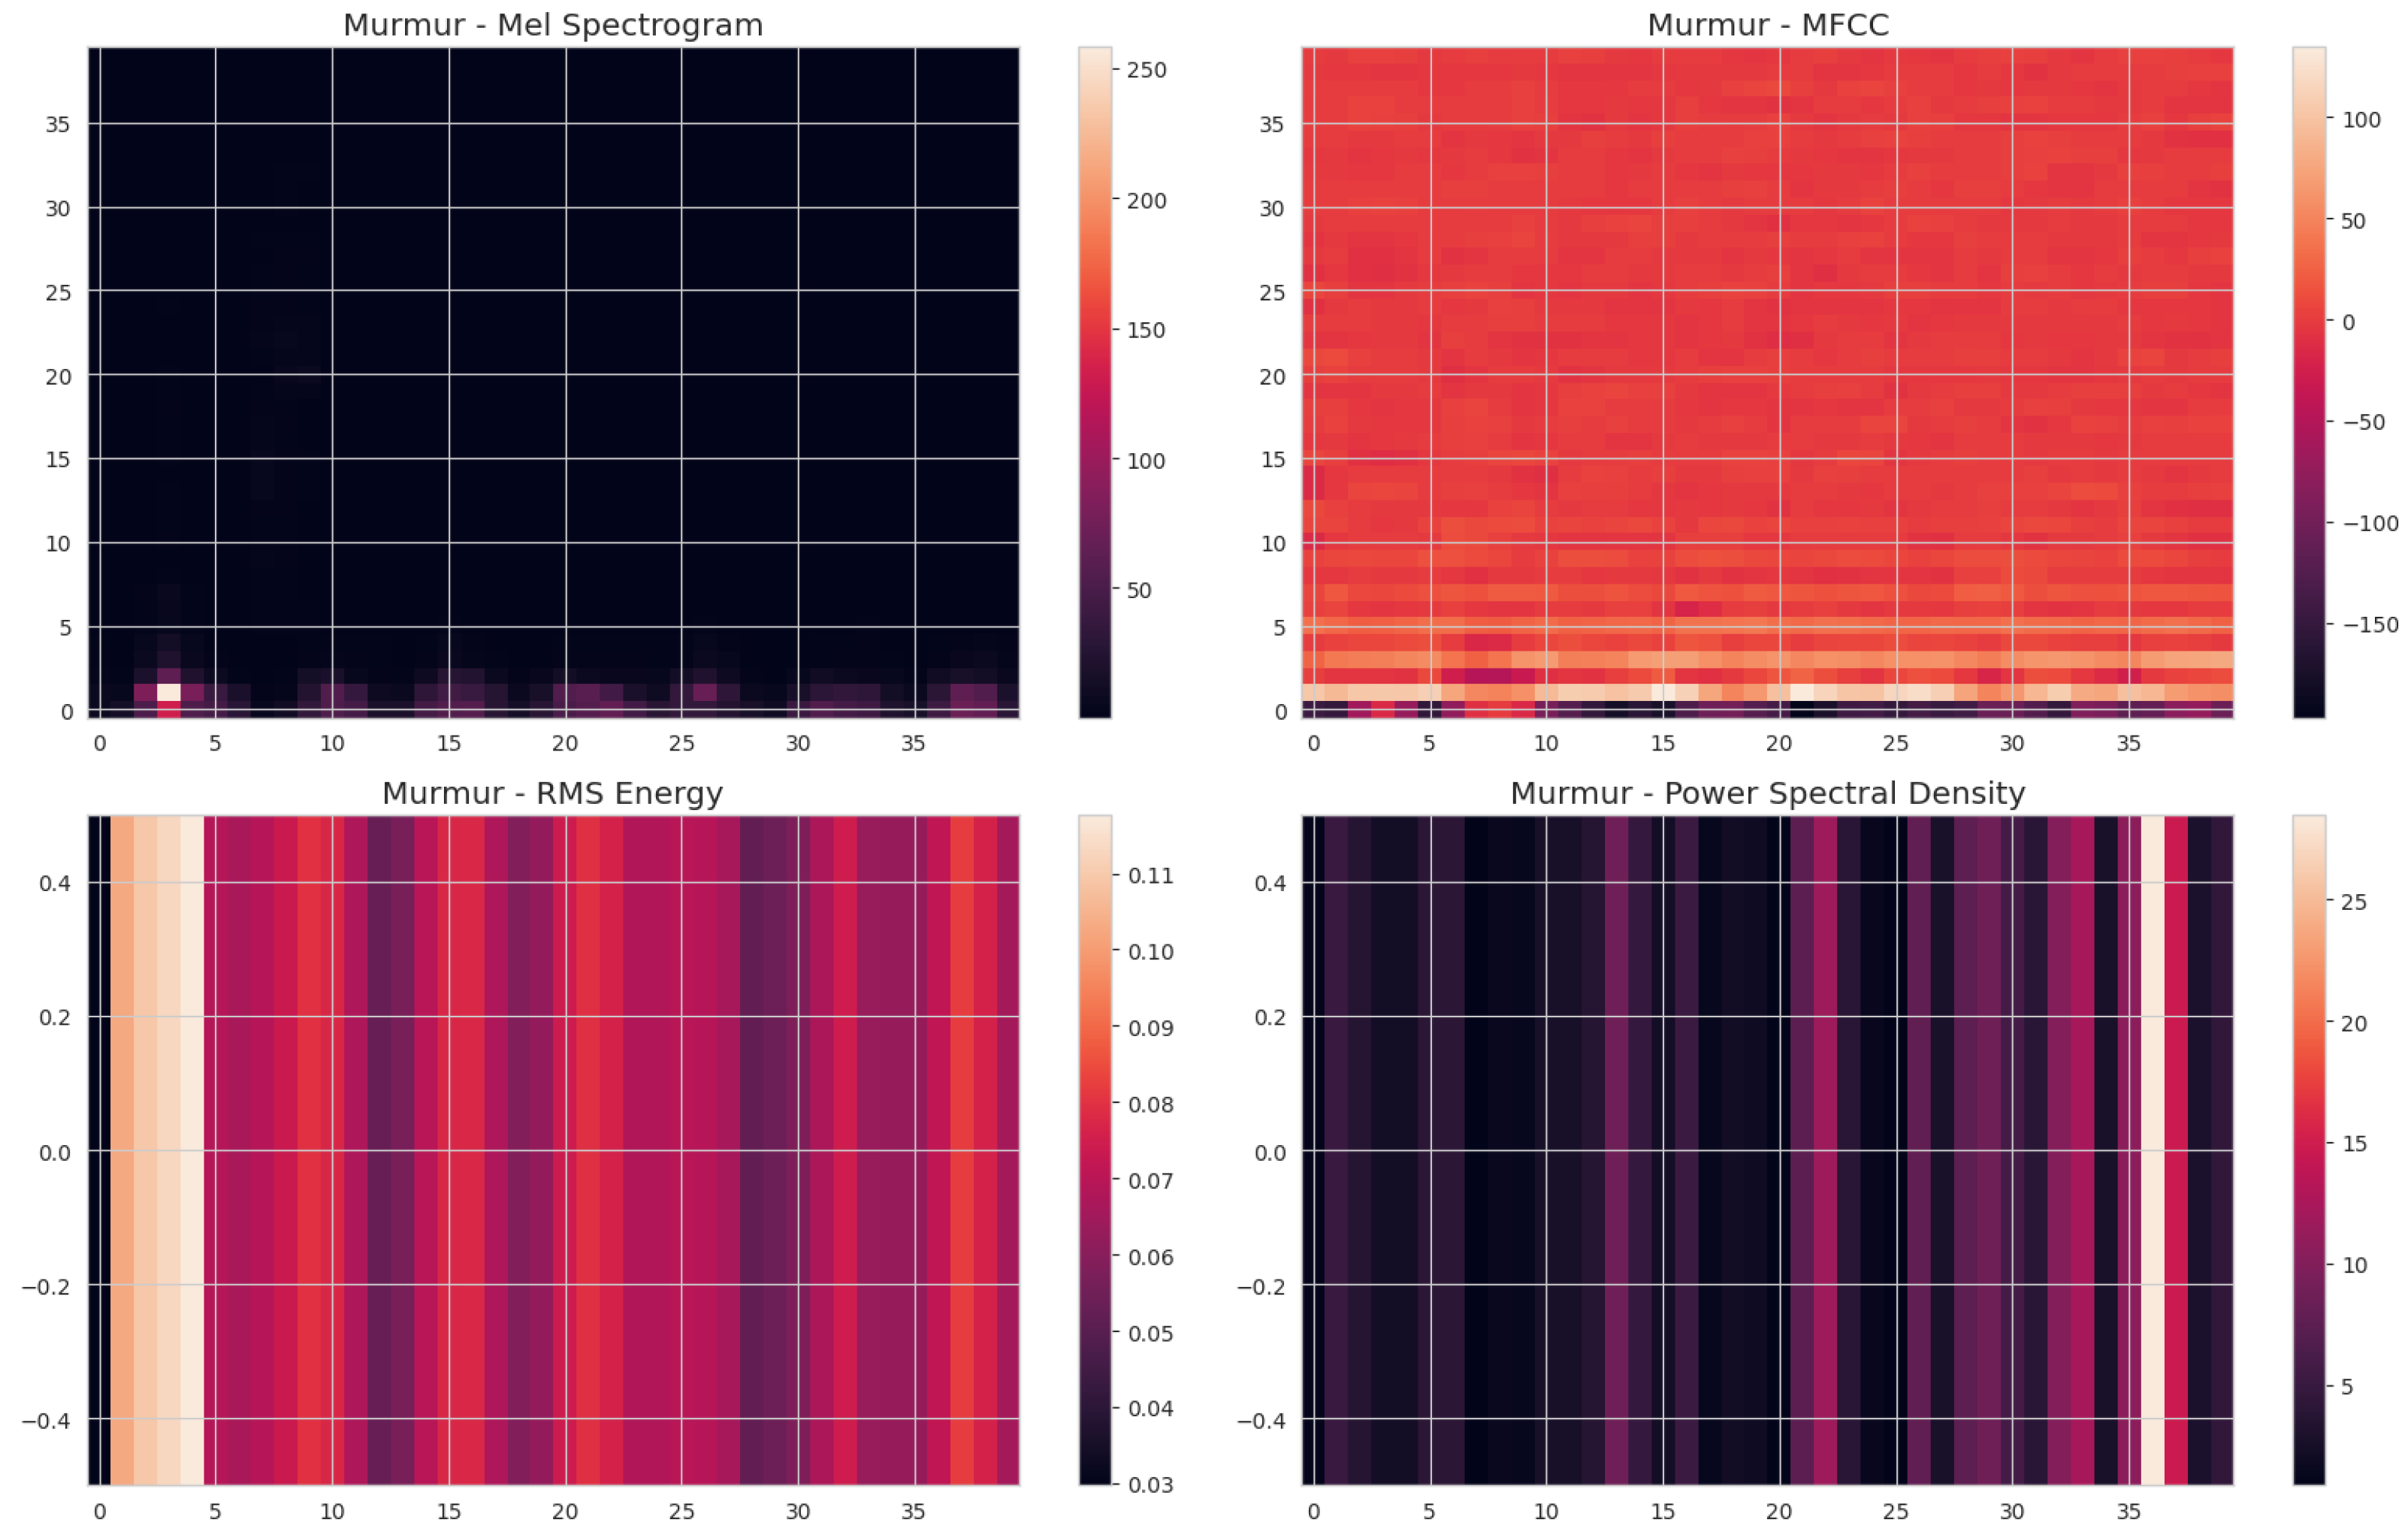
Example feature maps are shown in Figure 2 and Figure 3.

2.4. Model Architecture

The convolutional neural network (CNN) architecture outlined in Table 1 is specifically engineered to analyze 2D spectro-temporal representations of phonocardiogram (PCG) signals. The input shape is defined as (82, 40, 1), where the dimension of 82 pertains to the aggregated features, including Mel spectrogram, MFCCs, RMS, and PSD, while the dimension of 40 indicates the quantity of time frames utilized in the analysis. The architecture initiates with a two-dimensional convolutional layer that incorporates 32 filters, each utilizing a 3 × 3 kernel alongside a ReLU activation function. This configuration employs same padding to maintain the spatial dimensions throughout the processing stages. Subsequently, a 2 × 2 max pooling layer is implemented, which effectively diminishes the spatial resolution by a factor of two. A subsequent convolutional layer comprising 64 filters and utilizing a 3 × 3 kernel is implemented, which is again succeeded by a 2 × 2  max pooling layer. This sequence yields an output with the dimensions (20, 10, 64). The feature maps are subsequently transformed into a one-dimensional vector of size 12,800, which is then processed through a fully connected (dense) layer comprising 128 units, utilizing ReLU activation. A dropout layer with a rate of 0.5 is implemented to mitigate the risk of overfitting. Ultimately, the architecture concludes with a densely connected output layer featuring a solitary neuron that employs a sigmoid activation function. This configuration yields a probability score that is appropriate for binary classification tasks, such as differentiating between normal and abnormal heart sounds.

2.5. Training and Evaluation

  • Data Splitting: The dataset was partitioned into training and testing sets using an 80:20 ratio to ensure proper model evaluation and to avoid data leakage.
  • Model Compilation: The CNN model was compiled using the Adam optimizer, with the binary cross-entropy loss function (binary_crossentropy) appropriate for binary classification tasks. Model performance was monitored using the accuracy metric.
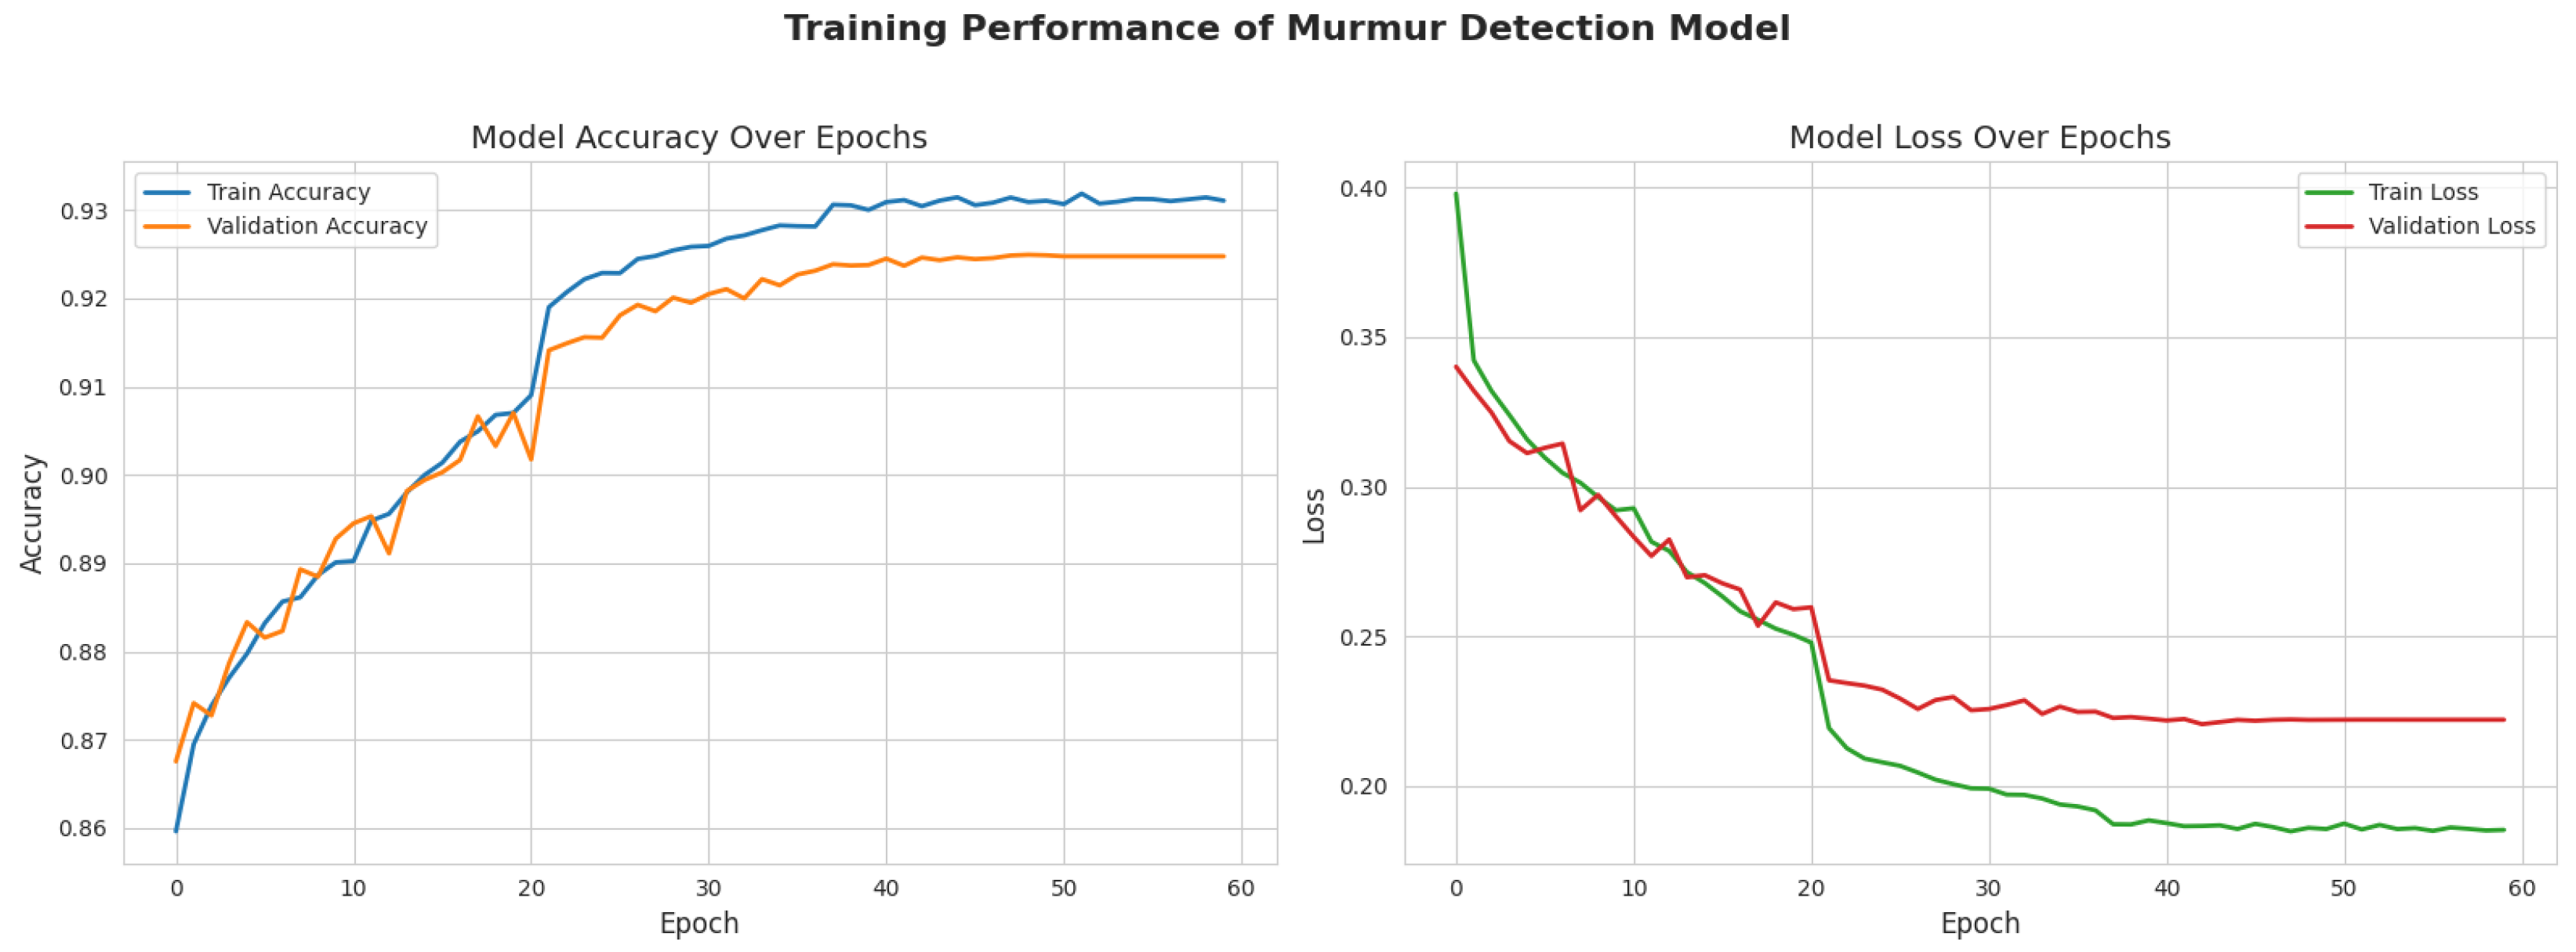
  • Training Procedure: The training process was conducted over a total of 60 epochs, divided into two phases: an initial training phase of 30 epochs followed by a fine-tuning phase of an additional 30 epochs. A batch size of 32 was used throughout. During fine-tuning, a learning rate scheduler such as ReduceLROnPlateau may have been employed to adaptively reduce the learning rate when the validation performance plateaued, promoting better convergence.
  • Evaluation Metrics: The model’s performance was assessed using a comprehensive set of evaluation metrics—accuracy, loss, precision, recall, F1-score, and the confusion matrix—enabling a balanced evaluation of both overall and class-specific performance.
Prior to training, the input feature matrix X R N × 82 × 40 (where N is the number of samples) was reshaped to R N × 82 × 40 × 1 to conform to the expected input format of the convolutional layers, which require a channel dimension.

3. Results

3.1. Model Performance

On the unseen test set, the model achieved
  • Test Accuracy: 92.40%
  • Test Loss (Binary Cross-Entropy): 0.2242
The training and validation accuracy and loss curves over 60 epochs are shown in Figure 4.

3.2. Classification Report and Confusion Matrix

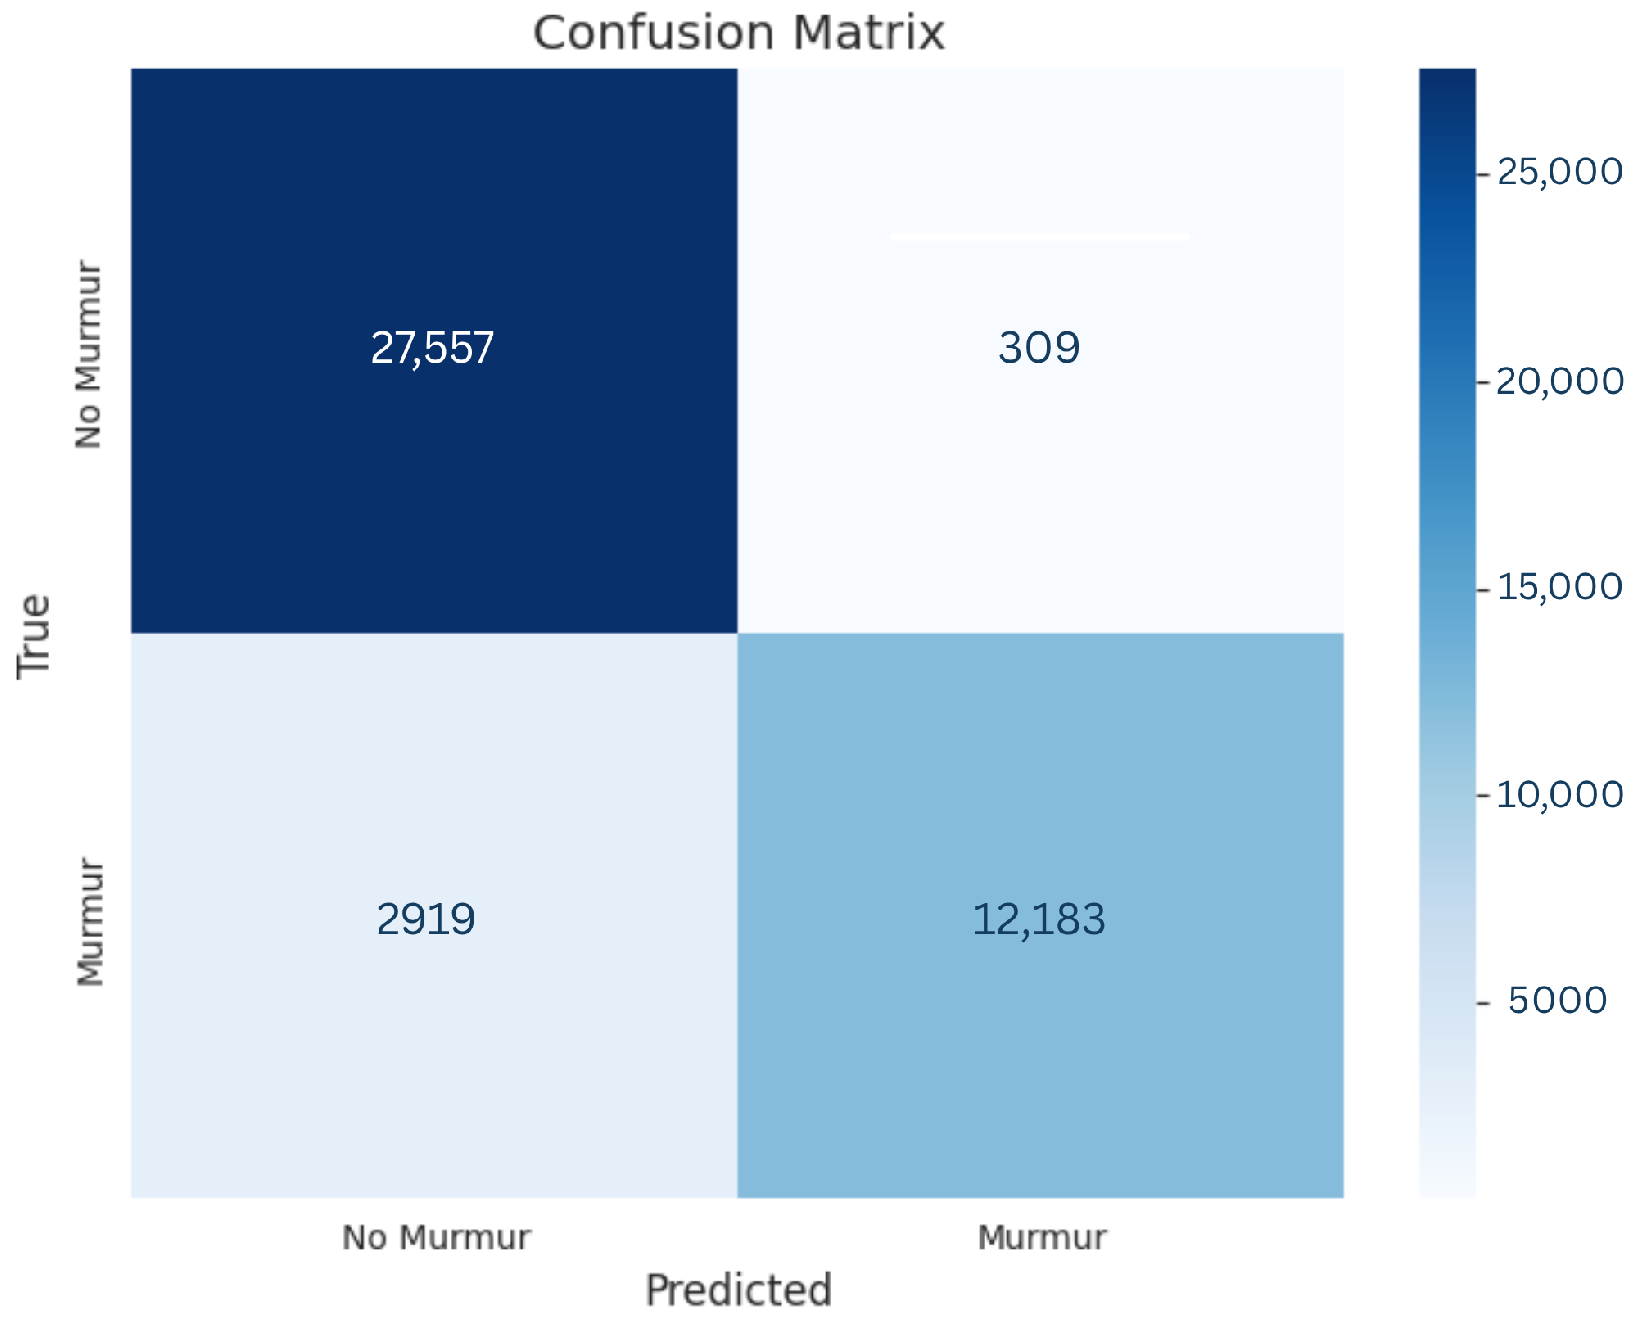
A detailed classification report (Table 2) and confusion matrix (Figure 5) were generated for the test set.

4. Discussion

The findings highlight the efficacy of the suggested deep learning framework in the classification of phonocardiograms (PCG). The model exhibits an accuracy of 92.40% alongside a test loss of 0.2242, indicating robust discriminative performance and underscoring its ability to acquire significant representations of murmur patterns. The observed high accuracy is a result of the integration of various spectro-temporal features, including Mel spectrogram, MFCCs, RMS energy, and global power spectral density (PSD), which collectively provide a thorough acoustic characterization of heart sounds. The learning curves presented in Figure 4 demonstrate a smooth convergence pattern and exhibit minimal overfitting, thereby implying a robust capacity for generalization to previously unseen data. The application of data augmentation techniques during the training phase likely contributed to an enhancement in robustness. Additional insights are elucidated through the classification report (Table 2) and the confusion matrix (Figure 5), which present comprehensive performance metrics including precision and recall, with a particular focus on the murmur class—an important factor for screening applications where sensitivity is paramount. Our methodology is consistent with previous research that utilizes 2D convolutional neural networks for the analysis of phonocardiograms [24,25,26]. Nonetheless, the incorporation of four unique feature types along with the application of overlapping window-based augmentation serves to distinguish our methodology. In comparison to prior research utilizing public datasets [21,27,28], our findings demonstrate competitive performance. This suggests that the integration of RMS and global PSD with conventional time–frequency representations enhances the model’s ability to effectively capture the intricate and varied acoustic signatures associated with pathological heart sounds.

5. Conclusions

This research presents an advanced deep learning framework aimed at the detection of heart murmurs from phonocardiogram (PCG) signals, utilizing a synthesis of cutting-edge signal processing and machine learning methodologies. The methodology incorporates a variety of acoustic features, such as Mel spectrograms, Mel-frequency cepstral coefficients (MFCCs), root mean square (RMS) energy, and power spectral density (PSD), which are combined to obtain a thorough representation of the PCG signals. The features undergo processing via a two-dimensional convolutional neural network (2D-CNN), which demonstrates proficiency in recognizing intricate patterns within the data. In order to improve the robustness and generalizability of the model, various data augmentation techniques were implemented. These included time stretching, pitch shifting, and the addition of noise, all aimed at artificially enlarging the training dataset and reducing the risk of overfitting. The proposed model underwent a thorough evaluation utilizing the publicly accessible CirCor DigiScope dataset, which comprises an extensive array of PCG recordings. The findings indicate a significant classification performance, as evidenced by the model attaining an accuracy of 92.40% alongside a low loss value of 0.2242. This suggests its efficacy in differentiating between normal heart sounds and those exhibiting murmurs.
The results highlight the promise of this approach as a non-invasive and economically viable screening instrument for cardiovascular disorders linked to heart murmurs, including valvular heart diseases, congenital heart defects, and other anomalies that could increase the risk of arrhythmias. This methodology demonstrates significant potential in environments with limited resources, where the availability of sophisticated diagnostic instruments such as echocardiography is frequently constrained. The utilization of PCG signals, obtainable through cost-effective and portable devices, presents a scalable approach for the early detection and ongoing monitoring of cardiac conditions within underserved populations. Nonetheless, although the findings are promising, additional investigation is required to enhance the model, improve its efficacy across various demographics, and confirm its practical application in clinical environments. Further research may concentrate on the integration of larger and more diverse datasets, the examination of alternative feature combinations, or the incorporation of the model into wearable technology for ongoing monitoring, thus improving its relevance in telemedicine and point-of-care diagnostics.

Author Contributions

Onceptualization, F.-E.B.-B., B.J. and A.E.; methodology, F.-E.B.-B. and A.E.; software, A.E.; validation, F.-E.B.-B., B.J., O.M., Y.A.B., D.S. and A.E.; formal analysis, A.E.; investigation, F.-E.B.-B. and A.E.; resources, O.M., Y.A.B., D.S. and A.E.; data curation, A.E.; writing—original draft preparation, F.-E.B.-B., B.J. and A.E.; writing—review and editing, O.M., Y.A.B., D.S. and A.E.; visualization, A.E.; supervision, F.-E.B.-B., B.J. and A.E.; project administration, B.J. and A.E.; funding acquisition, A.E. All authors have read and agreed to the published version of the manuscript.

Funding

This research received no external funding.

Institutional Review Board Statement

This study utilized the widely recognized The CirCor DigiScope Phonocardiogram Dataset. Ethical review and approval were waived for this study, due to the use of publicly available datasets.

Informed Consent Statement

This study used publicly available dataset where informed consent was obtained from all subjects involved in the study.

Data Availability Statement

The data presented in this study are openly available in Physionet (The CirCor DigiScope Phonocardiogram Dataset) (https://physionet.org/content/circor-heart-sound/1.0.3/) (accessed on 16 July 2025).

Conflicts of Interest

The authors declare no conflicts of interest.

References

  1. World Health Organization. Cardiovascular Diseases (CVDs). 2021. Available online: https://www.who.int/news-room/fact-sheets/detail/cardiovascular-diseases-(cvds) (accessed on 16 July 2025).
  2. Kligfield, P.; Gettes, L.S.; Bailey, J.J.; Childers, R.; Deal, B.J.; Hancock, E.W.; van Herpen, G.; Kors, J.A.; Macfarlane, P.; Mirvis, D.M.; et al. Recommendations for the Standardization and Interpretation of the Electrocardiogram: Part I: The Electrocardiogram and Its Technology. Circulation 2007, 115, 1306–1324. [Google Scholar] [CrossRef]
  3. Rangayyan, R.M.; Lehner, R.J. Phonocardiogram Signal Analysis: A Review. Crit. Rev. Biomed. Eng. 1987, 15, 211–236. [Google Scholar]
  4. Silverman, M.E.; Wooley, C.F. Samuel A. Levine and the history of grading systolic murmurs. Am. J. Cardiol. 2008, 102, 1107–1110. [Google Scholar] [CrossRef]
  5. Delling, F.N.; Vasan, R.S. Epidemiology and Pathophysiology of Mitral Valve Prolapse: New Insights into Disease Progression, Genetics, and Molecular Basis. Circulation 2014, 129, 2158–2170. [Google Scholar] [CrossRef]
  6. Shaver, J.A. Cardiac Auscultation: A Cost-Effective Diagnostic Skill. Curr. Probl. Cardiol. 1995, 20, 441–530. [Google Scholar] [PubMed]
  7. Arslan, Ö. Automated Detection of Heart Valve Disorders with Time–Frequency and Deep Features on PCG Signals. Biomed. Signal Process. Control 2022, 78, 103929. [Google Scholar] [CrossRef]
  8. Chen, W.; Sun, Q.; Chen, X.; Xie, G.; Wu, H.; Xu, C. Deep Learning for Heart Sound Classification: A Systematic Review. Entropy 2021, 23, 667. [Google Scholar] [CrossRef]
  9. Oliveira, J.; Renna, F.; Costa, P.D.; Nogueira, M.; Oliveira, C.; Ferreira, C.; Jorge, A.; Mattos, S.; Hatem, T.; Tavares, T.; et al. The CirCor DigiScope Dataset: From Murmur Detection to Murmur Classification. IEEE J. Biomed. Health Inform. 2022, 26, 2524–2535. [Google Scholar] [CrossRef]
  10. Durand, L.-G.; Pibarot, P. Digital Signal Processing of the Phonocardiogram: Review of the Most Recent Advancements. Crit. Rev. Biomed. Eng. 1995, 23, 163–219. [Google Scholar] [CrossRef] [PubMed]
  11. Debbal, S.M.; Bereksi-Reguig, F. Computerized Heart Sounds Analysis. Comput. Biol. Med. 2008, 38, 263–280. [Google Scholar] [CrossRef]
  12. Choi, S.; Jiang, Z. A Novel Wearable Sensor Device for Continuous Monitoring of Heart Sound. In Proceedings of the 2008 IEEE International Conference on Information and Automation, Pasadena, CA, USA, 19–23 May 2008; pp. 950–954. [Google Scholar]
  13. Zhou, X.; Guo, X.; Zheng, Y.; Zhao, Y. Detection of Coronary Heart Disease Based on MFCC Characteristics of Heart Sound. Appl. Acoust. 2023, 212, 109583. [Google Scholar] [CrossRef]
  14. Tavel, M.E. Cardiac Auscultation: A Glorious Past—And It Does Have a Future! Circulation 2006, 113, 1255–1259. [Google Scholar] [CrossRef] [PubMed]
  15. Varghees, V.N.; Ramachandran, K.I. A Novel Heart Sound Activity Detection Framework for Automated Heart Sound Analysis. Biomed. Signal Process. Control 2014, 13, 174–188. [Google Scholar] [CrossRef]
  16. Springer, D.B.; Tarassenko, L.; Clifford, G.D. Logistic Regression–HSMM-Based Heart Sound Segmentation. IEEE Trans. Biomed. Eng. 2015, 63, 822–832. [Google Scholar] [CrossRef]
  17. Chakir, F.; Jilbab, A.; Nacir, C.; Hammouch, A. Phonocardiogram Signals Processing Approach for PASCAL Classifying Heart Sounds Challenge. Signal Image Video Process. 2018, 12, 1149–1155. [Google Scholar] [CrossRef]
  18. Schölzel, C.; Dominik, A. Can Electrocardiogram Classification Be Applied to Phonocardiogram Data?—An Analysis Using Recurrent Neural Networks. In Proceedings of the 2016 Computing in Cardiology Conference (CinC), Vancouver, BC, Canada, 11–14 September 2016; IEEE: Piscataway, NJ, USA; pp. 581–584. [Google Scholar]
  19. Latifi, S.A.; Ghassemian, H.; Imani, M. Classification of Heart Sounds Using Multi-Branch Deep Convolutional Network and LSTM-CNN. arXiv 2024, arXiv:2407.10689. Available online: https://arxiv.org/abs/2407.10689 (accessed on 10 March 2025). [CrossRef]
  20. Chen, T.-E.; Yang, S.-I.; Ho, L.-T.; Tsai, K.-H.; Chen, Y.-H.; Chang, Y.-F.; Lai, Y.-H.; Wang, S.-S.; Tsao, Y.; Wu, C.-C. S1 and S2 Heart Sound Recognition Using Deep Neural Networks. IEEE Trans. Biomed. Eng. 2016, 64, 372–380. [Google Scholar] [CrossRef]
  21. McFee, B.; Raffel, C.; Liang, D.; Ellis, D.P.W.; McVicar, M.; Battenberg, E.; Nieto, O. librosa: Audio and Music Signal Analysis in Python. In Proceedings of the 14th Python in Science Conference (SciPy 2015), Austin, TX, USA, 6–12 July 2015; pp. 18–24. [Google Scholar]
  22. Potes, C.; Parvaneh, S.; Rahman, A.; Conroy, B. Ensemble of Feature-Based and Deep Learning-Based Classifiers for Detection of Abnormal Heart Sounds. In Proceedings of the 2016 Computing in Cardiology Conference (CinC), Vancouver, BC, Canada, 11–14 September 2016; pp. 621–624. [Google Scholar]
  23. Noman, M.F.; Goya, M.S.R.; Islam, M.M. An Efficient Murmur Detection Model Using Integrated RMFB-CNN from PCG Signal. In Proceedings of the 2019 International Conference on Electrical, Computer and Communication Engineering (ECCE), Cox’s Bazar, Bangladesh, 7–9 February 2019; pp. 1–6. [Google Scholar]
  24. Oh, S.L.; Ng, E.Y.K.; Tan, R.S.; Acharya, U.R. Automated Diagnosis of Arrhythmia Using Combination of CNN and LSTM Techniques with Variable Length Heart Beats. Comput. Biol. Med. 2018, 102, 278–287. [Google Scholar] [CrossRef]
  25. Shaker, A.M.; Tantawi, M.; Shedeed, H.A.; Tolba, M.F. Generalization of Convolutional Neural Networks for ECG Classification Using Generative Adversarial Networks. IEEE Access 2020, 8, 35592–35605. [Google Scholar] [CrossRef]
  26. Torres, J.; Oliveira, J.; Gomes, E.F. The Usage of Data Augmentation Strategies on the Detection of Murmur Waves in a PCG Signal. In Proceedings of the 15th International Joint Conference on Biomedical Engineering Systems and Technologies (BIOSTEC 2022), Vienna, Austria, 9–11 February 2022; pp. 128–132. [Google Scholar]
  27. Leng, S.; Tan, R.S.; Chai, K.T.C.; Wang, C.; Ghista, D.; Zhong, L. The Electronic Stethoscope. Biomed. Eng. Online 2016, 15, 66. [Google Scholar] [CrossRef]
  28. Simonyan, K.; Zisserman, A. Very Deep Convolutional Networks for Large-Scale Image Recognition. arXiv 2014, arXiv:1409.1556. Available online: https://arxiv.org/abs/1409.1556 (accessed on 10 March 2025).
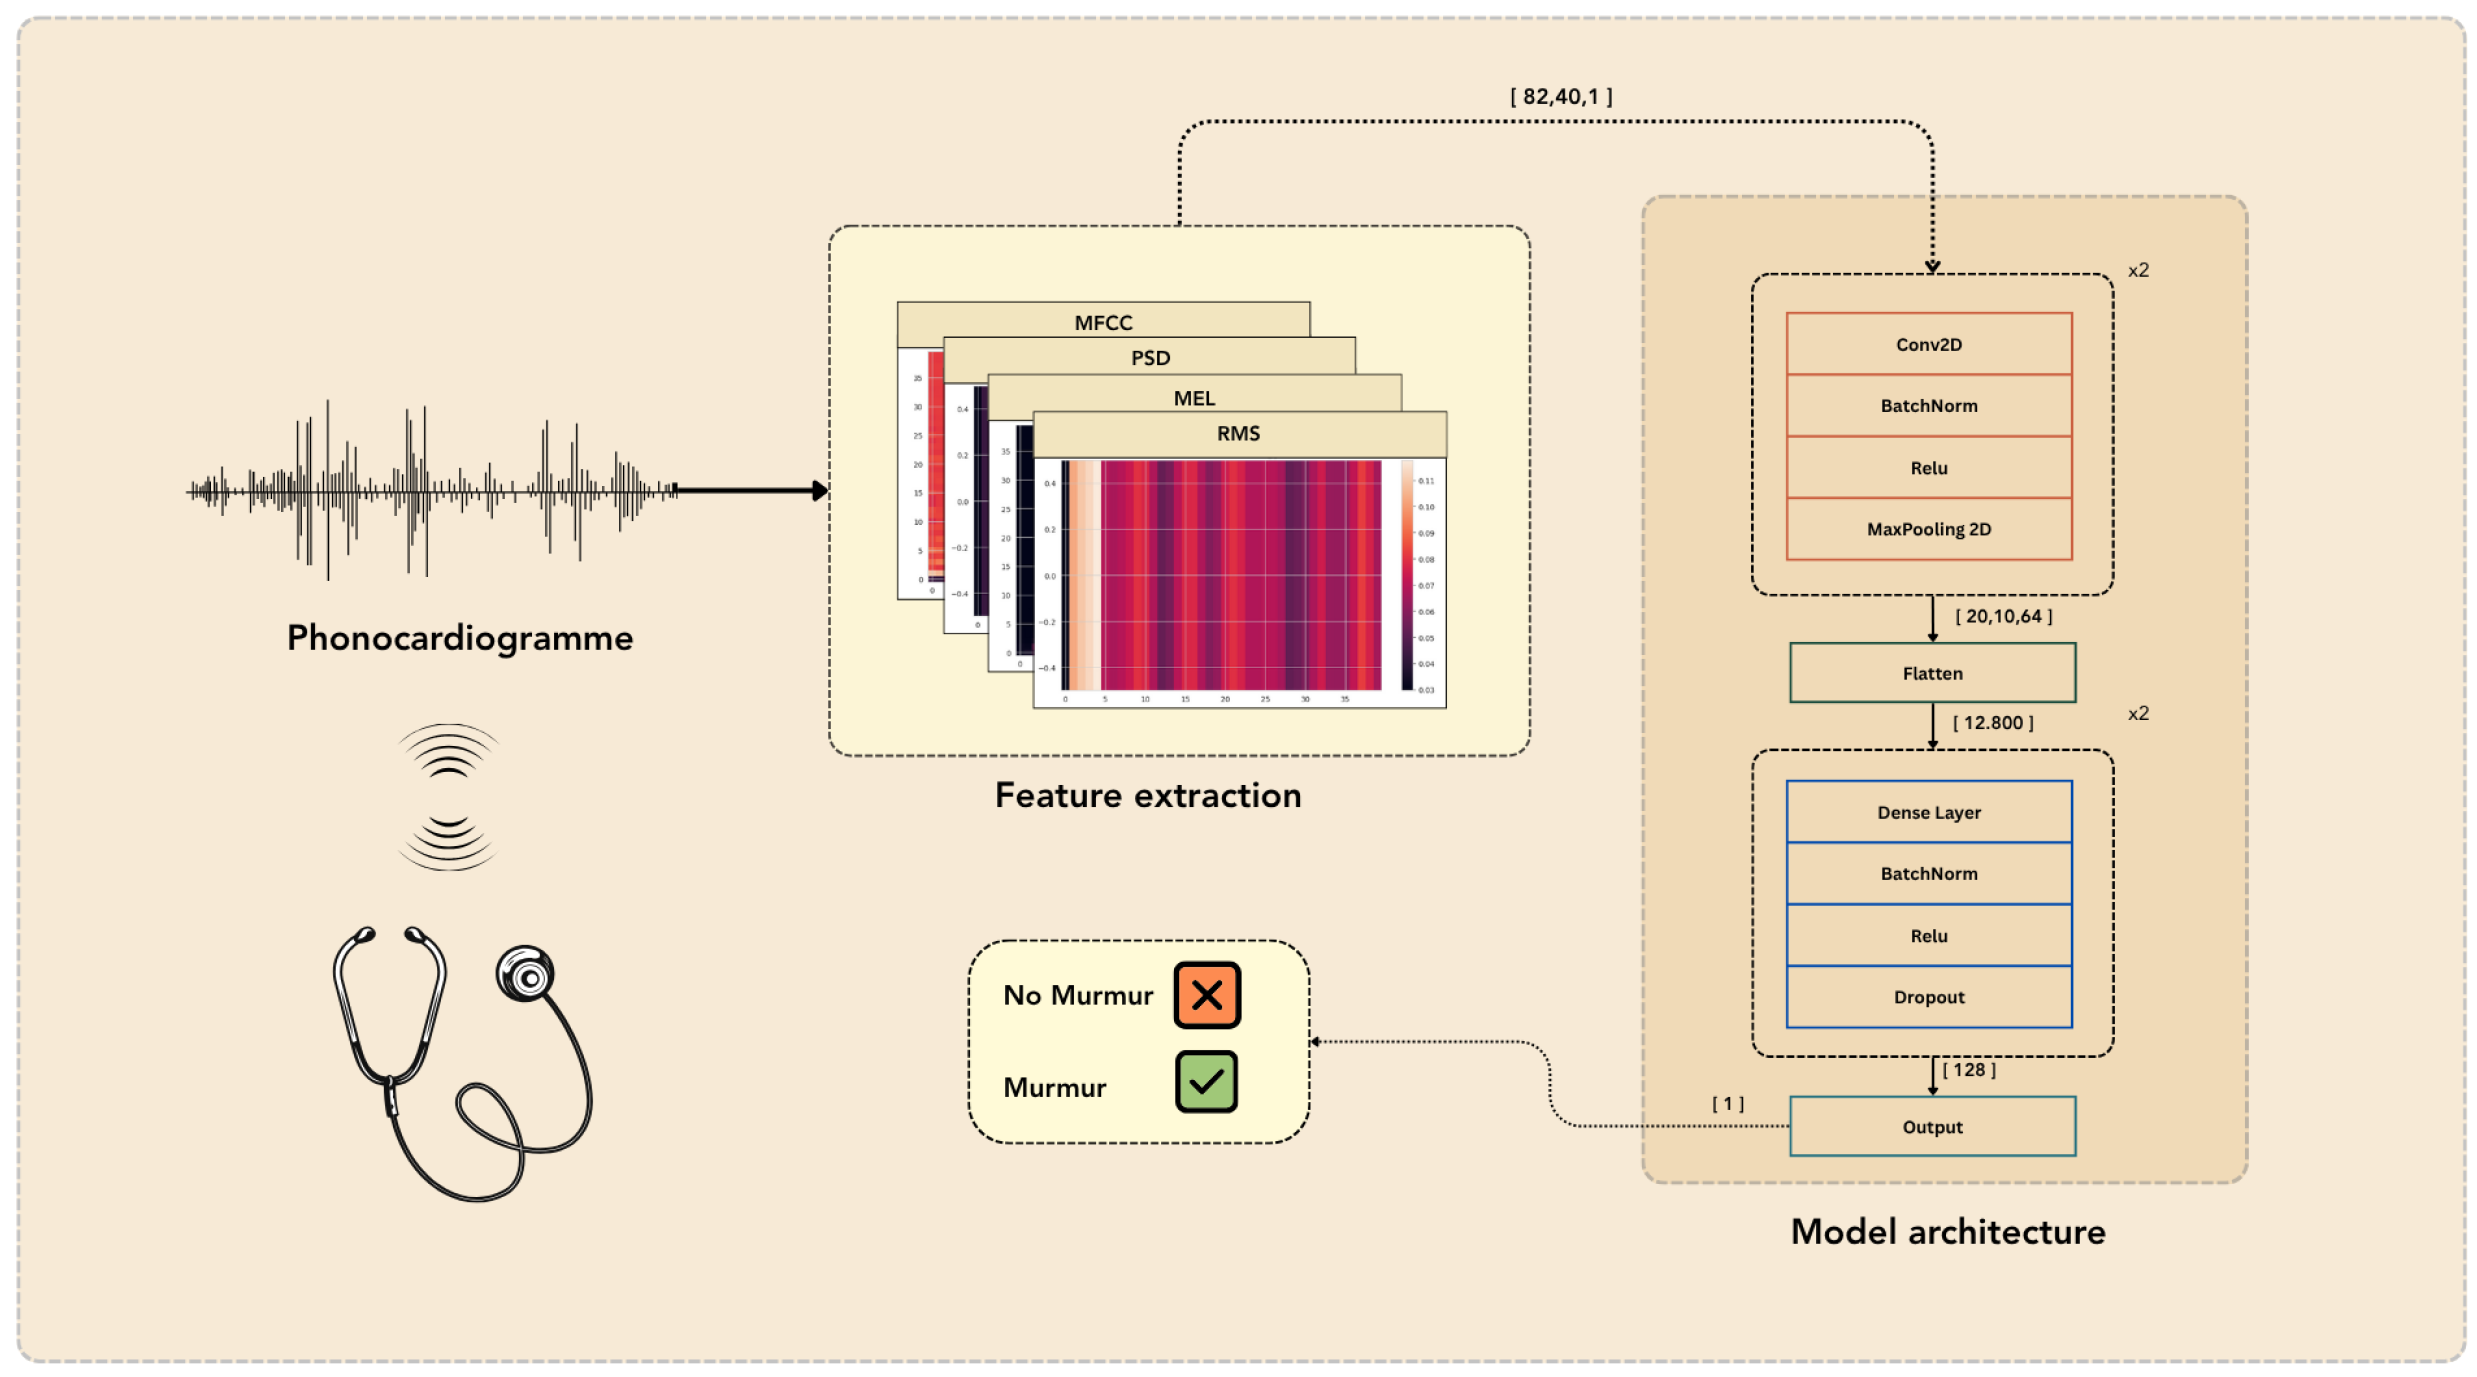
Figure 1. Overall system architecture illustrating the workflow from PCG signal acquisition to murmur classification, including feature extraction and the CNN model.
Engproc 112 00063 g001
Figure 2. Example of extracted features for a “Murmur” sample: Mel Spectrogram, MFCC, RMS Energy, Power Spectral Density.
Engproc 112 00063 g002
Figure 3. Example of extracted features for a “No Murmur” sample: Mel Spectrogram, MFCC, RMS Energy, Power Spectral Density.
Engproc 112 00063 g003
Figure 4. Model performance over epochs: training and validation accuracy, training and validation loss.
Engproc 112 00063 g004
Figure 5. Confusion matrix for murmur classification on the test set.
Engproc 112 00063 g005
Table 1. Detailed CNN Architecture Layers and Parameters.
Layer TypeFilters/UnitsKernel SizeActivationPaddingOutput Shape (Example)
Input(None, 82, 40, 1)
Conv2D32(3,3)ReLUsame(None, 82, 40, 32)
MaxPooling2D(2,2)(None, 41, 20, 32)
Conv2D64(3,3)ReLUsame(None, 41, 20, 64)
MaxPooling2D(2,2)(None, 20, 10, 64)
Flatten(None, 12,800)
Dense128ReLU(None, 128)
Dropout0.5 (rate)(None, 128)
Dense (Output)1Sigmoid(None, 1)
Table 2. Classification Report on Test Data.
ClassPrecisionRecallF1-ScoreSupport
No Murmur0.900.990.9527,866
Murmur0.980.810.8815,102
Accuracy 0.924042,968
Macro Avg0.940.900.9142,968
Weighted Avg0.930.920.9242,968
Disclaimer/Publisher’s Note: The statements, opinions and data contained in all publications are solely those of the individual author(s) and contributor(s) and not of MDPI and/or the editor(s). MDPI and/or the editor(s) disclaim responsibility for any injury to people or property resulting from any ideas, methods, instructions or products referred to in the content.