Abstract
Traditional deep learning methods for histopathological analysis suffer from a lack of interpretability, which limits their use in the clinic despite their high accuracy. This paper proposes a Topological Data Analysis (TDA) framework for interpretable colorectal cancer tissue classification. We used persistent homology to extract topological features from 5000 histological images representing eight tissue classes, combining persistence landscapes with Support Vector Machine (SVM) classification. This method achieved an overall accuracy rate of 82.70%, while providing biologically interpretable features that are directly related to tissue morphology. Topological features successfully represented cellular connectivity as well as structural patterns, enabling perfect classification of morphologically distinct tissue pairs. This research demonstrates that topological data analysis (TDA) represents a promising alternative to non-transparent methods, offering competitive efficiency while ensuring interpretability, a crucial aspect for its clinical integration in computational pathology.
1. Introduction
Histopathological image analysis is essential in contemporary computational pathology, where precise tissue classification significantly influences diagnostic accuracy and treatment results. Conventional methods have largely depended on convolutional neural networks (CNNs) and deep learning frameworks, achieving impressive accuracy rates in colorectal cancer tissue classification that surpass 90% [1]. Nevertheless, these techniques function as “black boxes”, offering minimal interpretability concerning the morphological features that inform classification choices, which presents considerable obstacles for clinical implementation, as pathologists necessitate clear reasoning behind automated diagnoses.
Topological Data Analysis (TDA) offers a persuasive alternative that mitigates interpretability issues while preserving competitive performance. TDA supplies a mathematically sound framework for quantifying shape, connectivity, and structural patterns that are directly linked to biologically significant features in histopathological images. As illustrated in applications within environmental science, TDA captures multi-scale structural information that traditional feature extraction techniques might miss [2].
The core principles of Topological Data Analysis (TDA) include Persistent Homology (PH), which facilitates multi-scale analysis of topological features by monitoring the evolution of structures across spatial scales. Persistence Diagrams (PDs) represent feature birth and death as points in a two-dimensional space, whereas Persistence Barcodes (PBs) illustrate feature lifespans as horizontal bars. Persistence Landscapes (PLs) transform persistence data into vector representations that are appropriate for machine learning applications.
TDA provides notable benefits for biological image analysis: scale invariance that allows for the simultaneous capture of patterns from cellular to tissue levels, noise robustness that reflects authentic biological structures, quantitative morphology that converts qualitative concepts into numerical descriptors, and feature interpretability that enhances understanding of the underlying biological processes.
The integration of Topological Data Analysis (TDA) with interpretable machine learning techniques, such as Support Vector Machines, results in models that effectively balance predictive accuracy with explanatory capabilities. This methodology stands in contrast to the intricacies of deep learning, as it provides advanced feature engineering through TDA alongside transparent classification systems that facilitate comprehension of both the features and the underlying decision-making processes.
This research illustrates the use of Topological Data Analysis (TDA) for the interpretable classification of colorectal cancer tissues, establishing TDA as a feasible approach for creating transparent machine learning models within the realm of computational pathology.
Our specific aims are as follows: (1) to create a thorough TDA-based pipeline that extracts biologically interpretable topological features related to tissue morphology, (2) to showcase competitive classification performance while ensuring complete transparency in the interpretation of features, (3) to establish direct correlations between topological features and histological structures through systematic visualization and analysis, and (4) to conduct a comprehensive pairwise analysis of all tissue combinations, identifying which morphological differences are most effectively represented by topological signatures and uncovering challenging cases that necessitate additional methodologies.
The paper is structured to offer methodological rigor and practical insights for researchers in computational pathology. The Methodology section thoroughly outlines our entire pipeline, starting from image preprocessing, through topological feature extraction, and ending with classification. This section also focuses on the theoretical foundations that guarantee mathematical stability. The Results section presents comprehensive performance analysis, which includes detailed confusion matrices, pairwise classification outcomes for all 28 tissue combinations, and, critically, a systematic interpretability analysis that correlates topological features with identifiable morphological structures.
The Discussion section explores the biological significance of topological features, addresses the performance-interpretability trade-off compared to deep learning methods, and provides practical recommendations for researchers implementing TDA in clinical settings. The Conclusion synthesizes key findings and outlines future directions for hybrid approaches that could combine TDA’s interpretability with enhanced performance. Throughout, our investigation demonstrates that TDA represents a significant advancement toward interpretable machine learning in computational pathology, particularly essential in medical contexts where algorithmic transparency directly impacts clinical acceptance and patient safety.
2. Theoretical Foundations
2.1. Image-to-Topology Transformation
A grayscale histopathological image is represented as . The complement transformation converts bright regions to low filtration values, ensuring dark structures (nuclei, boundaries) appear first in topological analysis [3].
We construct sublevelset filtrations for , creating nested spaces [4].
2.2. Cubical Complex and Persistent Homology
Each sublevelset forms a cubical complex where pixels become 2 cubes, shared edges become 1 cube, and vertices become 0 cubes [5]. The resulting filtration enables homology computation:
(Connected Components): Individual tissue structures or cell clusters.
(Loops): Glandular lumens, vessel cross-sections, and cellular cavities.
Birth-death tracking across the filtration is guaranteed by persistence theory [6].
2.3. Persistence Landscapes and Vectorization
Persistence diagrams are transformed to persistence landscapes for vector representation [7]. Each point creates a tent function , and the k-th landscape is -th largest value of .
Discretization at 200 uniform points over creates fixed-length vectors. Concatenating multiple landscape levels for and yields 2000-dimensional feature vectors.
2.4. Autoencoder Compression
High-dimensional persistence vectors (2000D) suffer from curse of dimensionality and overfitting risk [8]. Autoencoders provide nonlinear compression superior to linear methods for complex topological relationships [9].
The encoder with architecture 2000→512→256→128→50 learns:
The symmetric encoder–decoder ensures reconstruction quality while capturing essential topological information in the 50D bottleneck.
2.5. SVM Classification
SVMs provide maximum margin guarantees and handle high-dimensional spaces efficiently with limited data [10]. Min-Max normalization to ensures proper Radial Basis Function (RBF) kernel distance computation:
For eight-class tissue classification, one-vs.-one approach constructs binary classifiers, each solving:
2.6. Pipeline Stability
Theoretical stability flows through the complete pipeline: persistence stability under image perturbations [11], landscape stability bounded by persistence stability [7], autoencoder Lipschitz continuity, and SVM generalization bounds [10]. This ensures the transformation from pixels to classification decisions is mathematically sound and stable.
3. Materials and Methods
The complete methodological framework is illustrated in Figure 1, which shows the end-to-end pipeline from raw histological images to final tissue classification.
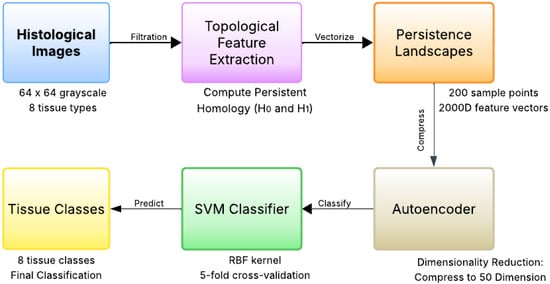
Figure 1.
Methodological framework for topological feature extraction and classification. The pipeline begins with 64 × 64 grayscale histological images from eight tissue types, followed by topological feature extraction using cubical complexes to compute and persistent homology. Persistence landscapes vectorize the topological features into 2000-dimensional representations, which are then compressed to 50 dimensions (50D) using a deep autoencoder. Finally, an RBF-kernel Support Vector Machine classifies the compressed features into eight tissue classes (Tumor, Stroma, Complex, Lympho, Debris, Mucosa, Adipose, Empty).
3.1. Dataset
We utilized the Histopathologic Cancer Detection dataset from Kaggle [12], containing 5000 grayscale images (64 × 64 pixels) with 625 samples per class across eight tissue types: Adipose, Complex, Stroma, Lympho, Mucosa, Debris, Tumor, and Empty. Images were digitized at 0.495 μm per pixel from formalin-fixed paraffin-embedded colorectal cancer specimens.
3.2. Implementation Pipeline
Figure 2 illustrates the complete autoencoder-SVM architecture used in our implementation. The pipeline processes topological features through the following four steps:
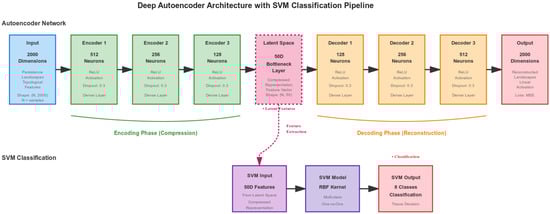
Figure 2.
Deep autoencoder architecture with symmetric encoder-decoder structure. The encoder compresses 2000-dimensional persistence landscapes to a 50-dimensional latent space through four layers (2000 → 512 → 256 → 128 → 50), with the decoder reconstructing the input symmetrically. The 50-dimensional bottleneck features are normalized and fed to an RBF-kernel SVM classifier for final tissue classification into eight classes.
Step 1: We constructed cubical complexes using the GUDHI library with complement filtrations to prioritize dark cellular structures. Persistence diagrams were computed for (connected components) and (loops) homology with coefficients.
Step 2: We discretized persistence landscapes at 200 uniform points over [0, 255], concatenating multiple landscape levels to create 2000-dimensional feature vectors capturing multi-scale topological information.
Step 3: We trained a symmetric autoencoder () with ReLU activation and 0.3 dropout using Adam optimizer and Mean Squared Error (MSE) loss, compressing features to 50 dimensions while preserving topological structure. We selected the autoencoder’s bottleneck dimension (50 D) via an ablation study (see Section 4.1) balancing reconstruction fidelity and downstream classification performance.
Step 4: We applied MinMax normalization to the 50-dimensional latent features before RBF-kernel SVM classification. We optimized hyperparameters (C, ) via 5-fold cross-validation grid search with balanced class weighting.
3.3. Analysis Framework
To evaluate topological separability between tissue types, we performed pairwise classification study comparing all possible pairs of the 28 tissue types(). For every pair of tissues, we trained binary support vector machine classifiers using the 50-dimensional autoencoder features with the same hyperparameter settings as the multi-class model.
Pairwise separability was evaluated using three distinct methods: (1) Visualizing the feature space with 3D Principal Component Analysis (PCA), by compressing the 50-dimensional features into three dimensions to visually represent how well the classes are separated; (2) Calculating the margin width, which involves measuring the geometric space between the boundaries for making decisions and the support vectors to indicate how reliable the classification is; and (3) Analyzing the decision boundary, which includes assessing how complex the boundary is to pinpoint the tissue pairs that are linearly separable versus those that are topologically overlapping.
This analysis identified which morphological variations that are accurately represented by topological features and determined which tissue pairs necessitate the use of additional, different methods.
4. Results
4.1. Classification Performance
The TDA-based framework achieved 82.70% overall accuracy across eight histological tissue categories using 5-fold cross-validation. The autoencoder successfully compressed 2000-dimensional persistence landscapes to 50 dimensions (40× reduction) while preserving discriminative power, demonstrating that essential topological relationships can be captured in compact representations.
To validate the autoencoder’s bottleneck size, we evaluated latent dimensions (10 D to 100 D) on reconstruction error (MSE) and SVM classification (Macro F1). As Table 1 shows, 50 D achieved optimal trade-offs:

Table 1.
Impact of latent dimension on autoencoder performance.
Beyond 50 D, MSE improvements diminished without F1 gains, suggesting 50 D sufficiently preserves topological discriminability while avoiding overfitting.
Our TDA-based method was contextualized by implementing a CNN baseline with a lightweight architecture that included dense layers for classification, batch normalization, dropout regularization, and three convolutional blocks (32, 64, and 128 filters). On the test set, the CNN model achieved 90% accuracy after being trained on the same 5000 histological images with identical train-test splits. Although our TDA-SVM pipeline achieves competitive results (82.70% overall accuracy with per-class performance detailed in Table 2) and offers critical interpretability benefits that are necessary for clinical adoption in computational pathology, the CNN approach shows superior raw performance.
Table 2.
Classification performance by tissue class.
Performance varies significantly across tissue types: Empty (F1: 0.93) and Adipose (F1: 0.90) achieve excellent classification due to distinctive topological signatures, while Stroma (F1: 0.69) and Complex (F1: 0.72) present challenges due to fibrous similarity and heterogeneous composition, respectively.
4.2. Topological Feature Analysis and Morphological Correspondence
We created a visualization framework that maps topological features to morphological structures in order to address interpretability issues. Birth values roughly correspond to the spatial locations in the original images, and peak detection algorithms find important features in persistence landscapes. Different morphological patterns can be seen in the visualization (Figure 3): features (red circles) depict tissue density and cellular connectivity, while features (blue circles) stand for structural cavities and glandular architecture. While mucosa displays prominent features that correspond to glandular lumens, tumor, and lympho show dense clustering that reflects high cellularity. Adipose tissue exhibits sporadic features that correspond to individual fat cells, while stroma exhibits broad connectivity patterns that match fibrous tissue networks. In both dimensions, empty tissue shows very little activity, which is consistent with sparse content. Pathologists are able to validate because of this direct feature-structure correspondence.
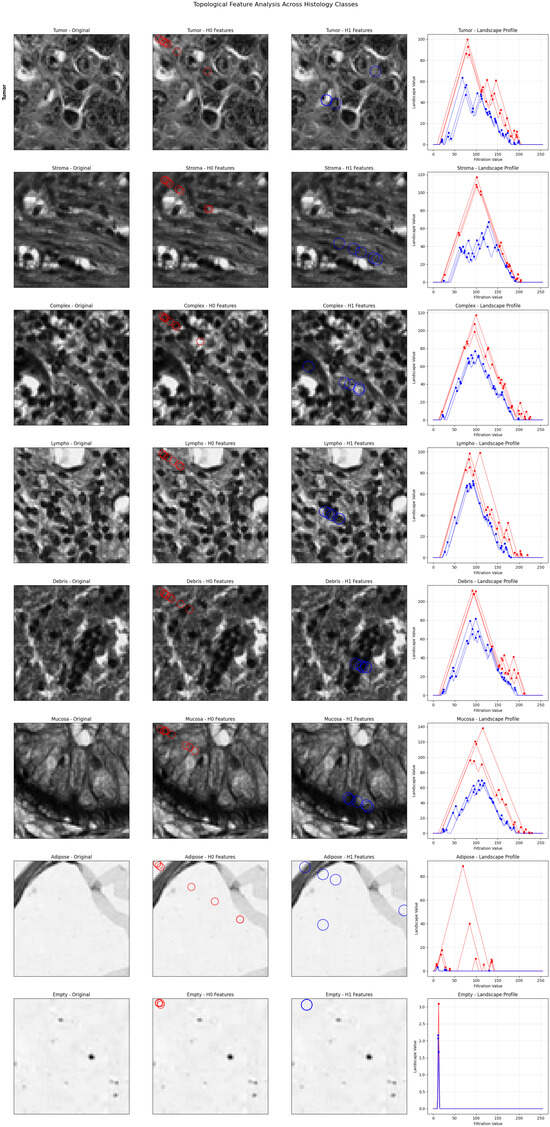
Figure 3.
Topological feature visualization showing correspondence between persistence landscapes and tissue morphology. For each tissue class (rows): (1) original histological image, (2) features (red circles) representing connected components, (3) features (blue circles) representing loops/holes, and (4) persistence landscape profiles with detected peaks. The visualization demonstrates direct mapping between topological features and recognizable histological structures.
4.3. Pairwise Classification Analysis
Comprehensive pairwise analysis of all 28 class combinations (Figure 4, Table 3) reveals varying performance based on morphological distinctiveness.
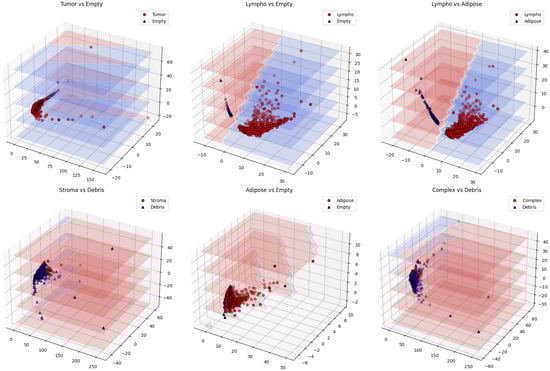
Figure 4.
Three-dimensional PCA visualization showing well-separated pairs (top) with distinct clustering versus challenging pairs (bottom) with overlapping distributions.
Table 3.
Key pairwise classification results.
Perfect separations (100% accuracy) were achieved for morphologically distinct tissue pairs and tissue-versus-background classifications, confirming TDA’s effectiveness in capturing fundamental architectural differences. The challenging stroma vs. debris case (62.3%) highlights topological overlap between fibrous tissues, suggesting the need for complementary features in future work.
4.4. Error Analysis
The confusion matrix (Figure 5) reveals strong diagonal performance with notable error patterns: stroma frequently misclassified as debris due to similar fibrous topological signatures, complex tissues showing distributed errors reflecting their mixed nature, and occasional adipose-empty confusion from similar cavity-like patterns. These errors provide insights into topological similarities between biologically related tissue types, validating the biological relevance of the extracted features.
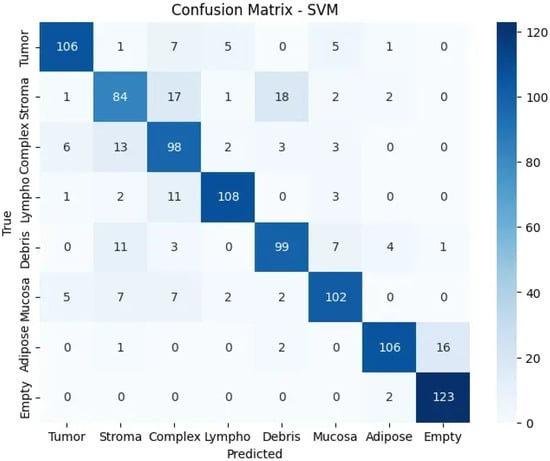
Figure 5.
Confusion matrix showing classification performance across tissue classes.
5. Discussion
Our findings indicate that Topological Data Analysis (TDA) offers a solid framework for interpretable histopathological classification, achieving an accuracy of 82.70% while preserving biological interpretability.
Although the TDA-SVM pipeline does not achieve the 90% accuracy of our CNN baseline, it offers significant benefits in terms of transparency and clinical applicability.
The persistence landscape patterns uncover important relationships between topological attributes and tissue architecture, providing pathologists with a transparent alternative to opaque deep learning methodologies. As depicted in Figure 3, the direct correlation of (cellular connectivity) and (structural cavities) features with histological forms—such as densely packed tumor cells or glandular lumens in the mucosa—enables pathologists to corroborate algorithmic conclusions with morphological truths.
The interpretability of TDA addresses critical obstacles to clinical implementation:
- Feature-Biology Mapping: Persistence landscapes directly correspond to histological structures (e.g., quantifies tissue fragmentation, captures glandular cavities), bridging the divide between abstract features and diagnostic standards.
- Scale-Aware Analysis: The multi-scale nature of TDA reveals hierarchical tissue organization, which aligns with the workflow of pathologists.
- Quantitative Morphology: Qualitative assessments (e.g., “fibrous stroma”) are converted into quantifiable descriptors, facilitating standardized evaluations.
Although CNN methods demonstrate high performance, their lack of transparency can hinder clinical confidence. Our TDA framework provides a middle ground, delivering comparable accuracy alongside interpretability—an important balance for diagnostic environments. Future research could integrate the interpretable aspects of TDA with the morphometric insights derived from CNNs to help bridge the performance gap, especially for difficult pairs such as stroma–debris (62.3% accuracy).
6. Limitations and Future Directions
While TDA provides interpretable features, optimal performance may require complementary approaches for highly similar tissue types (e.g., stroma vs. debris, 62.3% accuracy). Future work should explore hybrid methods combining topological features with targeted morphometric measurements for challenging tissue pairs. Additionally, extending the approach to larger image patches and incorporating spatial context could enhance both performance and biological relevance.
The framework establishes TDA as a valuable tool for creating interpretable machine learning models in computational pathology, particularly where clinical acceptance depends on understanding the biological basis of algorithmic decisions.
7. Conclusions
Our research shows that Topological Data Analysis provides an effective framework for interpretable histopathological tissue classification, achieving 82.70% accuracy across eight colorectal cancer tissue types. The persistence landscape approach successfully captures biologically meaningful topological features, with and homology dimensions corresponding to cellular connectivity and structural cavities respectively. Our TDA-SVM pipeline offers a transparent alternative to black-box deep learning methods while maintaining competitive performance. The comprehensive pairwise analysis reveals that topological features effectively distinguish morphologically distinct tissue types, achieving perfect separation for tissue-versus-background classifications. However, fibrous tissue types (stroma vs. debris) remain challenging, suggesting opportunities for hybrid approaches combining topological and morphometric features. The framework establishes TDA as a valuable tool for creating interpretable machine learning models in computational pathology, addressing critical barriers to clinical adoption where algorithmic transparency is essential for diagnostic acceptance and scientific understanding.
Author Contributions
Conceptualization, I.F. and J.D.; methodology, I.F.; software, I.F.; validation, I.F.; formal analysis, I.F.; investigation, I.F.; data curation, I.F.; writing—original draft preparation, I.F.; writing—review and editing, I.F. and J.D.; visualization, I.F.; supervision, J.D.; project administration, J.D. All authors have read and agreed to the published version of the manuscript.
Funding
This research received no external funding.
Institutional Review Board Statement
Not applicable.
Informed Consent Statement
Not applicable.
Data Availability Statement
The histopathological images used in this study are publicly available as the ‘Collection of textures in colorectal cancer histology’ dataset [12] accessible at https://zenodo.org/records/53169 (accessed on 15 May 2025). The implementation code and processed topological features are available upon reasonable request to the corresponding author.
Conflicts of Interest
The authors declare no conflicts of interest.
Abbreviations
The following abbreviations are used in this manuscript:
| CNN | Convolutional Neural Network |
| Zero-dimensional Homology (Connected Components) | |
| One-dimensional Homology (Loops/Holes) | |
| MSE | Mean Squared Error |
| PB | Persistence Barcodes |
| PCA | Principal Component Analysis |
| PD | Persistence Diagrams |
| PH | Persistent Homology |
| PL | Persistence Landscapes |
| RBF | Radial Basis Function |
| ReLU | Rectified Linear Unit |
| SVM | Support Vector Machine |
| TDA | Topological Data Analysis |
| Field of Two Elements (Binary Field) | |
| 2D | Two-Dimensional |
| 3D | Three-Dimensional |
References
- Tsai, M.J.; Tao, Y.H. Deep Learning Techniques for the Classification of Colorectal Cancer Tissue. Electronics 2021, 10, 1662. [Google Scholar] [CrossRef]
- Ver Hoef, L.; Adams, H.; King, E.J.; Ebert-Uphoff, I. A Primer on Topological Data Analysis to Support Image Analysis Tasks in Environmental Science. Artif. Intell. Earth Syst. 2023, 2, e220039. [Google Scholar] [CrossRef]
- Robins, V. Towards computing homology from finite approximations. Topol. Proc. 1999, 24, 503–532. [Google Scholar]
- Edelsbrunner, H.; Harer, J. Computational Topology: An Introduction; American Mathematical Society: Providence, RI, USA, 2010. [Google Scholar]
- Kaczynski, T.; Mischaikow, K.; Mrozek, M. Computational Homology; Springer: New York, NY, USA, 2004. [Google Scholar]
- Zomorodian, A.; Carlsson, G. Computing persistent homology. Discret. Comput. Geom. 2005, 33, 249–274. [Google Scholar] [CrossRef]
- Bubenik, P. Statistical topological data analysis using persistence landscapes. J. Mach. Learn. Res. 2015, 16, 77–102. [Google Scholar]
- Bellman, R. Adaptive Control Processes: A Guided Tour; Princeton University Press: Princeton, NJ, USA, 1961. [Google Scholar]
- Hinton, G.E.; Salakhutdinov, R.R. Reducing the dimensionality of data with neural networks. Science 2006, 313, 504–507. [Google Scholar] [CrossRef] [PubMed]
- Vapnik, V. The Nature of Statistical Learning Theory; Springer Science & Business Media: New York, NY, USA, 1999. [Google Scholar]
- Cohen-Steiner, D.; Edelsbrunner, H.; Harer, J. Stability of persistence diagrams. Discret. Comput. Geom. 2007, 37, 103–120. [Google Scholar] [CrossRef]
- Kather, J.N.; Weis, C.A.; Bianconi, F.; Melchers, S.M.; Schad, L.R.; Gaiser, T.; Marx, A.; Zöllner, F. Multi-class texture analysis in colorectal cancer histology. Sci. Rep. 2016, 6, 27988. [Google Scholar] [CrossRef] [PubMed]


Disclaimer/Publisher’s Note: The statements, opinions and data contained in all publications are solely those of the individual author(s) and contributor(s) and not of MDPI and/or the editor(s). MDPI and/or the editor(s) disclaim responsibility for any injury to people or property resulting from any ideas, methods, instructions or products referred to in the content. |
© 2025 by the authors. Licensee MDPI, Basel, Switzerland. This article is an open access article distributed under the terms and conditions of the Creative Commons Attribution (CC BY) license (https://creativecommons.org/licenses/by/4.0/).