1. Introduction
Because of its intrinsic volatility, non-stationarity, and the large number of interrelated factors that affect asset price movements, financial market forecasting is still a difficult and challenging undertaking. The nonlinear and dynamic characteristics seen in financial time series are frequently not well captured by traditional statistical methods. Intelligent systems that use deep learning and machine learning have demonstrated great potential in recent years for raising predicted accuracy in this field. Without depending on manually created technical indicators, this doctoral study explores the use of a variety of intelligent algorithms to forecast trading market trends using raw historical market data. Random Forest, K-Nearest Neighbors (KNN) [
1], XGBoost, Decision Tree, and Long Short-Term Memory (LSTM) in [
2,
3] networks—a kind of recurrent neural network that is especially well-suited for sequential data—are the five supervised learning approaches that are compared in this study. Time series data that depicts actual market behavior is used to train and test each model, with an emphasis on assessing the models’ capacity to identify trends, learn temporal dependencies, and generalize across various market phases. To evaluate the models’ performance using a variety of measures, including accuracy, precision, recall, and root mean square error (RMSE), a rigorous experimental framework is put into place. The study also investigates how data preprocessing techniques like windowing and normalization affect the efficacy of the model. The results demonstrate situations where some models perform better than others in terms of predictive power, computational efficiency, and robustness, exposing the relative advantages and disadvantages of each strategy. This research aids in the creation of automated decision-support tools for traders, analysts, and institutional investors by developing efficient methods for modeling financial time series using intelligent algorithms. The ultimate objective is to improve market comprehension and facilitate better-informed, data-driven investing choices in ever intricate financial landscapes.
2. Related Literature
2.1. Use of Technical Indicators in Forecasting
Numerous research stress how crucial it is to combine deep learning architectures with conventional technical indicators in order to improve prediction performance. Alongside models like Long Short-Term Memory (LSTM), Gated Recurrent Unit (GRU), and Convolutional Neural Network (CNN), indicators like Moving Average Convergence Divergence (MACD), Relative Strength Index (RSI), and Stochastic Oscillator are commonly employed. Based on market behavior, these indicators offer structured insights that assist models in identifying patterns unique to a given domain. According to studies, for example, combining these signals with raw price data greatly increases accuracy because the models use both learnt and designed features [
4].
2.2. Hybrid Model Effectiveness
Recent research suggests hybrid approaches that combine technical indicators and neural networks to overcome the drawbacks of each approach alone. An efficient method creates intelligent trading signals by combining Long Short-Term Memory (LSTM) and Gated Recurrent Unit (GRU) networks with indicators such as Moving Average Convergence Divergence (MACD), Directional Movement Index (DMI), and Know Sure Thing (KST). According to the results of these studies, GRU frequently outperforms LSTM in terms of efficiency and predictive capabilities, resulting in both increased accuracy and shorter training times [
5]. These findings highlight the potential of hybrid architectures for financial forecasting, particularly in complicated and noisy market environments.
2.3. ARIMA vs. Deep Learning Approaches
Because of their simplicity and interpretability, conventional statistical methods like Autoregressive Integrated Moving Average (ARIMA) have been used for forecasting time series data for many years. However, when dealing with long-term or nonlinear dependencies, their performance deteriorates. Deep learning models, on the other hand, like LSTM, can simulate intricate, nonlinear patterns over long time periods. This difference is supported by comparative research [
6], which shows that LSTM is superior at capturing long-range, nonlinear behavior, whereas ARIMA is better at short-term, linear trends. The argument for hybrid models that combine the interpretability of ARIMA with the predictive power of deep learning is supported by this comparison.
2.4. Impact of Market Volatility on Model Performance
Predictive modeling faces considerable challenges due to fluctuations in the market. By analyzing the effectiveness of indices such as the S&P 500 and Nasdaq 100 over various trading periods (e.g., 24 h, daytime, and overnight sessions), several research examine how models like LSTM react to volatility. Findings indicate that training durations and volatility levels affect LSTM’s performance, with shorter training times producing better outcomes for more volatile assets [
5]. This implies that in order to maximize returns, model tweaking needs to take market-specific factors into consideration.
3. Materials and Methods
3.1. Methodology
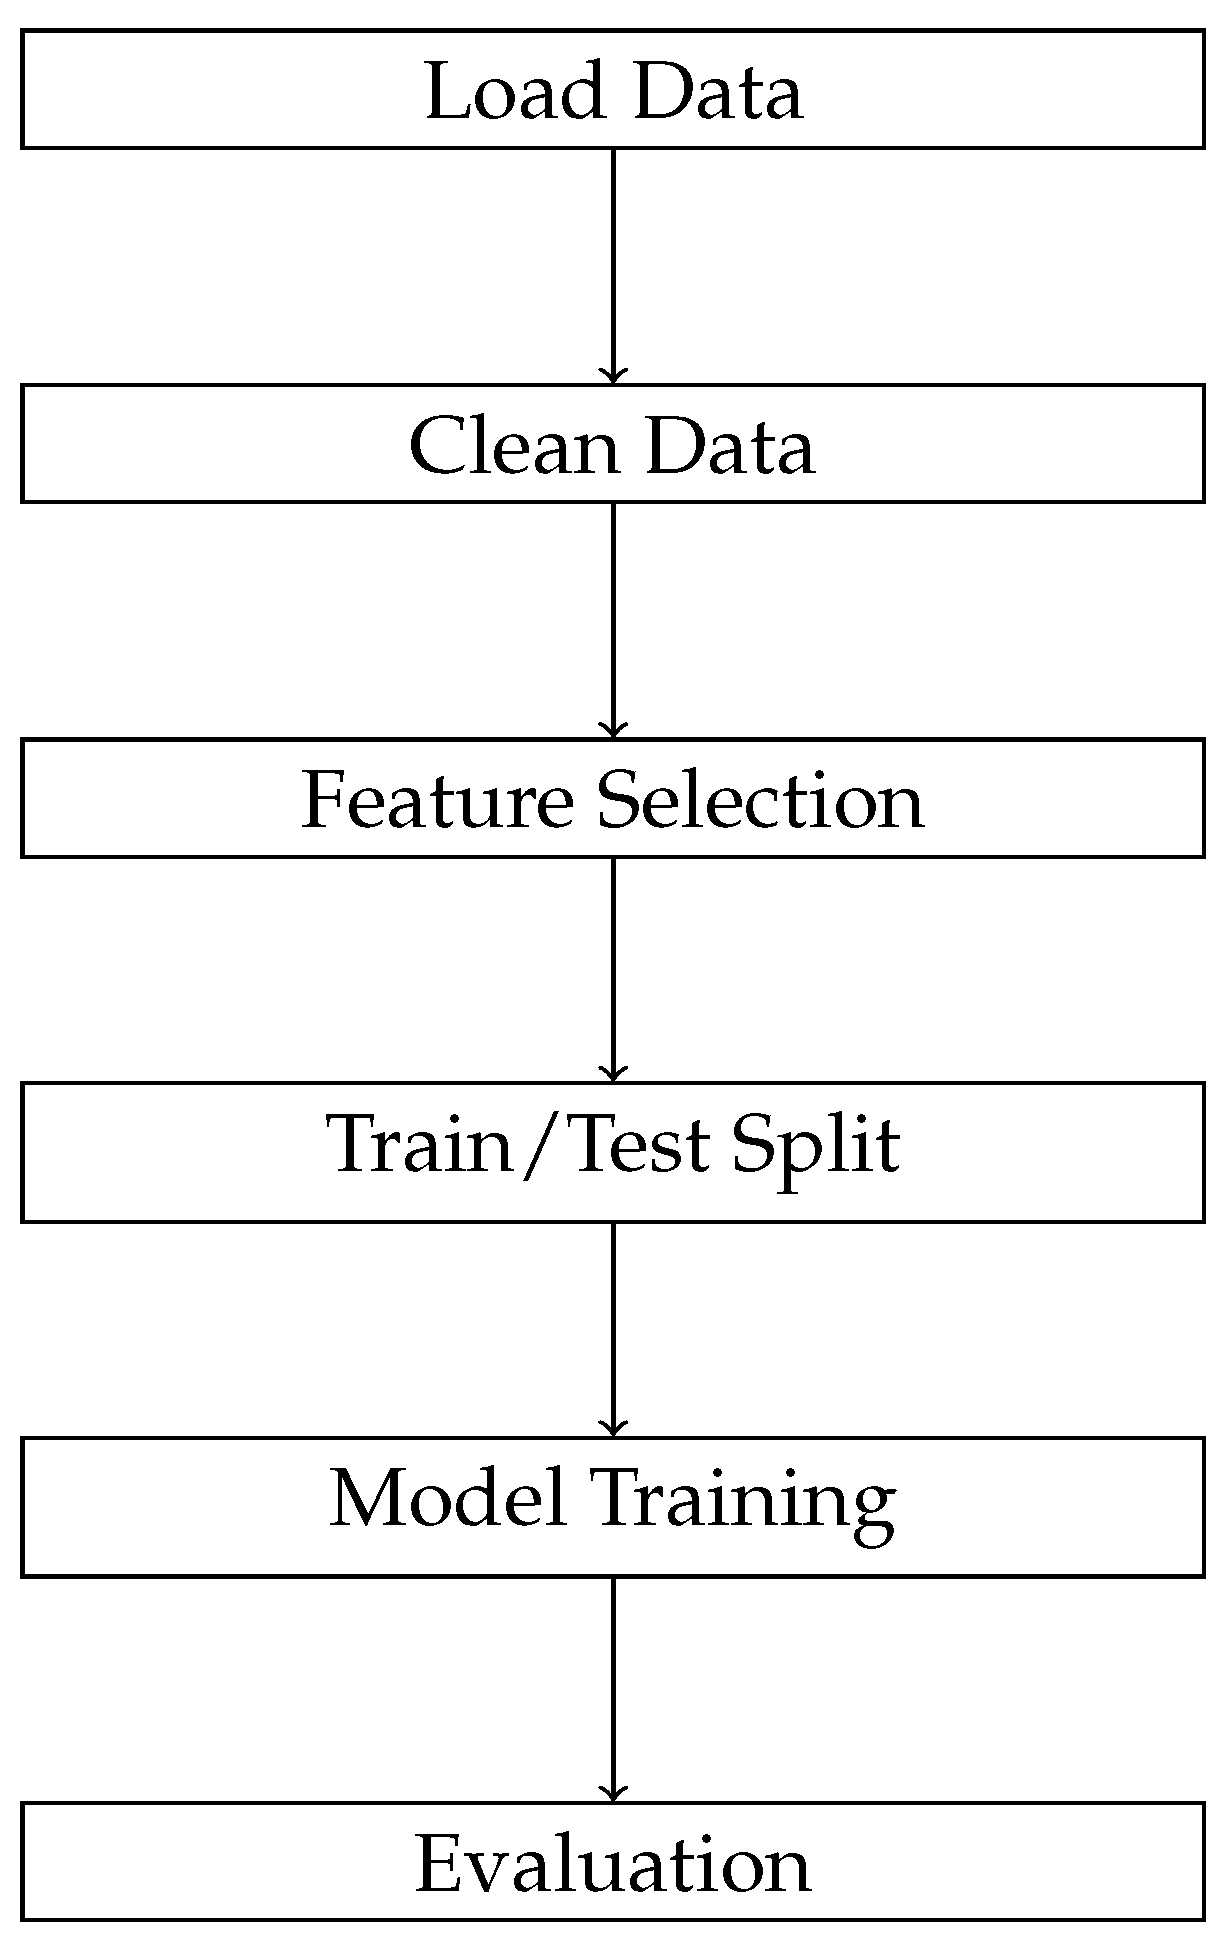
In the data collection phase, extensive and relevant financial data is meticulously gathered from reliable and authoritative sources to ensure accuracy and representativeness. The data preprocessing stage involves cleaning, normalization, and transformation operations to prepare the raw data for machine learning algorithms. This step improves data quality and ensures consistency. During model training and development, appropriate learning algorithms are selected, configured, and trained to capture underlying patterns in the data. This phase also includes feature selection and hyperparameter tuning to optimize predictive performance Finally, model evaluation involves rigorous testing and validation using predefined performance metrics to assess the models’ accuracy, generalization ability, and robustness. Each phase is designed to contribute to the creation of scalable, reliable, and effective intelligent systems that support informed financial decision-making [
7] (see
Figure 1).
3.2. Data Description
This study evaluates the effectiveness and generalizability of intelligent prediction models using historical stock data from three distinct datasets. First, from 8 February 2013, stock market data for American Airlines Group Inc. (AAL) and Apple Inc. (AAPL) [
8] was gathered from Kaggle [
9]. Important trade characteristics like opening price, daily high and low, closing price, and trading volume are included in these statistics. Furthermore, a more comprehensive dataset comprising past stock prices for every company on the S&P 500 index was included [
10]. This dataset, which includes information from hundreds of significant publicly traded companies, covers the five years prior to February 2018 and offers a more thorough market view. No technical indicators, such as moving averages or momentum metrics, were created; simply unprocessed historical data was used in every instance. The study preserves the integrity of the data and evaluates the pure predictive power of machine learning algorithms on stock price movements by utilizing only fundamental trading information.
3.3. Models Evaluated
Random Forest, XGBoost, Decision Tree (scikit-learn) in [
11,
12].
KNN Regressor (scikit-learn) in [
13].
LSTM Network (Keras/TensorFlow) in [
14].
3.4. Data Preprocessing and Training
Two separate subsets of the dataset were created: 20% of the dataset was set aside for testing, while the remaining 80% was used to train the models. The prediction models were fitted to the training set, which enabled them to discover underlying linkages and patterns in the historical stock data. The testing set was used to impartially assess the models’ generalization ability on fresh, untested data; it was not visible during the training process. Instead of just learning past trends, this division guarantees the models capacity to forecast future market behavior.
3.5. Modeling
Random Forest, K-Nearest Neighbors (KNN), XGBoost, Decision Tree, and Long Short-Term Memory (LSTM) networks were the five prediction models used in this investigation. To provide a uniform and equitable foundation for comparison, the same training set was used to train each model. To improve each model’s predictive performance, hyperparameters were [manually adjusted/optimized via grid search]. Choosing the ideal number of trees, tree depth, number of neighbors, learning rate, and other model-specific parameters was part of the tuning process for the conventional machine learning models (Random Forest, KNN, XGBoost, and Decision Tree). To improve temporal pattern recognition and reduce overfitting, key parameters for the LSTM model were meticulously modified, including the number of neurons, hidden layers, batch size, and learning rate. The study intends to impartially assess each model’s capacity to forecast stock market movements, concentrating on both short-term volatility and longer-term trends, by preserving the same training data and methodically adjusting hyperparameters. This work purposefully applies LSTM to univariate closing price data, even though it is commonly used for multivariate time series. Assessing the model’s ability to directly learn temporal dynamics from raw price sequences is the aim. It is anticipated that the LSTM will detect latent patterns like momentum or reversal behaviors over time using a sliding window of 60 days. Using the same constrained feature set, this also acts as a baseline against conventional models.
3.6. Tools and Libraries
This study’s experiments were all carried out with Python programming language (Python 3.10).utilizing a number of robust libraries designed for machine learning and data research. The Scikit-learn library was used to implement algorithms like Random Forest and Support Vector Regression (SVR) for both traditional and ensemble machine learning models. It was also used to carry out preprocessing tasks like feature scaling, data normalization, and model evaluation through cross-validation methods. For gradient-boosted decision trees, the XGBoost library was used because of its scalability to big datasets, regularization capabilities, and speed. The Keras Application Programming Interface (API) with a TensorFlow backend was utilized for deep learning models, especially those that involve sequential data, such LSTM (Long Short-Term Memory). This framework provided for effective training; the LSTM model’s hyperparameters were manually chosen for this investigation based on previous tests.There was no usage of automated search methods like random or grid search.
4. Results
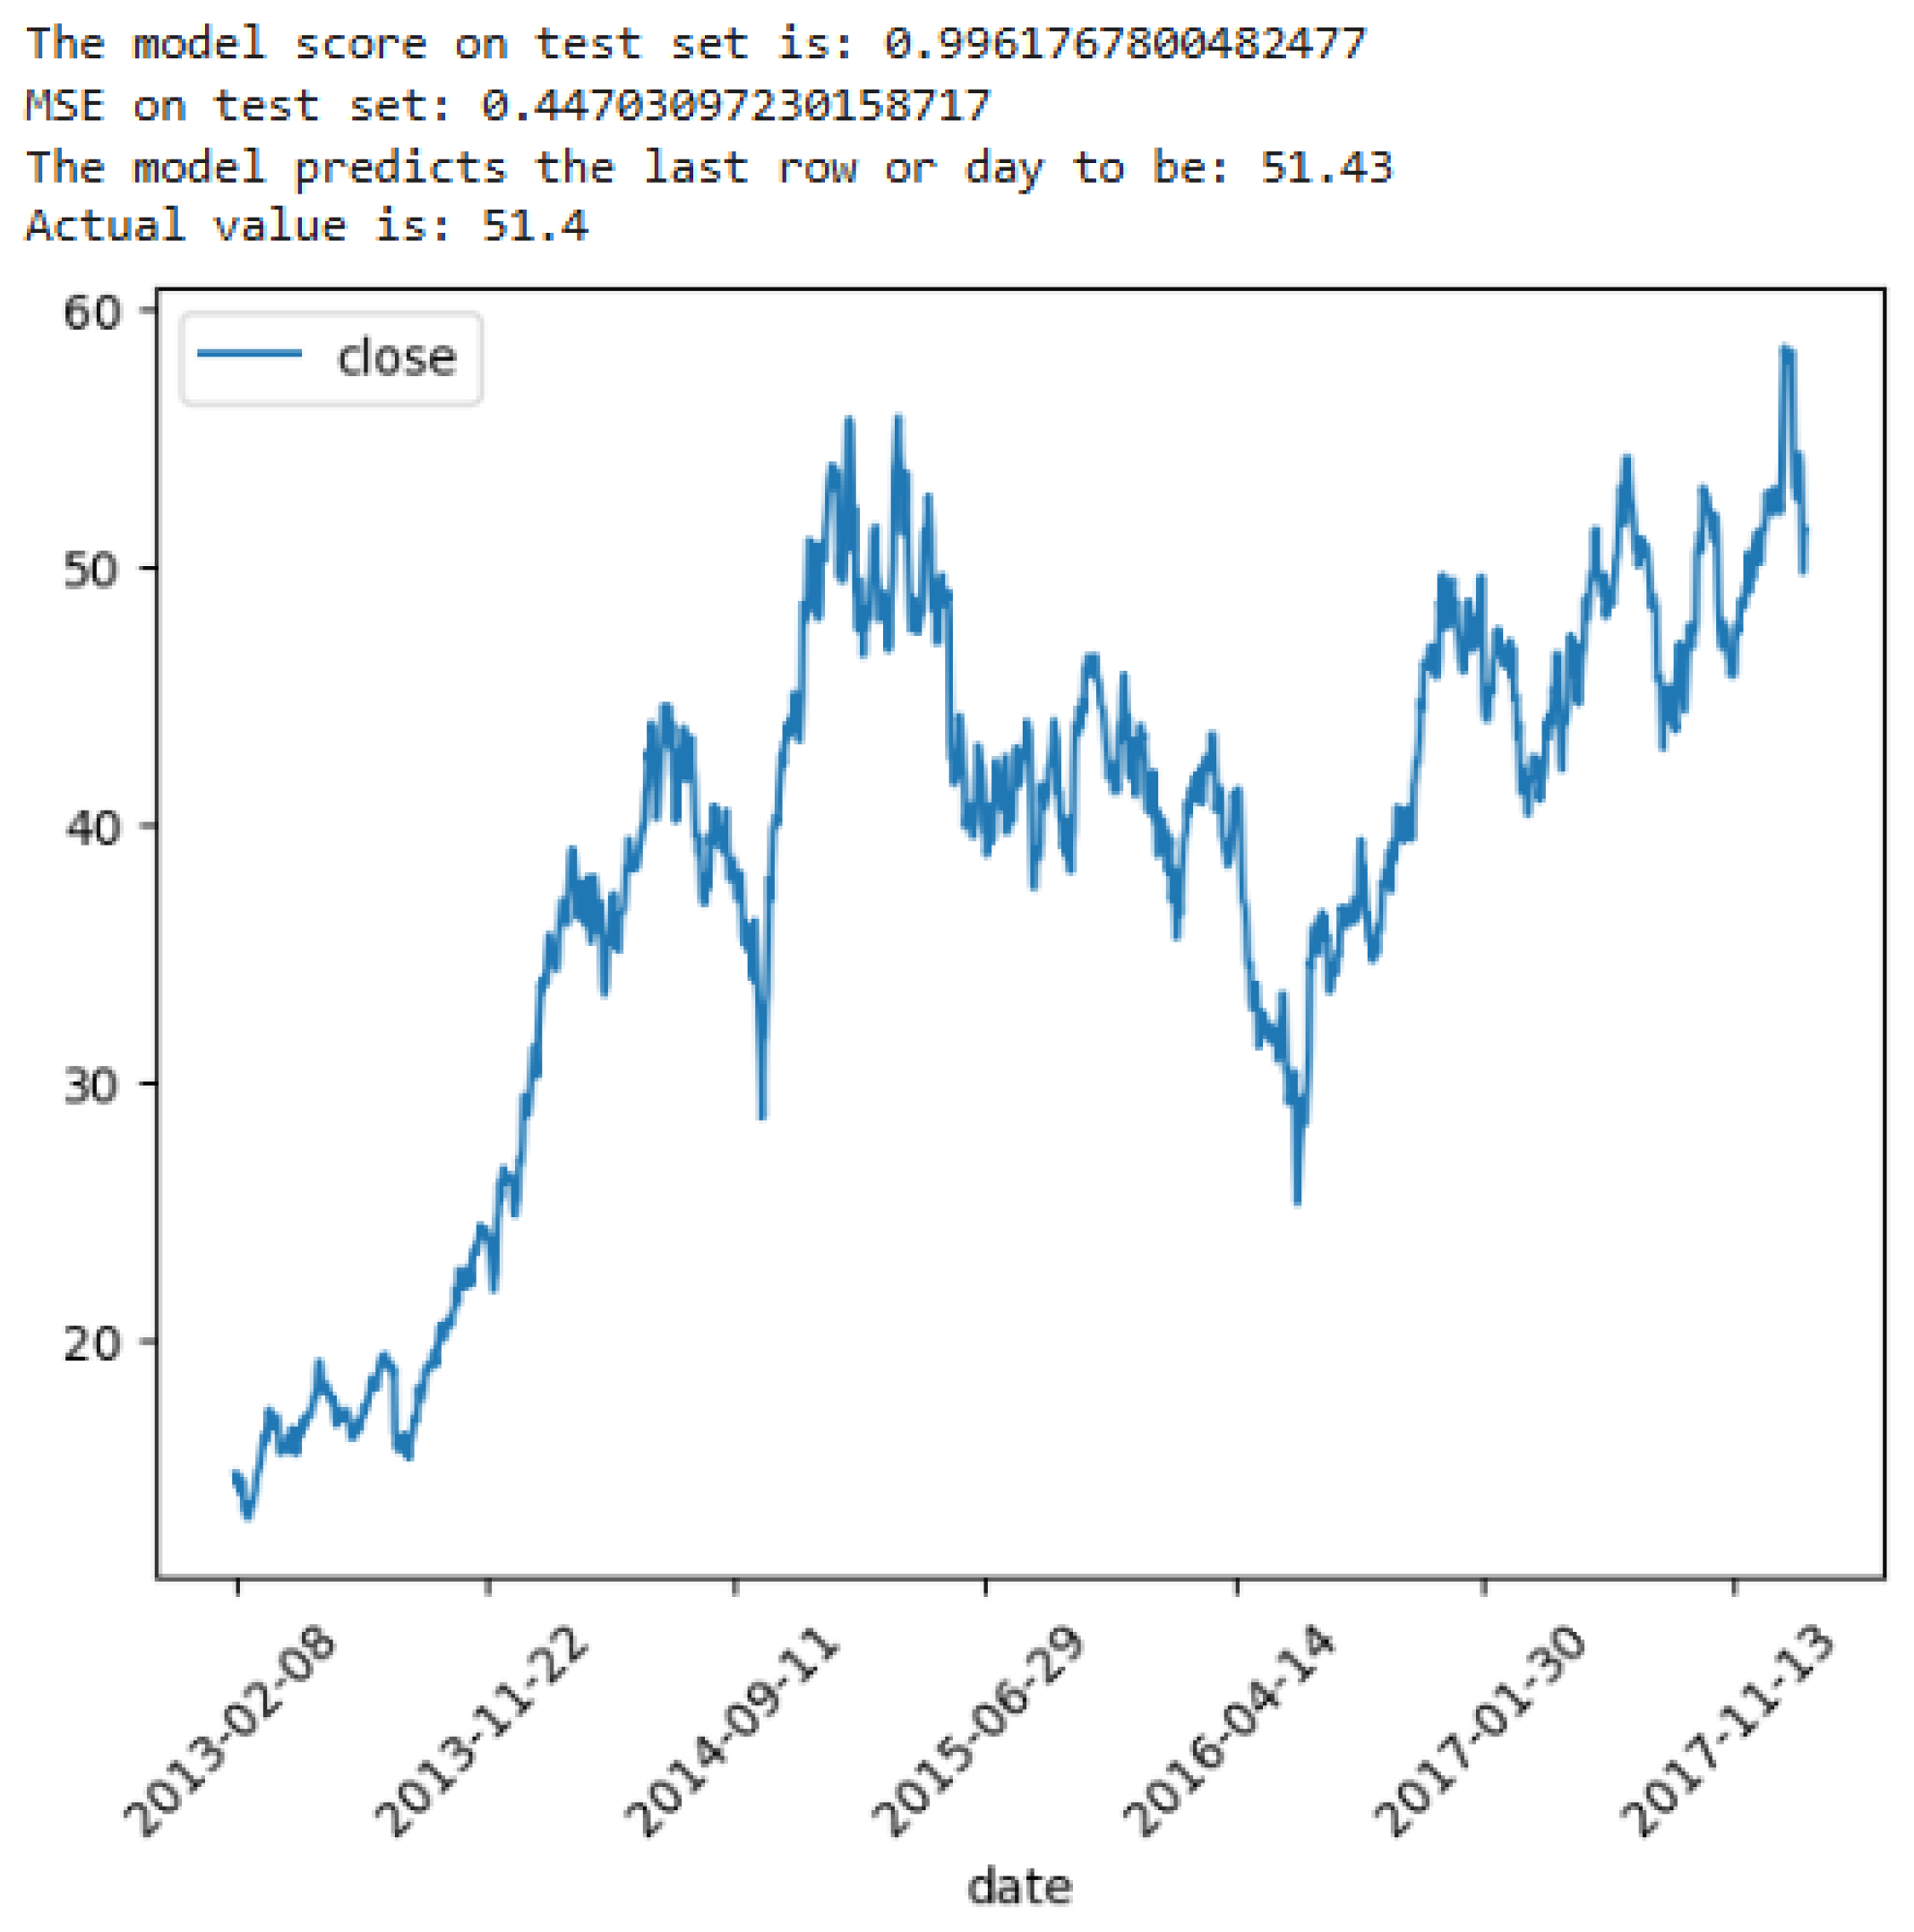
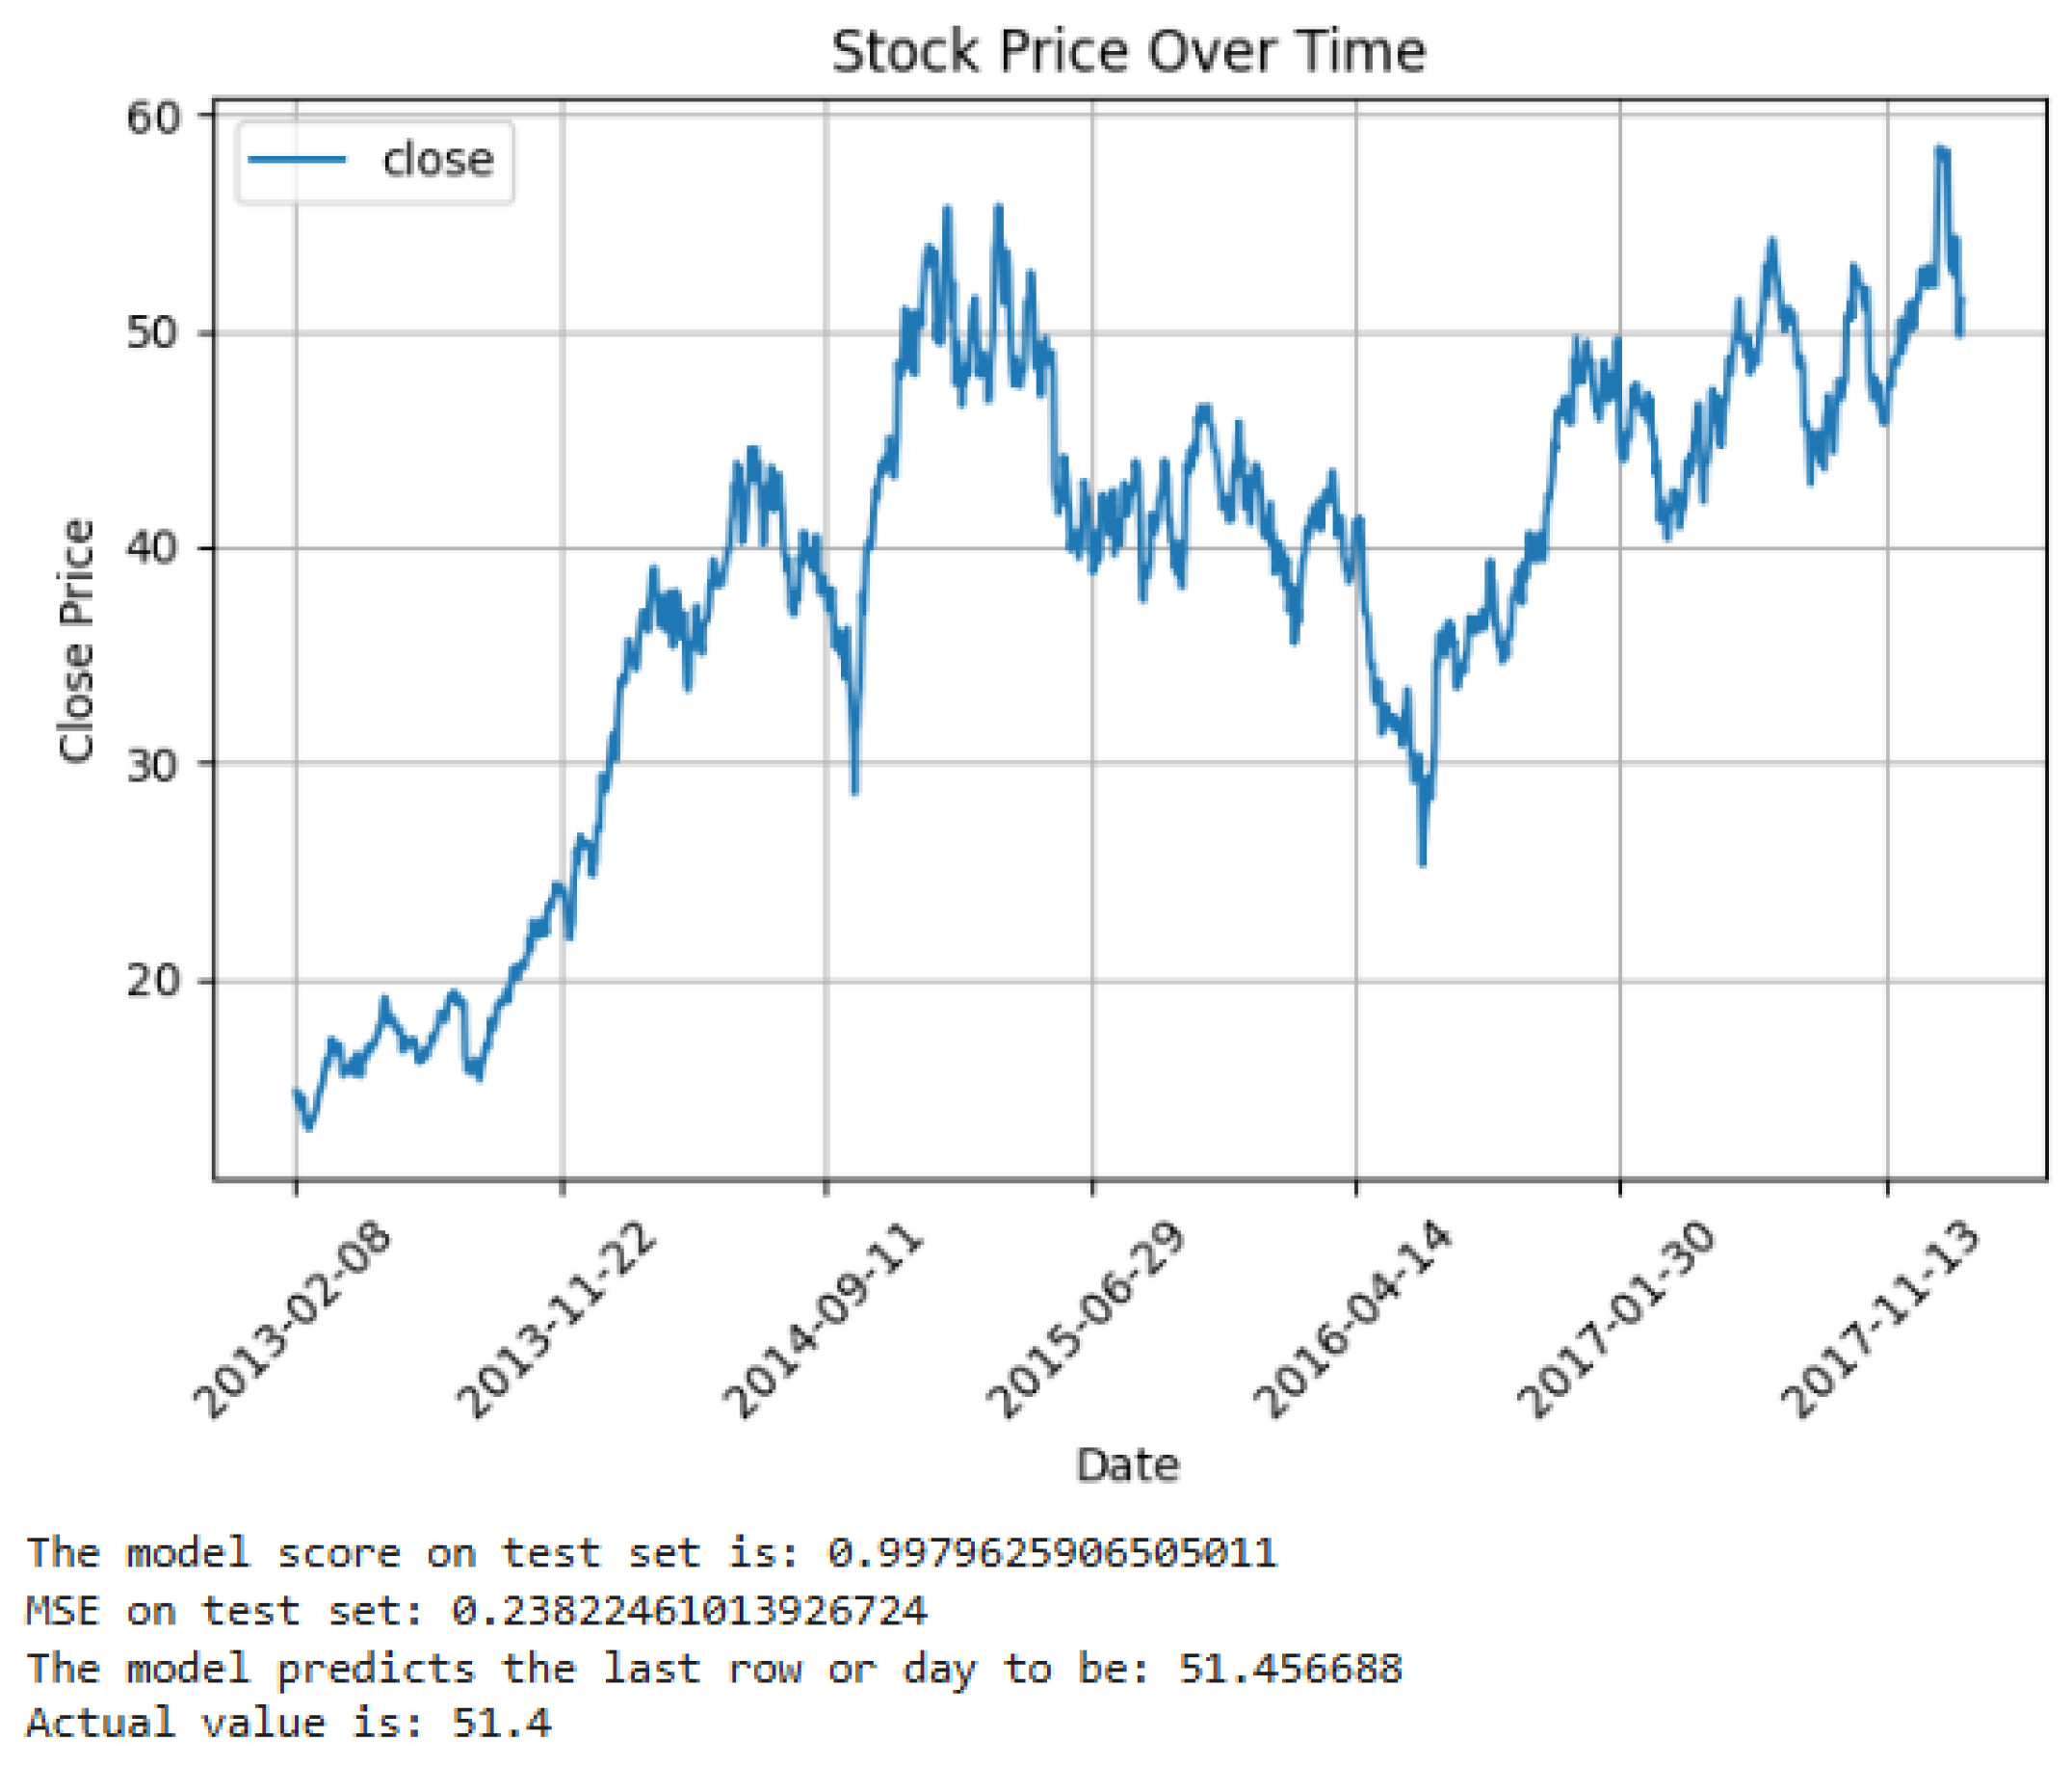
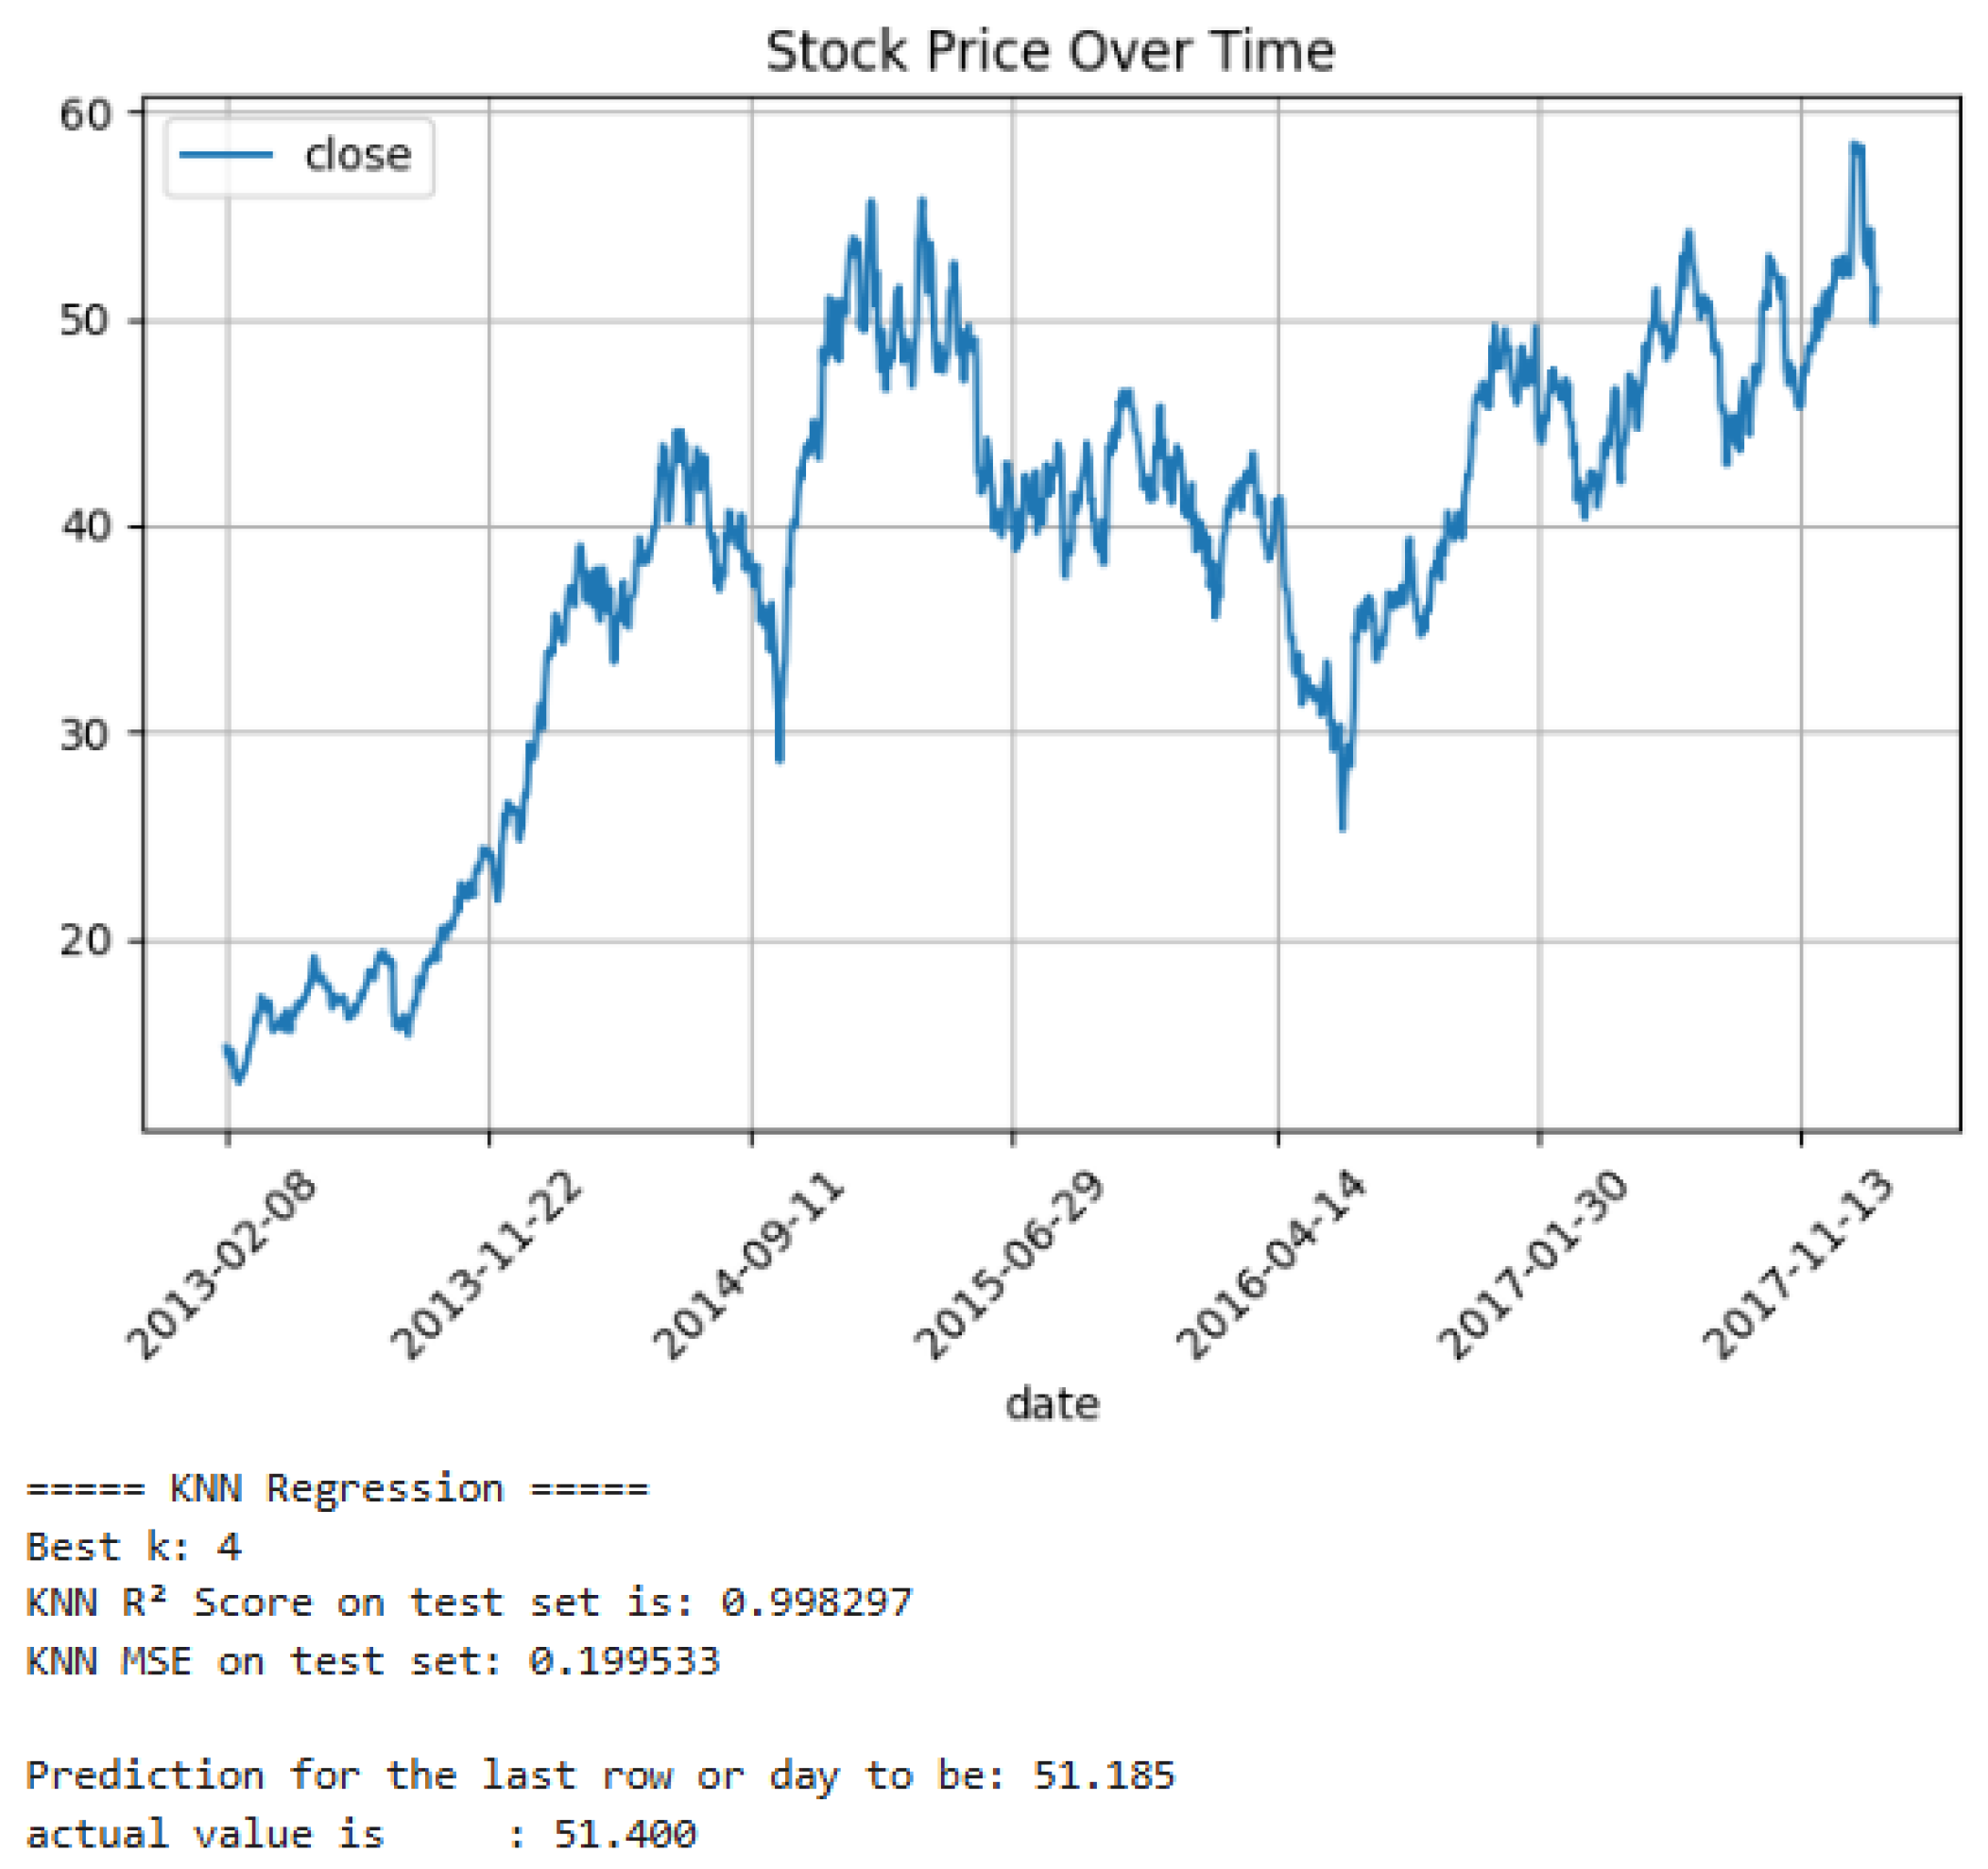
This section presents the examination of various machine learning and deep learning frameworks, used for stock price prediction. Each model was evaluated using the R2 score (accuracy), Mean Squared Error (MSE), and the performance of the last day’s prediction compared to the actual closing price.
Evaluation Metrics
We employ the following measures to evaluate the regression models’ performance. Each of these metrics offers a unique viewpoint on how effectively a model predicts events that cannot be seen and how well it reflects the underlying relationships in the data.
The mean of actual values represents the central tendency or average of all true target values in the dataset:
where
n indicates the complete count of observations and
denotes the value that has been actually measured, for instance,
i. When evaluating other metrics, such as the
score, this value is essential because it acts as a baseline reference. It can assist in determining whether the forecasts substantially depart from expected results and represents the typical market behavior.
- 2.
Mean Squared Error (MSE)
The Mean Squared Error calculates the average of the squared differences between the predicted and actual values.
where the number of predictions is
n, the corresponding actual value is
, and the anticipated value is
. Because of the squaring process, MSE is sensitive to outliers and penalizes greater errors more than smaller ones. The projected values are generally closer to the actual values when the MSE is lower. When all predictions are assessed using the same scale, it is extremely helpful for quantitatively evaluating the prediction accuracy of models.
- 3.
Coefficient of Determination ( Score)
The
score measures how much of the variation in the dependent variable can be anticipated based on the independent variables.
In this case, the denominator is the overall variance in the data, and the numerator is the residual sum of squares, or the unexplained variance. The value is a number between 0 and 1, where: signifies that the model does not exceed the accuracy of simply estimating the average of the target values; implies that the model is equivalent to a basic average prediction; and negative values indicate that the model’s performance is inferior to that of a simple average prediction.
A high in regression problems indicates that the model captures the link between input features and the target variable and effectively explains the variability in the data.
The following
Table 1 summarizes the key prediction results obtained from different models:
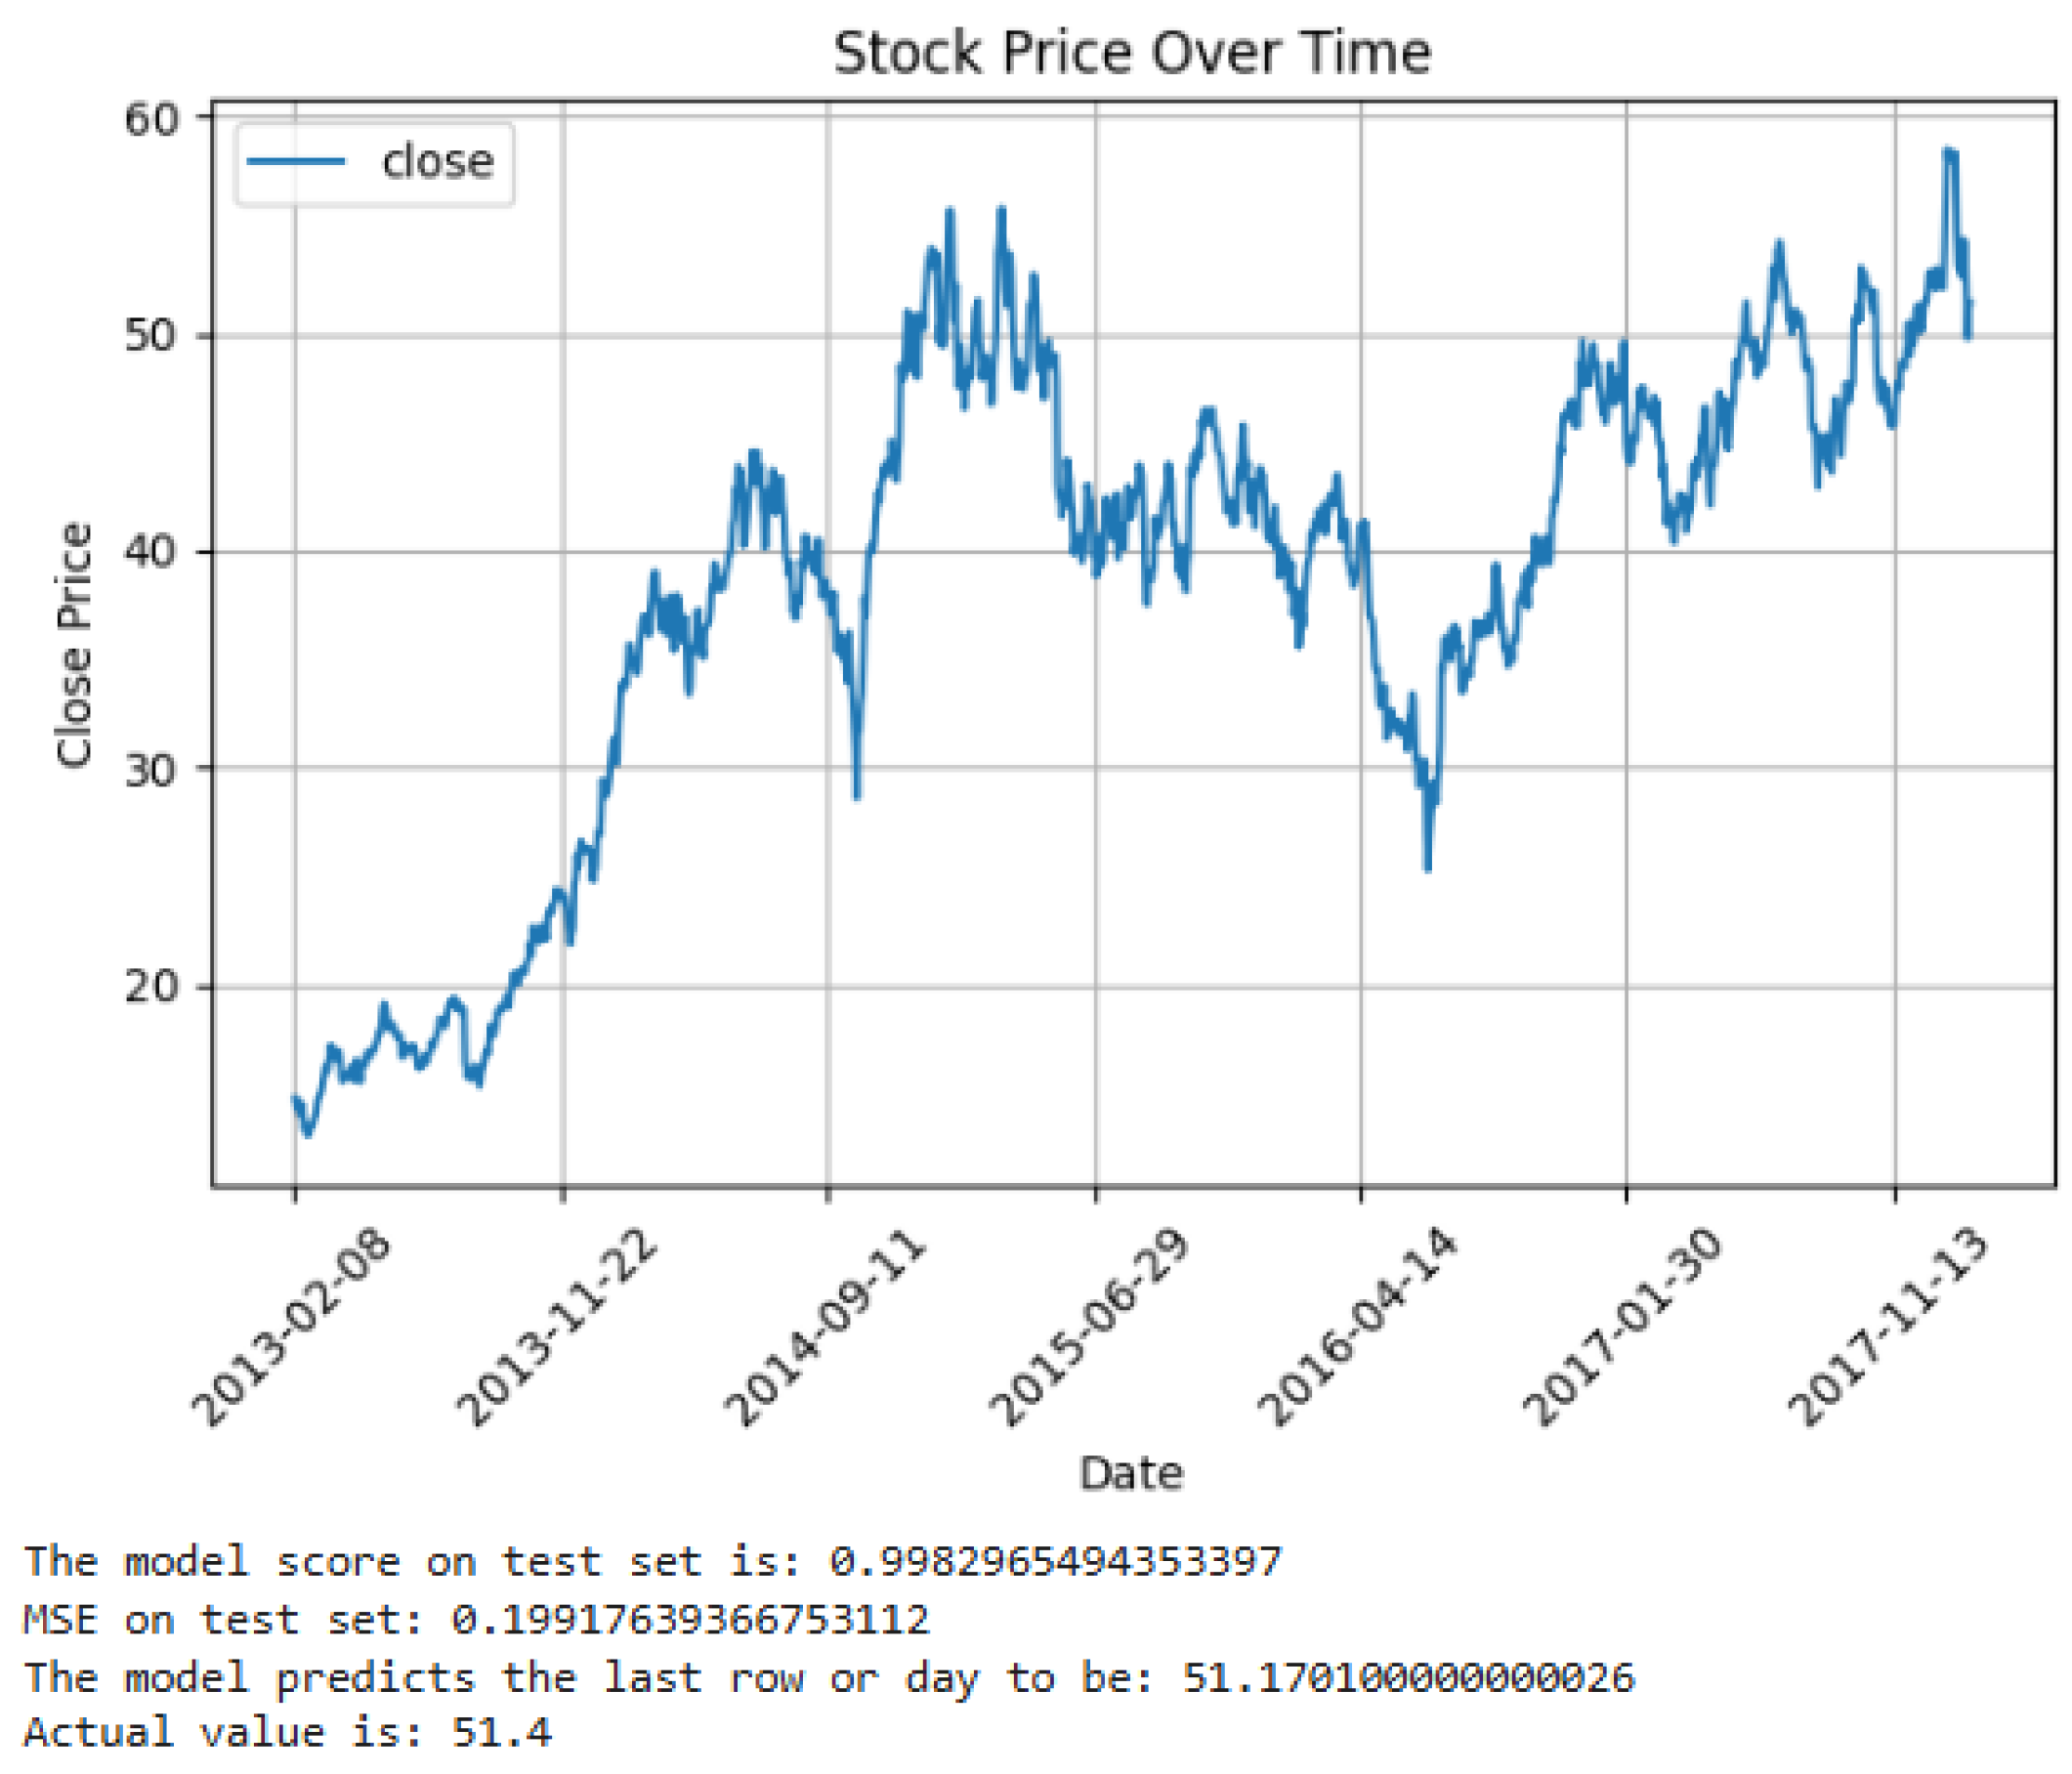
The results of the proposed approach are presented in the following graphs.
Figure 2,
Figure 3,
Figure 4 and
Figure 5 illustrate the performance of the model under different conditions and demonstrate its effectiveness compared to baseline methods. Key metrics such as accuracy, error rate, and processing time are shown to highlight the improvements achieved.
6. Conclusions
The use of intelligent algorithms to forecast stock market movements based on previous trade data was investigated in this study. Random Forest, XGBoost, K-Nearest Neighbors (KNN), Decision Tree, and Long Short-Term Memory (LSTM) networks are five supervised learning algorithms that are compared in this study to give a thorough assessment of their advantages and disadvantages in financial forecasting applications.
With R2 values close to 0.998 and the lowest Mean Squared Errors (MSE), the results show that tree-based ensemble models—in particular, XGBoost and Random Forest—performed better. When trained on unprocessed historical data, these models showed excellent predictive potential and were quite successful even without the inclusion of engineered technical indicators. Under ideal parameter choices, KNN’s performance closely matched that of the ensemble models, demonstrating encouraging results as well.
LSTM networks effectively captured the temporal relationships present in financial time series, while having a larger MSE and a lower R2 score than tree-based models. To realize their full potential, their performance indicates that more fine-tuning, bigger datasets, or incorporation into hybrid frameworks are required.
Future research could improve model generalization by expanding the assessment to include more assets and different market circumstances. Furthermore, investigating ensemble approaches that integrate deep learning with conventional models or adding outside elements like sentiment analysis or macroeconomic indicators may result in forecasting systems that are more resilient and flexible.
Ultimately, the results lend credence to the application of clever, data-driven models in creating tools that assist analysts and investors in making more strategic and informed trading decisions in erratic financial markets.
Author Contributions
Conceptualization, A.B.; methodology, A.B.; software, A.B.; validation, A.B., S.B. and E.K.H.; formal analysis, A.B.; investigation, A.B.; resources, A.B., S.B. and E.K.H.; data curation, A.B.; writing—original draft preparation, A.B.; writing—review and editing, A.B.; visualization, S.B. and E.K.H.; supervision, S.B. and E.K.H.; project administration, E.K.H.; funding acquisition, S.B. and E.K.H. All authors have read and agreed to the published version of the manuscript.
Funding
This research received no external funding.
Institutional Review Board Statement
Not applicable.
Informed Consent Statement
Not applicable.
Data Availability Statement
The data that support the findings of this study are available from publicly accessible sources.
Conflicts of Interest
The authors declare no conflicts of interest.
References
- Belattar, S.; Abdoun, O.; Haimoudi, E.K. Performance analysis of the application of convolutional neural networks architectures in the agricultural diagnosis. Indones. J. Electr. Eng. Comput. Sci. 2022, 27, 156–162. [Google Scholar] [CrossRef]
- Mostafavi, S.M.; Hooman, A.R. Key technical indicators for stock market prediction. Mach. Learn. Appl. 2025, 20, 100631. [Google Scholar] [CrossRef]
- Belattar, S.; Abdoun, O.; Haimoudi, E.K. Comparing machine learning and deep learning classifiers for enhancing agricultural productivity. Case study: Larache Province, Northern Morocco. Int. J. Electr. Comput. Eng. 2023, 13, 1689–1697. [Google Scholar] [CrossRef]
- Saud, A.S.; Shakya, S. Technical indicator empowered intelligent strategies to predict stock trading signals. J. Open Innov. Technol. Mark. Complex. 2024, 10, 100398. [Google Scholar] [CrossRef]
- Zhang, X.; Pinsky, E. S&P-500 vs. Nasdaq-100 price movement prediction with LSTM for different daily periods. Mach. Learn. Appl. 2025, 19, 100617. [Google Scholar] [CrossRef]
- Najem, R.; Bahnasse, A.; Talea, M. Toward an Enhanced Stock Market Forecasting with Machine Learning and Deep Learning Models. Procedia Comput. Sci. 2024, 241, 97–103. [Google Scholar] [CrossRef]
- Belattar, S.; Abdoun, O.; Haimoudi, E.K. New learning approach for unsupervised neural networks model with application to agriculture field. Int. J. Adv. Comput. Sci. Appl. 2020, 11, 360–369. [Google Scholar] [CrossRef]
- Ayah, F. Stock Market Analysis & Prediction Using LSTM. 2023. Available online: https://www.kaggle.com/code/faressayah/stock-market-analysis-prediction-using-lstm/input (accessed on 19 June 2025).
- Fahmi, A. AAL Stock Prediction. 2023. Available online: https://www.kaggle.com/code/aufafahmi/aal-stock-prediction (accessed on 18 June 2025).
- Paparaju, T. Apple (AAPL) Historical Stock Data. 2023. Available online: https://www.kaggle.com/datasets/tarunpaparaju/apple-aapl-historical-stock-data (accessed on 19 June 2025).
- Liu, H.; Chang, L.; Tian, Y.; Chen, H.; Zhang, P.; Song, B.; Zheng, S.; Liu, T. Research on time-domain motion prediction of floating platforms based on XGBoost model. Ocean Eng. 2025, 332, 121393. [Google Scholar] [CrossRef]
- Zhang, H.; Zhong, J. Efficient and Effective Counterfactual Explanations for Random Forests. Expert Syst. Appl. 2025, 293, 128661. [Google Scholar] [CrossRef]
- Armghan, A.; Htay, M.M.; Alsharari, M.; Aliqab, K.; Surve, J.; Patel, S.K. Performance enhancing solar energy absorber with structure optimization and absorption prediction with KNN regressor model. Alex. Eng. J. 2023, 82, 531–540. [Google Scholar] [CrossRef]
- Liu, C.; Ren, H.; Li, G.; Ren, H.; Liang, X.; Yang, C.; Gui, W. Singular Value Decomposition-based lightweight LSTM for time series forecasting. Future Gener. Comput. Syst. 2026, 174, 107910. [Google Scholar] [CrossRef]
| Disclaimer/Publisher’s Note: The statements, opinions and data contained in all publications are solely those of the individual author(s) and contributor(s) and not of MDPI and/or the editor(s). MDPI and/or the editor(s) disclaim responsibility for any injury to people or property resulting from any ideas, methods, instructions or products referred to in the content. |
© 2025 by the authors. Licensee MDPI, Basel, Switzerland. This article is an open access article distributed under the terms and conditions of the Creative Commons Attribution (CC BY) license (https://creativecommons.org/licenses/by/4.0/).
