Abstract
During trading sessions, the stock market experiences a multitude of fluctuations that are influenced by an extensive array of factors. This is especially pertinent to businesses that attract substantial international interest, such as streaming platforms that have shown a noteworthy increase in popularity in recent times. The objective of this research is to examine the fluctuations in the value of Netflix shares during the time period that correlates with the release of particular films that elicited significant reactions. The research utilizes natural language processing (NLP) and sentiment analysis approaches to preprocess the movie evaluations and calculate the sentiment score. The study yields thought-provoking findings concerning the correlation between movie release dates and the closing price.
1. Introduction
In the context of global business, investment plays a key role. However, when considering all parties involved, the pursuit of a favorable outcome is the objective that is sought after by all individuals. Hence, there exists the potential for the new, promising product to have a positive impact on certain businesses. As companies strive to create and provide products or services that align with client demands, it is imperative to consider customer happiness as a fundamental requirement. The implementation of risk mitigation strategies during the launch of a new product would contribute to a reduction in potential hazards, consequently lowering the likelihood of failure. The primary objective of this action is likely to be the attraction of additional investors. Nevertheless, inadequate comprehension of the circumstance can potentially yield unfavorable consequences. To mitigate risks in the dynamic and perpetual stock market, it would be advantageous to identify and monitor potential changes or past changes that may serve as indicators. Such observations would aid in limiting risks and would be a valuable solution.
In the past decade, a surge in technological advancements and platforms emerged, including streaming platforms. As a result, this sector experienced rapid growth, necessitating the application of data science and artificial intelligence to uncover additional insights and strategies for staying abreast of technological developments and their impact on industries. The surge in the user base of streaming platforms, particularly Netflix, during the year 2013, resulted in an expansion of its market presence. The expansion of Netflix was paralleled by the acknowledgment and commendation garnered by its original programming, which received nominations for and achieved victories at several award ceremonies. The selection of the case study for this paper was based on its growing popularity among individuals. In addition to analyzing sentiment in movie reviews, our research primarily centers on the exploration of stock values through data analysis. In this context, we employ natural language processing (NLP) as a method for filtering the movies used in the exploration phase.
Numerous artificial intelligence (AI) technologies, including sentiment analysis [1,2], have been widely employed. This has eliminated the necessity for companies, producers, and small craft owners to conduct street surveys in order to gain insights into potential future products or to gather feedback on previous offerings. Instead, sentiment analysis on reviews has become a prevalent approach [3]. In the contemporary era of widespread internet access and the proliferation of online platforms dedicated to user-generated evaluations, manufacturers now possess a means by which they can ascertain critical feedback pertaining to the efficacy and potential areas of enhancement for their products or services.
Sentiment analysis is employed in various domains, as evidenced by a case study [3] examining customer satisfaction in the restaurant industry through the analysis of reviews. Additionally, sentiment analysis has been utilized in the context of social and health situations, such as the COVID-19 pandemic, as demonstrated in a research paper [4] focused on capturing the prevailing mood of individuals during that specific period. Furthermore, the utilization of sentiment analysis has extended to the realm of stock market analysis. In a notable work [5], the authors employed LSTM and sentiment analysis to examine the correlation between news headlines and stock trends. Notably, the evaluation methodology included graphical visualization plots, deliberately avoiding absolute predictions. A previous work [6] examined the use of professional third-party reviews (TPRs) to identify factors that impact the financial value of a company. The dataset comprises films that were released in the United States between February 2005 and April 2006. According to authors, the reviews may influence investors positively despite their nature being negative, under particular conditions. Furthermore, the distinct value of relative valence of TPRs, which is the measure used by authors, aligns with the overarching observation that stock prices fluctuate in response to unexpected news that alters expectations.
This investigation employs natural language processing (NLP) techniques [1,7]—as a prominent subfield within the realm of data sciences with several examples of applications—and sentiment analysis [8,9], which aims to determine the subjectivity and polarity of a provided text, in our case, the movie reviews, using TextBlob version 0.16.0, a Python-based tool that enables the implementation of several natural language processing (NLP) methodologies [10,11]. The ensuing sections of this paper are structured as follows: Section 2 describes the datasets collected and outlines our approach, which is centered around natural language processing (NLP) and sentiment analysis. Section 3 presents the results of sentiment analysis and the investigation of stock values during the release periods of movies. The discussion subsection covers the examination and analysis of these results, and the research is finalized in the Conclusions section.
2. Material and Methods
The primary aim of our approach is to perform an examination of the relationship between the stock price of a company and the people’s reactions by observing the changes in stock prices during time periods when products are released (Figure 1), using Netflix as the company example and its movies as the products, therefore exploring the potential relationship between the response of the general public and the accompanying swings in stock prices.
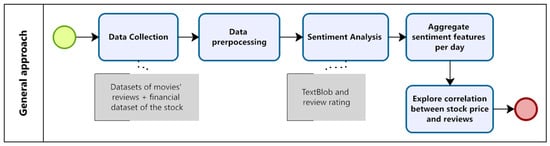
Figure 1.
Architecture of our approach.
2.1. Data Collection
This work employs two distinct experimental approaches. The first experiment utilizes two datasets consisting of movie reviews (the 1st dataset was obtained from Rotten Tomatoes [12] and the 2nd dataset was obtained from IMDb [13]), while the second experiment focuses on the stock price dataset of Netflix, which serves as the selected case study. The acquisition of the complete historical dataset of Netflix’s stock price from Yahoo Finance is necessary due to the variability in release dates for movies.
2.1.1. Movies and Critic Reviews Datasets
- Rotten Tomatoes dataset
This dataset consists of two files, with the first file including extensive details about the movie. The second file has data that pertains to the critics and their accompanying reviews. Both files possess a common characteristic that simplifies the process of combining them (Table 1). The Rotten Tomatoes dataset including film information underwent a refinement process involving the application of a filter based on the attribute of ‘production company’. More precisely, this filter was used to exclusively include films that were produced by Netflix. Following this, the dataset that was filtered was merged with the dataset containing reviews, with a specific focus on the reviews related to the filtered movies that were considered important for the aim of this research, which were the movies created by Netflix for this use case example. The process of combining resulted in a cumulative count of 14,805 reviews.

Table 1.
Features of dataset used in analysis.
- IMDb dataset
Due to the limited availability of recent reviews in the Rotten Tomatoes dataset, we chose to utilize the IMDb dataset [13], which offers a more up-to-date collection of reviews extending until the year 2021, whose size is 1185. The aforementioned reviews are to a film produced by the corporation Netflix. This study primarily focused on sentiment analysis and the aggregated data derived from this analysis. Specifically, we examined three key features, the date of the review, the rating given to the review on a ten-point scale, and the text of the review itself, which was subject to sentiment analysis.
2.1.2. Dataset Features
All three datasets included sets of different features; however, only a handful of those features were relevant to the case study and were used during the preprocessing and analysis. Table 1 summarizes these features by their original dataset.
Table 2 contains the features resulting from the sentiment analysis process. There were two features that the sentiment analysis in this work was based on, the review content and the review score from the Rotten Tomatoes dataset, which corresponded to the review body and the review rating from the IMDb dataset. These features mirrored each other as one contained the text of the review and the other contained the rating by the reviews.
Table 2.
Features created with preprocessing and sentiment analysis.
The review content and review body were processed and the polarity was calculated by using the cleaned text results in the polarity score, which was used to classify the review and create the class sentiment feature, while processing the review score and review rating results in the star score. The Class_sentiment and the star_score features were the attributes that the sentiment_score feature was created with. The process of how each of these important features were created is explained in later sections.
2.1.3. Data Preprocessing Using NLP Techniques
After acquiring a dataset of reviews specifically focused on movies made by Netflix, sourced from Rotten Tomatoes and IMDb, movie reviews were prepared using approaches from the area of NLP.
- Sentiment Analysis based on TextBlob
The content of the reviews in the Rotten Tomatoes dataset and the body of the reviews in the IMDb dataset underwent preprocessing and preparation, including text content purification, tokenization, and stop term filtering. These steps rendered the datasets appropriate for sentiment analysis. To facilitate the transmission of sentences to the sentiment function, the preprocessed sentences were reassembled afterwards. The text blob algorithm evaluates the sentiment of utterances producing a polarity score that was used in order to classify them into three main categories: negative, neutral, and positive. To categorize the reviews based on their score values, a threshold of zero was employed, and reviews with a polarity score of zero were classified as neutral. However, in order to address the issue of neutral values, a sentiment score was generated, which is further elaborated upon in the subsequent paragraph.
- Sentiment Analysis based on star score
The Rotten Tomatoes and IMDb datasets contain a variable known as the score review, which quantifies the degree of satisfaction conveyed in a movie review. However, it is crucial to acknowledge that the extent of this attribute demonstrates fluctuation within a spectrum encompassing four, five, and ten stars. Furthermore, a scale based on the alphabet is utilized. This particular feature functions as a viable alternative in cases where the polarity score indicates a neutral review. The primary objective of this approach is to reduce the occurrence of neutral class scores, as they offer little understanding of the user’s mood conveyed in the review. In order to standardize the rating score, we employed a normalization process. Specifically, if the value of the star score is less than 0.5, the corresponding review is categorized as negative. Conversely, if the value exceeds 0.5, the review is classed as positive. Reviews are considered neutral if the score star value is either 0.5 or if it is not provided. The methodology for calculating the sentiment score is illustrated in Figure 2.
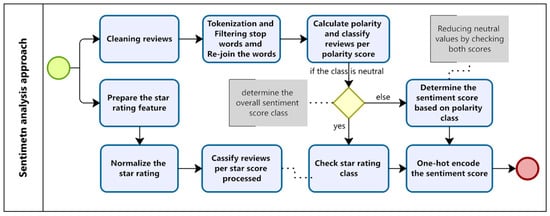
Figure 2.
The sentiment analysis process.
Based on the analysis of emotion using star ratings, it is evident that there was a decrease in the occurrence of neutral categories compared to past occurrences. The effect under discussion is illustrated in Table 3, which displays the discrepancy seen before and following the introduction of a filtering mechanism for neutral reviews. This analysis specifically focused on the distribution of star ratings assigned to these reviews. The employed filtering methodology successfully decreased the quantity of impartial reviews present in the datasets.
Table 3.
The sentiment score before and after filtering neutral reviews using the star score.
2.1.4. Selecting Various Periods to Study Closing Price Fluctuations
The main objective of the preceding phase was to ascertain the various categorizations and proportions of individuals’ responses to films made by Netflix. The ultimate phase of the research involved the selection of two distinct time periods spanning from 2019 to 2020. The purpose was to investigate the fluctuation in the closing price during these time intervals while plotting the sentiment class counts and the number of reviewer responses. The objective was to ascertain any observable rising or downward patterns in the closing price’s value. This investigation could elucidate a potential association between the closing prices of Netflix stocks in the stock market and the public’s reactions to movies produced by Netflix. Table 4 presents a summary of the class count for the specified periods.
Table 4.
The count of reviews during four different time periods.
3. Results and Discussion
The provided figures (Figure 3 and Figure 4) illustrate the number of reviews per class within the timeframe spanning from ‘06-06-2019’ to ‘06-12-2019’. The frequency of reactions appears to be concentrated in the latter months of the year, commencing from the tenth month. The price plot, depicted in Figure 3, shows an increase in the number of reactions and sequential green peaks observed. Notably, the third green-marked area indicates a gradual increase in the values of the close price plot. This increase occurs after a time lag subsequent to the rise in the number of reactions, which is observed from around October 2019 to December 2019.
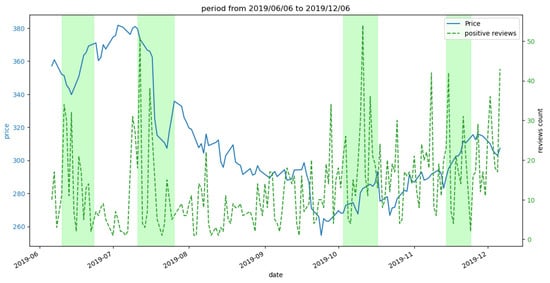
Figure 3.
The count of positive reviews during the period of ‘06-06-2019’ to ‘06-12-2019’ versus the close price.
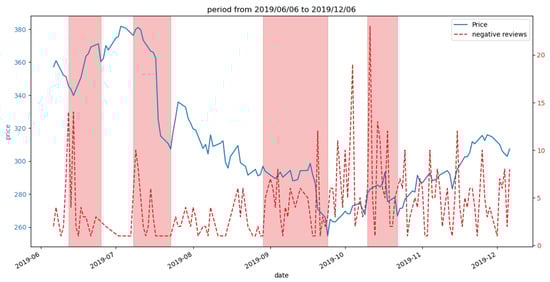
Figure 4.
The count of negative reviews during the period of ‘06-06-2019’ to ‘06-12-2019’ versus the close price.
The negative review figure (Figure 4) shows four distinct regions that have been highlighted in red. During the observation of these periods, it was seen that the price plot often exhibited a decline in value following a sequence of peaks represented by negative review plots, with a time delay. Following a brief interval, the value experienced a subsequent increase, a phenomenon that can be attributed to the influence of favorable reviews.
The figures (Figure 5, Figure 6 and Figure 7) illustrate the count of reviews per class throughout a six-month period from ‘06-01-2020’ to ‘06-06-2020’ in relation to the plotted values of the closing price. A significant visual observation can be made from the total review plot (Figure 5), wherein the final light-orange designated region indicates a decrease in reaction count. Additionally, the pricing plot exhibits a decline in value around the time period of ‘06-2020’.
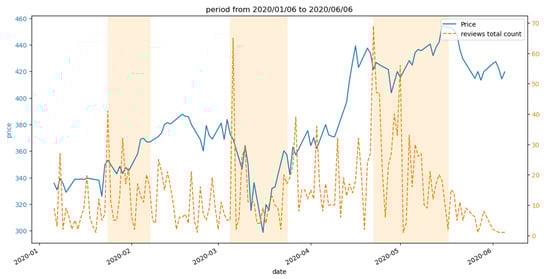
Figure 5.
The count of reviews during the period of ‘06-01-2020’ to ‘06-06-2020’ versus the close price plot.
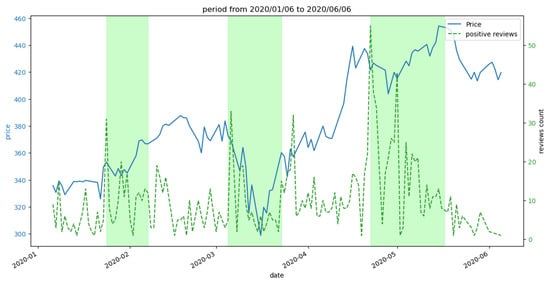
Figure 6.
The count of positive reviews during the period of ‘06-01-2020’ to ‘06-06-2020’ versus the close price plot.
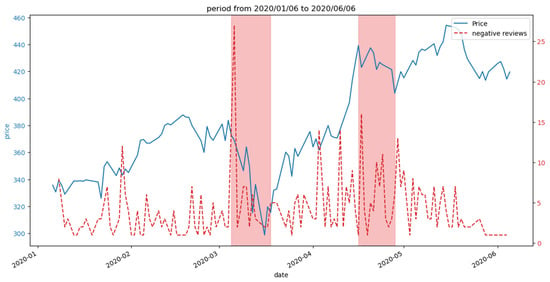
Figure 7.
The count of negative reviews during the period of ’06-01-2020’ to ‘06-06-2020’ versus the close price.
In the present study, we aimed to investigate a visual correlation between social media and price. Figure 7 illustrates a decline in the price plot subsequent to a prominent peak in the negative review plot during the period encompassing ‘03-2020’ and ‘04-2020’, as indicated by the red background. However, following the later part of the ‘04-2020’ month, the price exhibited a subsequent increase.
During the same time period in which the negative review plot reached its peak, the plots for positive reviews (Figure 6) and the total count of reviews also exhibited a significant peak, surpassing the count of negative reviews in the second green marked area. This observation suggests a potential correlation between the subsequent increase in price value and the aforementioned trends, as depicted in the figures. Similar observations may be made in the vicinity of the temporal interval ‘02-2020’, wherein the count of positive reviews and the reaction plots exhibit comparably lower peaks, succeeded by an increase in price magnitude in proximity to the first green demarcated region.
Building on the visual patterns observed in the plots previously (Figure 3, Figure 4, Figure 5, Figure 6 and Figure 7), we calculated the correlation coefficients after merging financial data and the extracted sentiment features. Interesting correlation values between the close price and the features were produced, where Rotten Tomatoes features exhibited correlations ranging between 0.26 and 0.44, while IMDb-derived features produced a broader range from −0.17 to 0.47.
Discussion
One notable observation is that there is a positive association between the number of reactions and the strength of the relationship, as evidenced by the manifestation of a correlation. When examining the data presented in Table 4, it becomes apparent that there is a positive correlation between the count of reactions and the peaks observed in the price plot. This correlation is particularly evident during periods of high reaction counts. These findings suggest a potential relationship between the reviews and the price plot, specifically during the time periods when peaks in the review count align with subsequent peaks in the price plot.
The price value exhibited an upward trend following the peaks of the favorable reviews as depicted in the plots. Specifically, the green indicated areas in Figure 3 and Figure 6 indicate this observation. The plots of the negative reviews exhibited peaks, which were then followed by a decline in values. This trend is particularly evident in Figure 4 and Figure 7, where the areas outlined in red indicate a notable decrease. However, in contrast to the positive count, the negative count is comparatively smaller. It is worth noting that the red peaks were consistently followed by a decline in values. Consequently, further investigation is required to fully interpret these findings. This could involve incorporating additional data from different sources, like news datasets, as well as exploring whether the negative impact carries more significance than the positive impact.
These observations suggest a potential relationship between the quality and number of reviews and the movement of the displayed price plot. This observation was also evident in the reaction figure (Figure 5), wherein a decrease in review count values corresponded to a decrease in price values. This raises the question of whether the lack of interest, whether positive or negative, among individuals can influence changes in values. However, to substantiate this claim, a more comprehensive and extensive study would be required.
While [3] focuses on sentiment analysis of reviews for a specific restaurant to evaluate customer satisfaction in a narrowly defined context, and [4] analyzes reviews from a broader platform to assess public mood during a particular health crisis and its relation to the stock market, our work takes a different direction, exploring the connection between sentiment expressed in reviews of a company’s products (in this case, movies) and the stock price of the production company, Netflix. In contrast to [5] which uses headlines and stock trends by applying LSTM for the prediction model—an approach that reflects a more direct link to the stock market—our study investigates whether the sentiment extracted from reviews of the product can reveal a subtler, potentially more complex relationship with financial performance. The authors of [6], meanwhile, analyze professional third-party reviews to identify factors that impact the financial value of a company, using a dataset of films released between February 2005 and April 2006. However, in our study, we use reviews from publicly accessed famous platforms such as Rotten Tomatoes and IMDb, covering a more recent and extended period from 2014 to 2020 while focusing on one production company.
In summary, our study offers a broader and more current dataset than comparable work involving movies, but more specified when compared to studies based on general social media platforms. Moreover, it goes beyond measuring customer satisfaction, aiming instead to investigate whether product reviews can have a meaningful impact on stock price movements, an approach that is both more targeted and innovative.
4. Conclusions
The focus of the research study was the utilization of sentiment analysis on datasets of movie reviews. The analysis was performed via the Text Blob tool and was further enhanced by including the star rating. The aim of this study was to calculate a sentiment score that would enable the visual analysis of the relationship between movie reviews and pricing trends over five-year discrete time periods from 2017 to 2021. The objective was to investigate the potential correlation between the public’s reception of new products, particularly movies, and the visual fluctuations in a company’s stock price.
The present research elucidated an association between the temporal movement of price plots and the evaluations of a product over five discrete time intervals. This implies that the introduction of a highly anticipated product, along with a significant volume of evaluations and responses on credible platforms, has the potential to influence the volatility of the stock price of the associated company. To optimize the robustness of this study, it is advisable to incorporate a variety of datasets obtained from reputable platforms. This will contribute to the augmentation of the quantity of assessments and data available, hence resulting in more resilient outcomes. Furthermore, the implementation of this research across multiple companies operating in different industries can aid in identifying the probable relationship between the timing of a particular product’s release, the response from the target audience, and the fluctuation of the company’s stock price. Essentially, it can furnish empirical proof to substantiate the proposition that substantial replies and evaluations on social media platforms have the potential to impact the volatility of stock values.
Author Contributions
Conceptualization, M.T. and S.D.; methodology, M.T. and S.D.; validation, S.D. and A.M.; data curation, M.T.; writing—original draft preparation, M.T.; writing—review and editing, S.D.; supervision, S.D. and A.M. All authors have read and agreed to the published version of the manuscript.
Funding
This research received no external funding.
Institutional Review Board Statement
Not applicable.
Informed Consent Statement
Not applicable.
Data Availability Statement
Data used for the study is accessed through links: Rotten Tomatoes movies and critic reviews dataset (www.kaggle.com/datasets/stefanoleone992/rotten-tomatoes-movies-and-critic-reviews-dataset) (accessed on 26 February 2023) and Squid Game IMDB User Reviews (https://www.kaggle.com/datasets/deepcontractor/squid-game-imdb-user-reviews) (accessed on 15 September 2023).
Conflicts of Interest
The authors declare no conflicts of interest.
References
- Poola, I. How Artificial Intelligence in Impacting Real Life Every day. Int. J. Adv. Res. Dev. 2017, 2, 96–100. [Google Scholar]
- Siau, K.; Wang, W. Building Trust in Artificial Intelligence, Machine Learning, and Robotics. Cut. Bus. Technol. J. 2018, 31, 47–53. [Google Scholar]
- Adi Laksono, R.; Sungkono, K.; Sarno, R.; Wahyuni, C. Sentiment Analysis of Restaurant Customer Reviews on TripAdvisor using Naïve Bayes. In Proceedings of the 2019 12th International Conference on Information & Communication Technology and System (ICTS), Surabaya, Indonesia, 18 July 2019; pp. 49–54. [Google Scholar] [CrossRef]
- Duan, Y.; Liu, L.; Wang, Z. COVID-19 Sentiment and the Chinese Stock Market: Evidence from the Official News Media and Sina Weibo. Res. Int. Bus. Financ. 2021, 58, 101432. [Google Scholar] [CrossRef] [PubMed]
- Sarkar, A.; Sahoo, A.K.; Sah, S.; Pradhan, C. LSTMSA: A Novel Approach for Stock Market Prediction Using LSTM and Sentiment Analysis. In Proceedings of the 2020 International Conference on Computer Science, Engineering and Applications (ICCSEA), Gunupur, India, 13–14 March 2020; pp. 1–6. [Google Scholar] [CrossRef]
- Chen, Y.; Liu, Y.; Zhang, J. When do Third-Party Product Reviews Affect Firm Value and what can Firms Do? The Case of Media Critics and Professional Movie Reviews. J. Mark. 2012, 76, 116–134. [Google Scholar] [CrossRef]
- Leão, C.P.; Gonçalves, P.; Cepeda, T.; Botelho, L.; Silva, C. Study of the Knowledge and Impact of Artificial Intelligence on an Academic Community. In Proceedings of the 2018 International Conference on Intelligent Systems (IS), Funchal, Portugal, 25–27 September 2018; pp. 891–895. [Google Scholar] [CrossRef]
- Pozzi, F.A.; Fersini, E.; Messina, E.; Liu, B. Chapter 1—Challenges of Sentiment Analysis in Social Networks: An Overview. In Sentiment Analysis in Social Networks; Pozzi, F.A., Fersini, E., Messina, E., Liu, B., Eds.; Morgan Kaufmann: Boston, MA, USA, 2017; pp. 1–11. ISBN 978-0-12-804412-4. [Google Scholar]
- Bonta, V.; Kumaresh, N.; Naulegari, J. A Comprehensive Study on Lexicon Based Approaches for Sentiment Analysis. Asian J. Comput. Sci. Technol. 2019, 8, 1–6. [Google Scholar] [CrossRef]
- Tutorial: Quickstart—TextBlob 0.16.0 Documentation. Available online: https://textblob.readthedocs.io/en/dev/quickstart.html (accessed on 4 February 2023).
- Gräbner, D.; Zanker, M.; Fliedl, G.; Fuchs, M. Classification of Customer Reviews based on Sentiment Analysis. In Information and Communication Technologies in Tourism 2012, Proceedings of the International Conference, Helsingborg, Sweden, 24–27 January 2012; Fuchs, M., Ricci, F., Cantoni, L., Eds.; Springer: Vienna, Austria, 2012; pp. 460–470. [Google Scholar] [CrossRef]
- Rotten Tomatoes Movies and Critic Reviews Dataset|Kaggle. Available online: https://www.kaggle.com/datasets/stefanoleone992/rotten-tomatoes-movies-and-critic-reviews-dataset (accessed on 26 February 2023).
- Squid Game IMDB User Reviews. Available online: https://www.kaggle.com/datasets/deepcontractor/squid-game-imdb-user-reviews (accessed on 15 September 2023).


Disclaimer/Publisher’s Note: The statements, opinions and data contained in all publications are solely those of the individual author(s) and contributor(s) and not of MDPI and/or the editor(s). MDPI and/or the editor(s) disclaim responsibility for any injury to people or property resulting from any ideas, methods, instructions or products referred to in the content. |
© 2025 by the authors. Licensee MDPI, Basel, Switzerland. This article is an open access article distributed under the terms and conditions of the Creative Commons Attribution (CC BY) license (https://creativecommons.org/licenses/by/4.0/).