Abstract
Ensuring excellent Quality of Service (QoS) while limiting financial expenses is seriously challenged by the growing scope and complexity of the Internet of Things (IoT). Though established under ETSI, the OneM2M standard provides a consistent middleware foundation but does not include a thorough QoS management technique. This work presents a dynamic optimization method based on the MAPE-K model to solve traffic- and resource-oriented QoS aspects. We balance QoS with operational costs by providing cost modeling—including cloud resource pricing and workload offloading. Supported by mathematical modeling and real-world workload situations, the results show the possibilities of cost-aware QoS techniques for scalable and efficient IoT systems based on the OneM2M standard.
1. Introduction
Rising as a transforming technology, the Internet of Things (IoT) enables billions of objects to share data in real time and converse. Recent estimates show that from 15.41 billion in 2015 to a projected 75.14 billion by 2025 [1], the number of IoT-connected devices globally has continuously increased generating 79.4 zettabytes of data yearly [2]. Particularly as IoT ecosystems rise in size and complexity, this explosive expansion in IoT installations has presented major difficulties in controlling Quality of Service (QoS).
Comprising both traffic-oriented parameters like Round Trip Time (RTT) and Success Rate as well as resource-oriented metrics like CPU use and RAM use, QoS is a fundamental component of IoT performance [3]. Good handling of these benchmarks guarantees dependable, responsive, scalable IoT solutions. Optimizing QoS is not without trade-offs, though, especially when local server resource allocation, data transport fees, and cloud VM use all factor under consideration. Particularly in hybrid architectures whereby workloads are constantly dispersed across local and cloud computing platforms [4], the difficulty resides in attaining good QoS while preserving cost effectiveness.
Globally standardized IoT middleware OneM2M offers a strong architecture for scalability and interoperability amongst many IoT devices and systems [5]. OneM2M reduces many of the technological obstacles in IoT by allowing flawless data transmission and connectivity. Its application in dynamic surroundings, however, presents fresh difficulties especially in terms of traffic-oriented QoS, resource use, and financial cost balance. Current IoT resource management solutions generally ignore the financial aspect of workload distribution schemes and maximize either traffic or resource metrics in isolation, therefore neglecting their whole impact.
This work presents a dynamic QoS management framework based on OneM2M and driven by a Monitor–Analyze–Plan–Execute over Knowledge (MAPE-K) loop to handle these difficulties. By carefully allocating workloads between local and cloud infrastructures, the system dynamically optimizes both traffic-oriented QoS metrics (RTT, Success Rate) and resource-oriented QoS metrics (CPU use, RAM use). The inclusion of a thorough cost modeling system, which assesses the financial consequences of task distribution, is the main novelty of this study. The methodology guarantees that QoS improvement is both technically successful and financially feasible by modeling parameters like cloud pricing, data transport fees, and local resource costs.
Evidence proving the technological and financial relevance of optimizing IoT operations supports this study. For example, IoT-driven cloud computing currently plays a major role in many businesses; the worldwide Internet of Things (IoT) market was worth USD 405.69 billion in 2023 and is anticipated to reach around USD 3252.17 billion by 2033 [6]. These patterns highlight the necessity of systems that in real-world situations strike a compromise between cost economy and QoS performance.
This research shows how the proposed framework minimizes financial expenses by efficiently balancing traffic and resource QoS performance using simulations and real-world use cases. Using OneM2M middleware, the results show its possibilities to provide scalable and cost-effective IoT systems, so offering useful information for both industry professionals and researchers.
The rest of this paper is organized as follows: Section 2 provides a review of related work, emphasizing gaps in QoS and cost optimization. Section 3 details the methodology and implementation, including the mathematical cost model. Section 4 discusses results and trade-offs, and Section 5 concludes with directions for future research.
2. Background and Related Works
QoS and the related expenses are essential issues in the architectural design of IoT systems, with modern studies delving into the edge and cloud computing approaches at the expense-performance ratio. Compared with cloud computing, edge computing eliminates much communication delay by processing data closer to the source, increasing responsiveness in IoT applications that are delay-sensitive [7]. For example, one survey revealed that edge servers placed close to end-target devices can provide better QoS—like lower response times—compared with far-located remote cloud data centers, even though the latter have more raw computational power [8]. Moreover, edge computing reduces data processed over wide-area networks by providing on-site data processing, thus lowering bandwidth usage and potentially the operational cost [9]. However, edge computing-based implementations have some limitations: edge nodes have limited computational capacity and higher infrastructure and maintenance expenses in comparison with their centralized cloud counterparts [9]. On the other hand, cloud computing provides almost unlimited on-demand capacity and increased scalability with pay-as-you-go pricing, but it struggles with higher latency and bandwidth overhead when servicing distributed IoT devices [10]. With the consequence that one model fails to be optimal in all contexts, the other being more optimal. In order to take the strengths of the two approaches into advantage, the so-called hybrid models, i.e., fog computing, have emerged, which also have added advantages of low latency and bandwidth-effective services over the scalability of cloud computing [11].
In consideration of such trade-offs, different QoS and cost-oriented strategies have been proposed to efficiently split workloads between edge computing and cloud infrastructures. Researchers have come up with frameworks for offloading and resource allocation algorithms that aim to minimize both service delay and monetary spending, concurrently meeting the QoS demands of applications. For instance, Entrialgo et al. proposed Edarop, an orchestration mechanism that strategically deploys IoT application components on either edge or cloud virtual machines with the aim of reducing deployment costs within strict latency constraints [12]. Similarly, Dong and Wang depicted a federated edge–cloud architecture that improves QoS for AI-IoT devices through data processing at the edge, with the cloud being used only for additional intensive calculations [13]. Their results show a significant improvement in end-to-end latency and efficiency compared to traditional cloud-centric approaches. These findings support the argument that computation distribution between edge and cloud can yield substantial benefits, guaranteeing high QoS while, at the same time, reducing operational expenses [7,9]. In contrast with existing approaches such as Edarop [12] or the federated edge-cloud model [13], which optimize latency or cost in isolation, our approach integrates a joint multi-objective optimization function. It balances traffic metrics (RTT, success rate), resource usage (CPU, RAM), and financial parameters (VM cost, data transfer), offering a comprehensive and dynamic QoS-cost management strategy within OneM2M—currently missing in the literature.
3. Methodology
3.1. Managing Workload with MAPE-K Architecture
The exponential expansion of Internet of Things (IoT) systems brought enormous challenges in managing workloads dynamically with optimal Quality of Service (QoS). Interoperability and scalability-focused platforms, such as OneM2M, tend to degrade in performance under heavy workloads, which manifests in the form of delayed responses and lost requests [14]. In order to negate these challenges, this study uses the Monitor–Analyze–Plan–Execute over Knowledge (MAPE-K) architecture [15], an architecture that defines a formalized approach to real-time workload management and resource optimization.
The system under consideration (Figure 1) starts with Azure IoT Central [16], which collects real-time data from various sensors, for example, those of the Armadillo-IoT GW A6 series. The sensors produce a wide variety of environmental data, covering such parameters as sound noise levels, equivalent total volatile organic compounds (eTVOC), discomfort index, heat stroke index, temperature, relative humidity, ambient light, and barometric pressure. Data aggregation phase is crucial to gather the fundamental information needed to examine Quality of Service (QoS) parameters, i.e., Round Trip Time (RTT), Success Rate, and CPU/RAM utilization. Following data aggregation, Azure Event Hubs acts as a centralized data distribution hub. It efficiently forwards the aggregated real-time data streams to relevant consumers or end points. It is an important phase in facilitating scalability and controlling traffic flow that has a significant impact on traffic-centric QoS metrics like RTT and rejected requests. By maintaining proper control over data distribution, Event Hubs averts bottleneck opportunities that have the potential of diminishing the performance of the system under real-time scenarios.
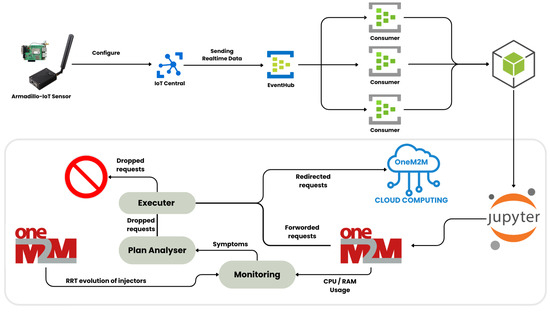
Figure 1.
MAPE-K architecture optimizing QoS parameters.
3.2. System Design
To examine the proposed solution in an e-health context (Figure 2), we simulate a smart hospital environment where sensors collect critical data (temperature, noise, humidity, etc.) from patient rooms and operating zones. This high-load setup mimics emergency response conditions with 1000 HTTP requests/second. In this setup:
➠ 10 data injectors are established, each of which is sending 100 requests per second, totaling the workload to 1000 requests per second.
Table 1 lists the QoS requirements defined by OneM2M for different domains based on their relative SLA priority of success rate and RTT.

Table 1.
QoS Requirements for Different Domains [17].

Figure 2.
Workflow for evaluating the OneM2M server in a simulated e-health hospital scenario under high-load conditions.
Figure 2.
Workflow for evaluating the OneM2M server in a simulated e-health hospital scenario under high-load conditions.

These threshold values define an overload state, diminishing the performance of the system to serve additional requests successfully. In order to remedy this issue, the MAPE-K loop (Monitor–Analyze–Plan–Execute over Knowledge) is integrated for dynamic adjustment of server parameters and workload distribution.
As the system approaches its limits of performance, the MAPE-K cycle initiates a corrective action: redirecting 25% of the traffic to the cloud. This is achieved by executing the workload on an Azure-provided cloud instance that benefits from the computing power and scalability associated with the DC2s v2 virtual machine family (See Figure 3). The most important steps in this process are:
- Monitoring: Real-time RTT, CPU, and RAM utilization monitoring to detect indications of overload.
- Analysis: Detection of performance constraints and prediction of resource exhaustion.
- Planning: Suggesting a plan to migrate 25% of the load to cloud resources.
- Execution: Redirecting the traffic to a cloud instance, ensuring that the system recovers and still offers QoS.

Figure 3.
Azure DC2s v2 instance price and specs for cost comparison.
Figure 3.
Azure DC2s v2 instance price and specs for cost comparison.

An integrated Billing System on Azure manages and oversees the related expenditure. This system monitors the cost of resources consumption on Azure, such as virtual machine usage and data transfer, thereby providing fiscal control and accountability.
3.3. Performance Evaluation and Cost Implications
The performance of the system after the implementation of the MAPE-K loop was evaluated based on the following metrics:
- ►
- CPU Utilization: The decrease in CPU load on the OneM2M server following traffic diversion to the cloud.
- ►
- RTT (Round Trip Time): Enhancements in response latency so that RTT is kept under critical levels.
- ►
- Financial Implications of Cloud Resources: The financial implications involved in reassigning 25% of the workload to the Azure DC2s v2 instance.
The pricing for the cloud instance was determined according to the pricing structure of Azure DC2s v2, which is priced at $0.1920 per hour (See Figure 4). The outcome of this particular scenario is illustrated on the CPU utilization graph coupled with the cost analysis.
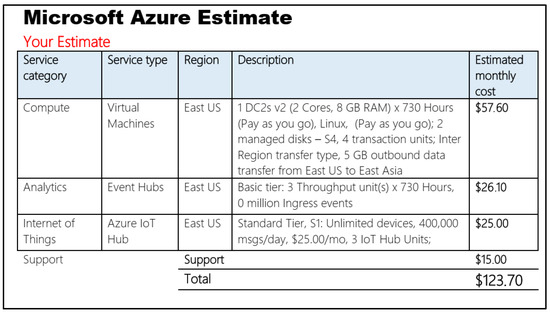
Figure 4.
Microsoft Azure estimated monthly costs for the proposed IoT workflow.
The incorporation of the MAPE-K loop with cloud computing entails extra expenditure, primarily as a result of utilizing Azure resources. This section presents a detailed analysis of the expenditures for the suggested solution.
3.4. Mathematical Modeling
This section gives a more refined mathematical model that includes Success Rate in the Quality of Service (QoS) metrics and gives a deeper analysis of the cost considerations, thereby making the modeling approach more complete and effective. The model dynamically balances Quality of Service (QoS) versus cost to maximize system performance for varying workloads.
These model parameters are categorized under the headings QoS Metrics (See Table 2), Cost Metrics (See Table 3), and Decision Variables (See Table 4) and provided in the following tables for clarity.
Table 2.
QoS Metrics with Descriptions and Units.
Table 3.
Cost Metrics with Descriptions and Units.
Table 4.
Decision Variables with Descriptions and Range/Values.
To balance QoS parameters and cost, we define two primary objective functions:
- QoS Optimization Objective:
- ✓
- ✓
- ✓
- ✓
The weights allow prioritization of specific QoS metrics, depending on application requirements.
- Cost Optimization Objective:
- Combined Optimization:
To jointly optimize QoS and cost, we define a multi-objective function:
where
- and are weighting factors that determine the trade-off between QoS and cost.
- Higher prioritizes QoS, while higher prioritizes cost reduction.
4. Results and Discussion
4.1. QoS Parameters
OneM2M was experimented with in the e-health traffic, a field that has strict Quality of Service (QoS) demands as medical data is very critical. Applications in e-health demand a Round Trip Time (RTT) of less than 4 s, a Success Rate of above 90%, and CPU/RAM usage to be under 80%. All these thresholds are vital to enable life-critical data to be delivered on time and prevent system overload.
Round Trip Time (RTT) (See Figure 5a): Prior to the deployment of the MAPE-K framework, RTT levels started rising beyond the critical point of 4 s at about the 200th iteration, with peaks rising to a level of 9.5 s at the end of the experiment. This high level of delay indicates strong congestion in the system, such that the processing of incoming requests at a high level became inefficient. It is this type of behavior which can worsen the performance of IoT platforms, more so in applications that are latency-sensitive.
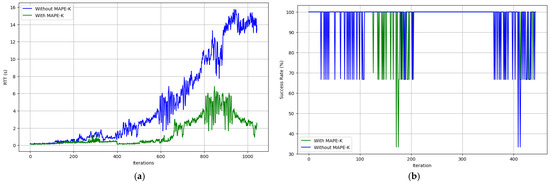
Figure 5.
Performance comparison with and without MAPE-K framework: (a) RTT evolution showing reduced latency with MAPE-K; (b) Success Rate over time demonstrating improved stability with MAPE-K optimization.
With the MAPE-K framework applied thereafter, RTT values were greatly improved, staying below 4 s for most tests. There were one or two minor spikes, but they were not problematic, and RTT values fell quickly and stayed low following the 200th test. This shows the framework is efficient at controlling traffic jams and making efficient use of resources to ensure the system sustains high performance levels necessary in IoT contexts.
Success Rate (See Figure 5b): Prior to the introduction of the MAPE-K framework, the success rate was highly volatile, often dipping below 70% and reaching disastrous lows of approximately 35% at some iterations. The high rate of failure points towards the system failing to manage growing workloads, resulting in high rates of lost requests. These thresholds are directly aligned with the requirements for real-time e-health monitoring systems, where delays and failures in transmitting vital patient data can have critical consequences.
After the incorporation of MAPE-K, there was a significant improvement in the success rate, with values consistently over 95% for most iterations. Although slight dips were observed at certain intervals, these were temporary and much less severe compared to what was observed before MAPE-K’s introduction. This considerable improvement highlights the effectiveness of dynamic workload redistribution and traffic optimization in mitigating overload issues. With secure data exchange and minimized request failures, the system meets the high demands of mission-critical IoT deployments, e.g., in industrial or e-health settings.
CPU Utilization (See Figure 6a): Before MAPE-K was applied, CPU utilization followed a steady increasing trend, exceeding 92% after the 200th iteration, a level critical to system stability. This increasing trend indicates shortcomings in workload management under high traffic conditions. After MAPE-K was introduced, CPU utilization stabilized at around 85%, with minor fluctuations, which ensured efficient resource utilization. The adaptive optimization of the framework effectively reduced CPU pressure, allowing the system to handle high workloads while maintaining overall system stability.
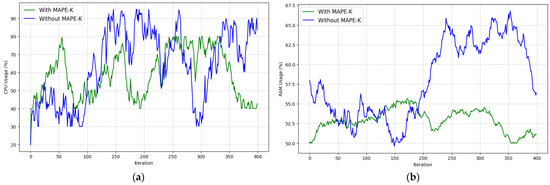
Figure 6.
Resource utilization comparison with and without MAPE-K framework: (a) CPU usage patterns showing more controlled utilization with MAPE-K; (b) RAM usage trends demonstrating lower and more stable memory consumption with MAPE-K optimization.
RAM Utilization (See Figure 6b): Before the integration with MAPE-K, RAM utilization exhibited significant fluctuation, often approaching 100% and threatening system stability and resource exhaustion at peak loads. After the integration with MAPE-K, RAM utilization indicated increased stability, averaging around 60% with a considerable reduction in the critical spikes. This fall indicates the framework’s ability to dynamically deallocate memory, thereby increasing system resilience as well as providing optimal resource utilization at a high workload.
The integration of MAPE-K within the OneM2M platform successfully addressed the critical QoS requirements for e-health applications. By dynamically optimizing traffic distribution and resource allocation, the system achieved significant improvements in RTT, success rate, CPU usage, and RAM utilization, ensuring reliable and responsive performance under demanding scenarios.
4.2. Cost Analysis
The cost analysis (See Table 5) evaluates the financial benefits of integrating the MAPE-K framework with mathematical modeling for dynamic workload distribution. The table below highlights the cost components before and after optimization, along with the percentage reduction for each.
Table 5.
Cost Analysis Before and After Optimization Modeling.
Cost analysis weighs against each other the economic advantages yielded when the MAPE-K framework and mathematical modeling are used together in the case of dynamic load scheduling. Below is the table showing the pre- and post-optimization cost factors and the respective percentage reduction.
The findings illustrate that the algorithm that we have proposed has its primary focus on Cloud VM Cost and Data Transfer Cost, as these two are optimizable, in contrast to the non-variable Microsoft-defined Azure IoT Hub Cost and the Support Cost. We reduced the Cloud VM Cost by 12% by illustrating heightened efficiency through intelligent dynamic workload offloading and resource provisioning. Likewise, the Data Transfer Cost reduced by a notable proportion by a value of 23% by optimizing the amount of data being uploaded in the cloud by efficiently avoiding redundant as well as unnecessary traffic. All such optimizations, by virtue of concentration in the respective domains, yielded an aggregate class cost reduction by a value of 10.44% as illustrated in the table V. This illustrates the practicability and efficiency-cy of our cost minimization approach, especially in IoT deployments where performance as well as per-commercial constraints become critical.
5. Conclusions and Perspectives
This study presents a new plan to improve Quality of Service (QoS) and reduce costs in IoT systems using OneM2M. It incorporates the MAPE-K loop to better handle workload and includes a math-based model to cut costs. This approach enhances key QoS factors like Round Trip Time (RTT), Success Rate, and how resources (CPU and RAM) are used. It also shows how to save money by balancing local and cloud computing resources, ensuring the system can expand and stay cost-effective. The novelty of this work lies in combining MAPE-K-based workload regulation with a quantitative cost model, delivering a complete QoS-cost optimization strategy in OneM2M IoT environments, especially for time-sensitive sectors like e-health.
Looking ahead, there are several ways to expand this work. One promising idea is to use machine learning to make QoS management more predictive and flexible. By forecasting future workloads and resource needs, the system can manage resources better, maintaining high QoS and cutting costs. Moreover, adding more QoS metrics like energy usage and network speed would offer a more complete picture of system performance. Future research could also test this framework in larger, more complex IoT environments like smart cities or industrial IoT to see how well it handles big tasks. These advancements will ensure IoT systems remain flexible, efficient, and ready to meet new challenges.
Author Contributions
Conceptualization, J.E.-T. and A.Z.; methodology, J.E.-T.; software, J.E.-T.; validation, J.E.-T., S.A. and A.Z.; formal analysis, J.E.-T.; investigation, J.E.-T.; resources, J.E.-T.; data curation, J.E.-T.; writing—original draft preparation, J.E.-T.; writing—review and editing, J.E.-T. and A.Z.; visualization, J.E.-T.; supervision, A.Z.; project administration, J.E.-T. and A.Z. All authors have read and agreed to the published version of the manuscript.
Funding
This research received no external funding. The APC was funded by the authors.
Institutional Review Board Statement
Not applicable.
Informed Consent Statement
Not applicable.
Data Availability Statement
The data presented in this study are available upon reasonable request from the corresponding author.
Conflicts of Interest
The authors declare no conflict of interest.
References
- Rahmani, A.M.; Bayramov, S.; Kalejahi, B.K. Internet of things applications: Opportunities and threats. Wirel. Pers. Commun. 2022, 122, 451–476. [Google Scholar] [CrossRef] [PubMed]
- Shouaib, M.; Metwally, K.; Badran, K. Survey on IoT-based Big Data Analytics. In Proceedings of the 13th International Conference on Electrical Engineering (ICEENG), Cairo, Egypt, 29–31 March 2022; pp. 81–85. [Google Scholar] [CrossRef]
- Et-Tousy, J.; Zyane, A. QoS in OneM2M: Performance Evaluation and Analysis. In Proceedings of the 4th International Conference on Electronic Engineering and Renewable Energy Systems—Volume 1 (ICEERE 2024), Saidia, Morocco; Springer: Singapore, 2025; Volume 1306. [Google Scholar] [CrossRef]
- Merseedi, K.J.; Zeebaree, S.R.M. The cloud architectures for distributed multi-cloud computing: A review of hybrid and federated cloud environment. Indones. J. Comput. Sci. 2024, 13, 1644–1673. [Google Scholar] [CrossRef]
- Pranavasri, V.J.S.; Francis, L.; Pal, G.; Mogadali, U.; Vattem, A.; Vaidhyanathan, K.; Gangadharan, D. Exploratory Study of oneM2M-based Interoperability Architectures for IoT: A Smart City Perspective. Authorea 2024, preprint. [Google Scholar]
- Internet of Things (IoT) Market Size, Share, and Trends 2024 to 2033. Available online: https://www.precedenceresearch.com/internet-of-things-market (accessed on 20 March 2025).
- Mutichiro, B.; Tran, M.-N.; Kim, Y.-H. QoS-Based Service-Time Scheduling in the IoT-Edge Cloud. Sensors 2021, 21, 5797. [Google Scholar] [CrossRef] [PubMed]
- Cao, L.; Huo, T.; Li, S.; Zhang, X.; Chen, Y.; Lin, G.; Wu, F.; Ling, Y.; Zhou, Y. Cost optimization in edge computing: A survey. Artif. Intell. Rev. 2024, 57, 312. [Google Scholar] [CrossRef]
- Andriulo, F.C.; Fiore, M.; Mongiello, M.; Traversa, E.; Zizzo, V. Edge Computing and Cloud Computing for Internet of Things: A Review. Informatics 2024, 11, 71. [Google Scholar] [CrossRef]
- Darwish, D. Emerging Trends in Cloud Computing Analytics, Scalability, and Service Models; IGI Global: Hershey, PA, USA, 2024. [Google Scholar]
- Silva, F.A.; Fé, I.; Gonçalves, G. Stochastic models for performance and cost analysis of a hybrid cloud and fog architecture. J. Supercomput. 2021, 77, 1537–1561. [Google Scholar] [CrossRef]
- Entrialgo, J.; Moreno-Vozmediano, R.; Díaz, J.L. Cost and response time optimization of edge architectures. Clust. Comput. 2024, 27, 7757–7773. [Google Scholar] [CrossRef]
- Zhou, J.; Pal, S.; Dong, C.; Wang, K. Enhancing quality of service through federated learning in edge-cloud architecture. Ad Hoc Netw. 2024, 156, 103430. [Google Scholar] [CrossRef]
- Et-tousy, J.; Zyane, A. A Comparative Study of HTTP and MQTT in OneM2M: A QoS Perspective. In Proceedings of the 9th Smart City Applications International Conference (SCA24), Tanger, Morocco, 2–4 October 2024. [Google Scholar]
- Et-tousy, J.; Zyane, A. Automated QoS Enhancement in OneM2M: Traffic-Oriented Approach for MQTT and HTTP Based on IoT SLA Variations. In Proceedings of theInternational Conference on Advances in Communication Technology and Computer Engineering (ICACTCE’24), Marrakech, Morocco, 29–30 November 2024. [Google Scholar]
- Azure IoT—Internet of Things Platform. Available online: https://azure.microsoft.com (accessed on 1 April 2025).
- Zyane, A.; Bahiri, M.N.; Ghammaz, A. IoTScal-H: Hybrid monitoring solution based on cloud computing for autonomic middleware-level scalability management within IoT systems and different SLA traffic requirements. Int. J. Commun. Syst. 2020, 33, e4495. [Google Scholar] [CrossRef]


Disclaimer/Publisher’s Note: The statements, opinions and data contained in all publications are solely those of the individual author(s) and contributor(s) and not of MDPI and/or the editor(s). MDPI and/or the editor(s) disclaim responsibility for any injury to people or property resulting from any ideas, methods, instructions or products referred to in the content. |
© 2025 by the authors. Licensee MDPI, Basel, Switzerland. This article is an open access article distributed under the terms and conditions of the Creative Commons Attribution (CC BY) license (https://creativecommons.org/licenses/by/4.0/).