Proceeding Paper

Development of a Nano- and Microfiber Mesh-Based Biosensor for the Rapid Quantification of Human C-Reactive Protein (CRP) †

1
Department of Electrical and Electronic Engineering, Faculty of Engineering, Stellenbosch University, Stellenbosch 7600, South Africa
2
Innovation4life (PTY) Ltd., Stellenbosch 7600, South Africa
*
Author to whom correspondence should be addressed.
Presented at the Micro Manufacturing Convergence Conference, Stellenbosch, South Africa, 7–9 July 2024.
Eng. Proc. 2025, 109(1), 15; https://doi.org/10.3390/engproc2025109015
Published: 19 September 2025

Abstract

Recent investigations into C-reactive protein (CRP) dynamics have shown that by evaluating the change in CRP level in a patient over time, it is possible to distinguish between bacterial and viral infections more accurately thereby guiding antimicrobial prescription practices. Consequently, a biosensor targeted towards CRP was developed using a nano- and microfiber mesh-based transducer. The produced transducers were functionalized with streptavidin, after which a biorecognition element, anti-CRP antibodies, could be bound to the sensor. Confirmation of the sensor production phases was obtained using fluorescence microscopy. The sensors were evaluated using Electrochemical Impedance Spectroscopy (EIS) and showed increasing changes in the impedance modulus corresponding to increasing concentrations of CRP in solution following a parabolic trend line.
Keywords:
nanofiber; CRP; AMR; EIS; infection

1. Introduction

When prescribing antimicrobials, it is imperative that accurate diagnostic data are available. Guided prescription practices improve patient outcomes and help fight the development of antimicrobial resistance (AMR). Without diagnostic information, both inappropriate antimicrobial prescription and prescription practices occur. These practices, and an overreliance on broad-spectrum antibiotics, have been identified as key drivers of the development of AMR [1,2,3]. With this in mind, obtaining data that help to differentiate between bacterial and viral infections is of great value [2,3]. Recent studies have found that, by evaluating human C-reactive protein (CRP) dynamics, it is possible to differentiate between these two types of infection. Estimated CRP velocity (eCRPv) and CRP velocity (CRPv) are parameters obtained by evaluating CRP level with respect to time. The data show that patients with bacterial infections show significantly higher eCRPv and CRPv values than those with viral infections [4,5]. To this end, a biosensor was developed for the rapid quantification of CRP levels. This sensor used a nano- and microfiber mesh-based transducer produced through electrospinning onto gold interdigitated electrodes (IDEs) [6]. This transducer was coupled with anti-CRP antibodies, after functionalization, as the biorecognition element. This type of substrate has an increased surface-area-to-volume ratio as compared to thin films or fixed electrodes, resulting in an increased number of potential binding sites for the sensor, while the antibodies provide the required specificity. CRP levels are considered normal below 3 ug/mL, slightly elevated at 3–10 ug/mL, moderately elevated at 10–100 ug/mL, and markedly elevated above 100 ug/mL [6]. To this end, the sensors produced must at minimum be able to detect concentrations below 3 ug/mL. Sensors with high sensitivity to low concentrations can be used with diluted samples. In this study, sensors were produced, and a response profile was developed correlating changes in CRP concentration to changes in the impedance modulus. Impedance was measured using Electrochemical Impedance Spectroscopy (EIS).

2. Materials and Methods

The transducers were developed using the processes described in [7]. The polymer blend consisted of poly (vinyl alcohol) (PVA) (MW 89,000–98,000 obtained from Merck, Darmstadt, Germany), polyethylene oxide (PEO) (MW 1,000,000, obtained from Merck), poly (3,4-ethylenedioxythiophene) polystyrene sulfonate (PEDOT:PSS) (Clevios PH1000, obtained from Ossila, Sheffield, UK), and N,N-Dimethylformamide (DMF) (obtained from Merck). Once the transducers had been made, it became necessary to functionalize them to bind the biorecognition element. At this point, wells manufactured from laser-cut poly (methyl methacrylate) were secured to the transducers by means of 3M double-sided tape. The transducers were functionalized by incubating 50 µL of a 1:10 dilution of streptavidin-HRP (obtained from Merck) in DI water in each well for 30 min. After incubation, the wells were rinsed five times with phosphate-buffered saline (PBS). Initial confirmation of functionalization was achieved with the application of 3,3ʹ,5,5ʹ-tetramethylbenzidine (TMB) (obtained from Merck) which changes color in the presence of HRP. Once this had been confirmed, secondary testing was conducted using a biotinylated fluorophore, biotin (5-fluorescein) conjugate (obtained from Merck). Fluorescence microscopy confirmed the presence of viable streptavidin on the surface of the transducer.
The next phase of the study involved binding the antibodies to the substrate. A biotinylation kit, Biotin Conjugation Kit (Fast, Type B) (sourced from Abcam, Cambridge, UK), was used in conjunction with monoclonal antibodies sourced from Cloud-Clone Corp., Wuhan, China (host species mouse). The kit yielded antibodies with a biotin tag on the Fc portion of the antibodies. From the stock solution, biotinylated antibodies, at a concentration of 20.833 µg/mL of PBS, were made. These antibodies were allowed to incubate onto functionalized transducers (and a non-functionalized control transducer) for 6 h in a dark room. After incubation, the sensors were rinsed five times with PBS to remove any unbound antibodies. Afterwards, 50 µL of 40 µg/mL of secondary anti-mouse antibody with an Alexa Fluor 488 tag was placed in the wells. This antibody was allowed to incubate for 5 h in a dark room. After incubation, the wells were again rinsed five times with PBS, after which the sensors underwent confocal fluorescence microscopy using a Zeiss LSM780 (Zeiss: Oberkochen, Germany), the results of which show that the primary antibodies successfully bound to the functionalized transducers (see Figure 1a). Note that the control sample would have no antibodies bound to the nanofibers as the nanofibers were not functionalized with streptavidin, meaning that no biotinylated antibodies would bind to them. The absence of primary antibodies meant that no secondary antibodies would bind, resulting in no fluorescent markers on the control. Figure 1b shows clean black bands where no fluorescence is observed. These are the gold fingers of the IDEs. The lack of fluorescence confirms that the nanofibers do not auto-fluoresce, unlike the FR4 substrate.
Testing of the sensor response to antigen exposure was then conducted. Six concentrations were identified for testing: 100 ng/mL, 200 ng/mL, 400 ng/mL, 800 ng/mL, 1.6 µg/mL, and 3.2 µg/mL. The testing protocol was as follows: (1) the sensors were rinsed and then allowed to incubate in PBS for 30 min to reach stability; (2) the first measurements were taken using EIS; (3) the sensors were exposed to 50 µL of the antigen dilution; (4) the antigen solution was incubated for 40 min; (5) the antigen solution was emptied, the well rinsed and refilled with PBS; and (6) the final measurements were taken. EIS was performed using a Digilent Analog Discovery 2. EIS was performed with a fixed 0V offset and an applied AC amplitude of 10 mV. Tests were conducted using two separate sensors per concentration. Five measurements were taken per sensor before and after antigen exposure.

3. Results and Discussion

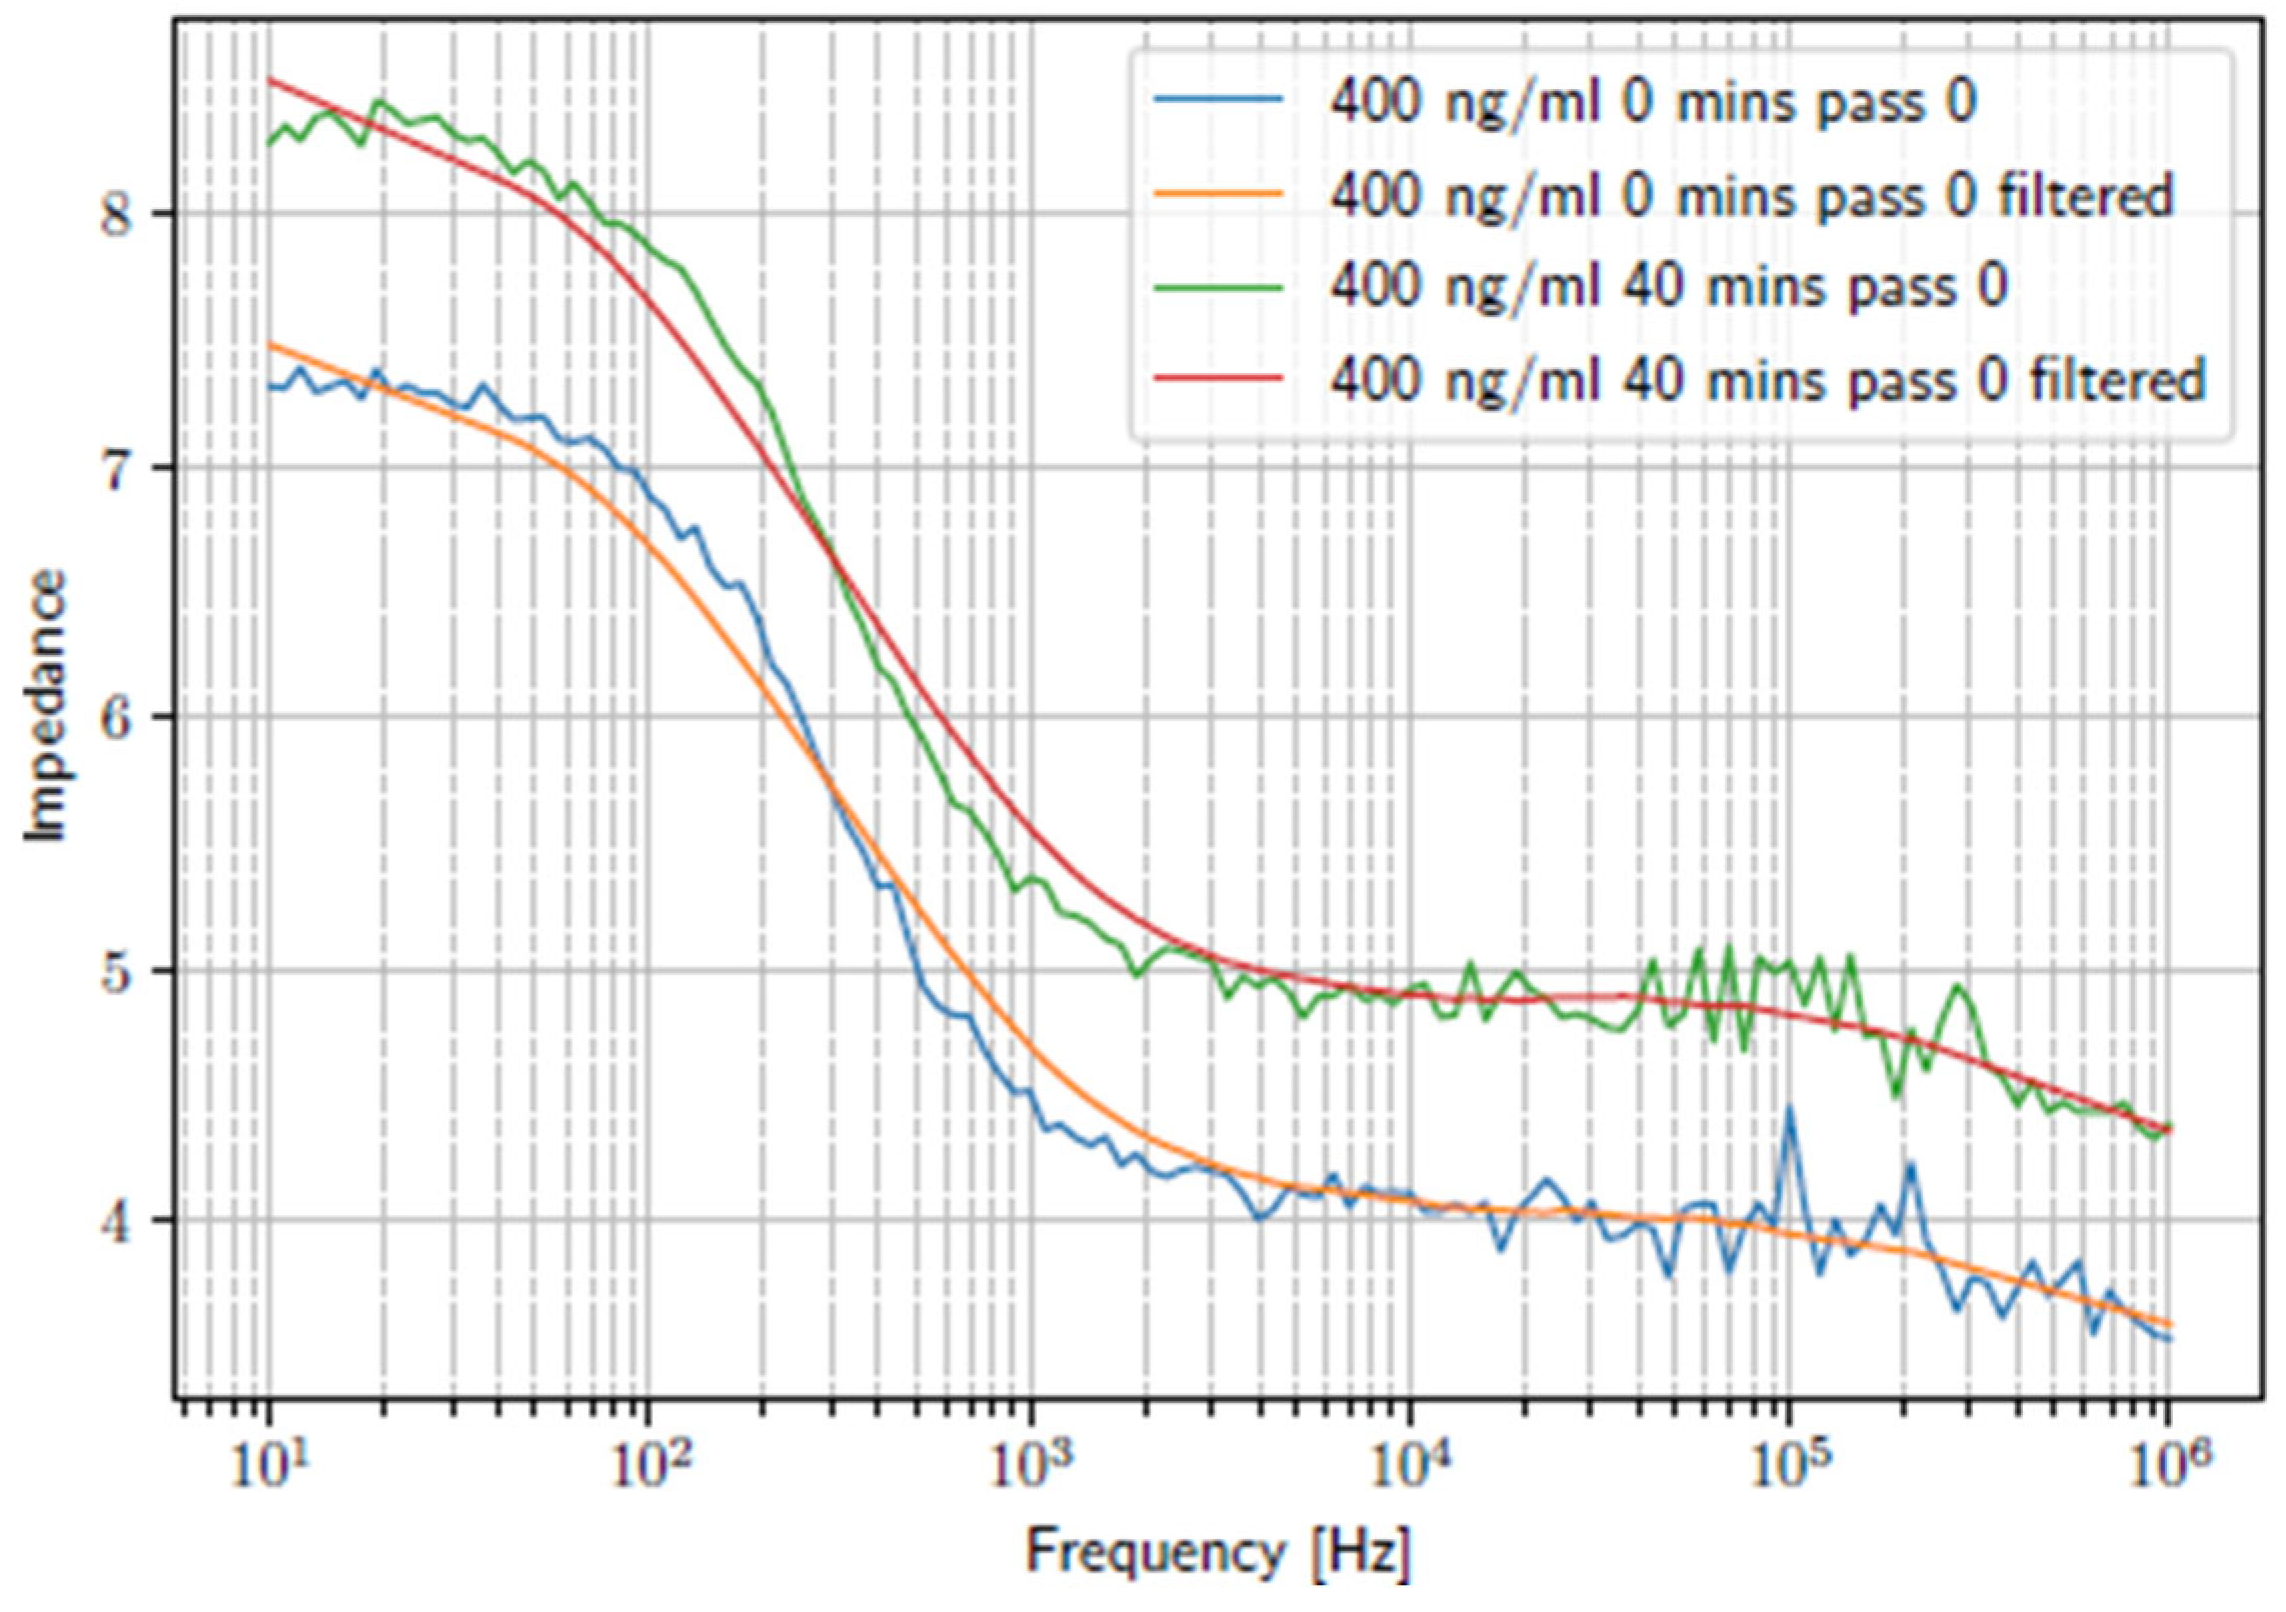
The EIS spectra were obtained for the range 10 Hz to 10 MHz, after which a Savitzky–Golay filter was applied to the data to compensate for noise in the system. Figure 2 shows the bode plot of one measurement taken before and one measurement taken after antigen addition (at 400 ng/mL). The raw data is overlaid with the filtered data. The filter had a window length of 31 and a polynomial order of 1.
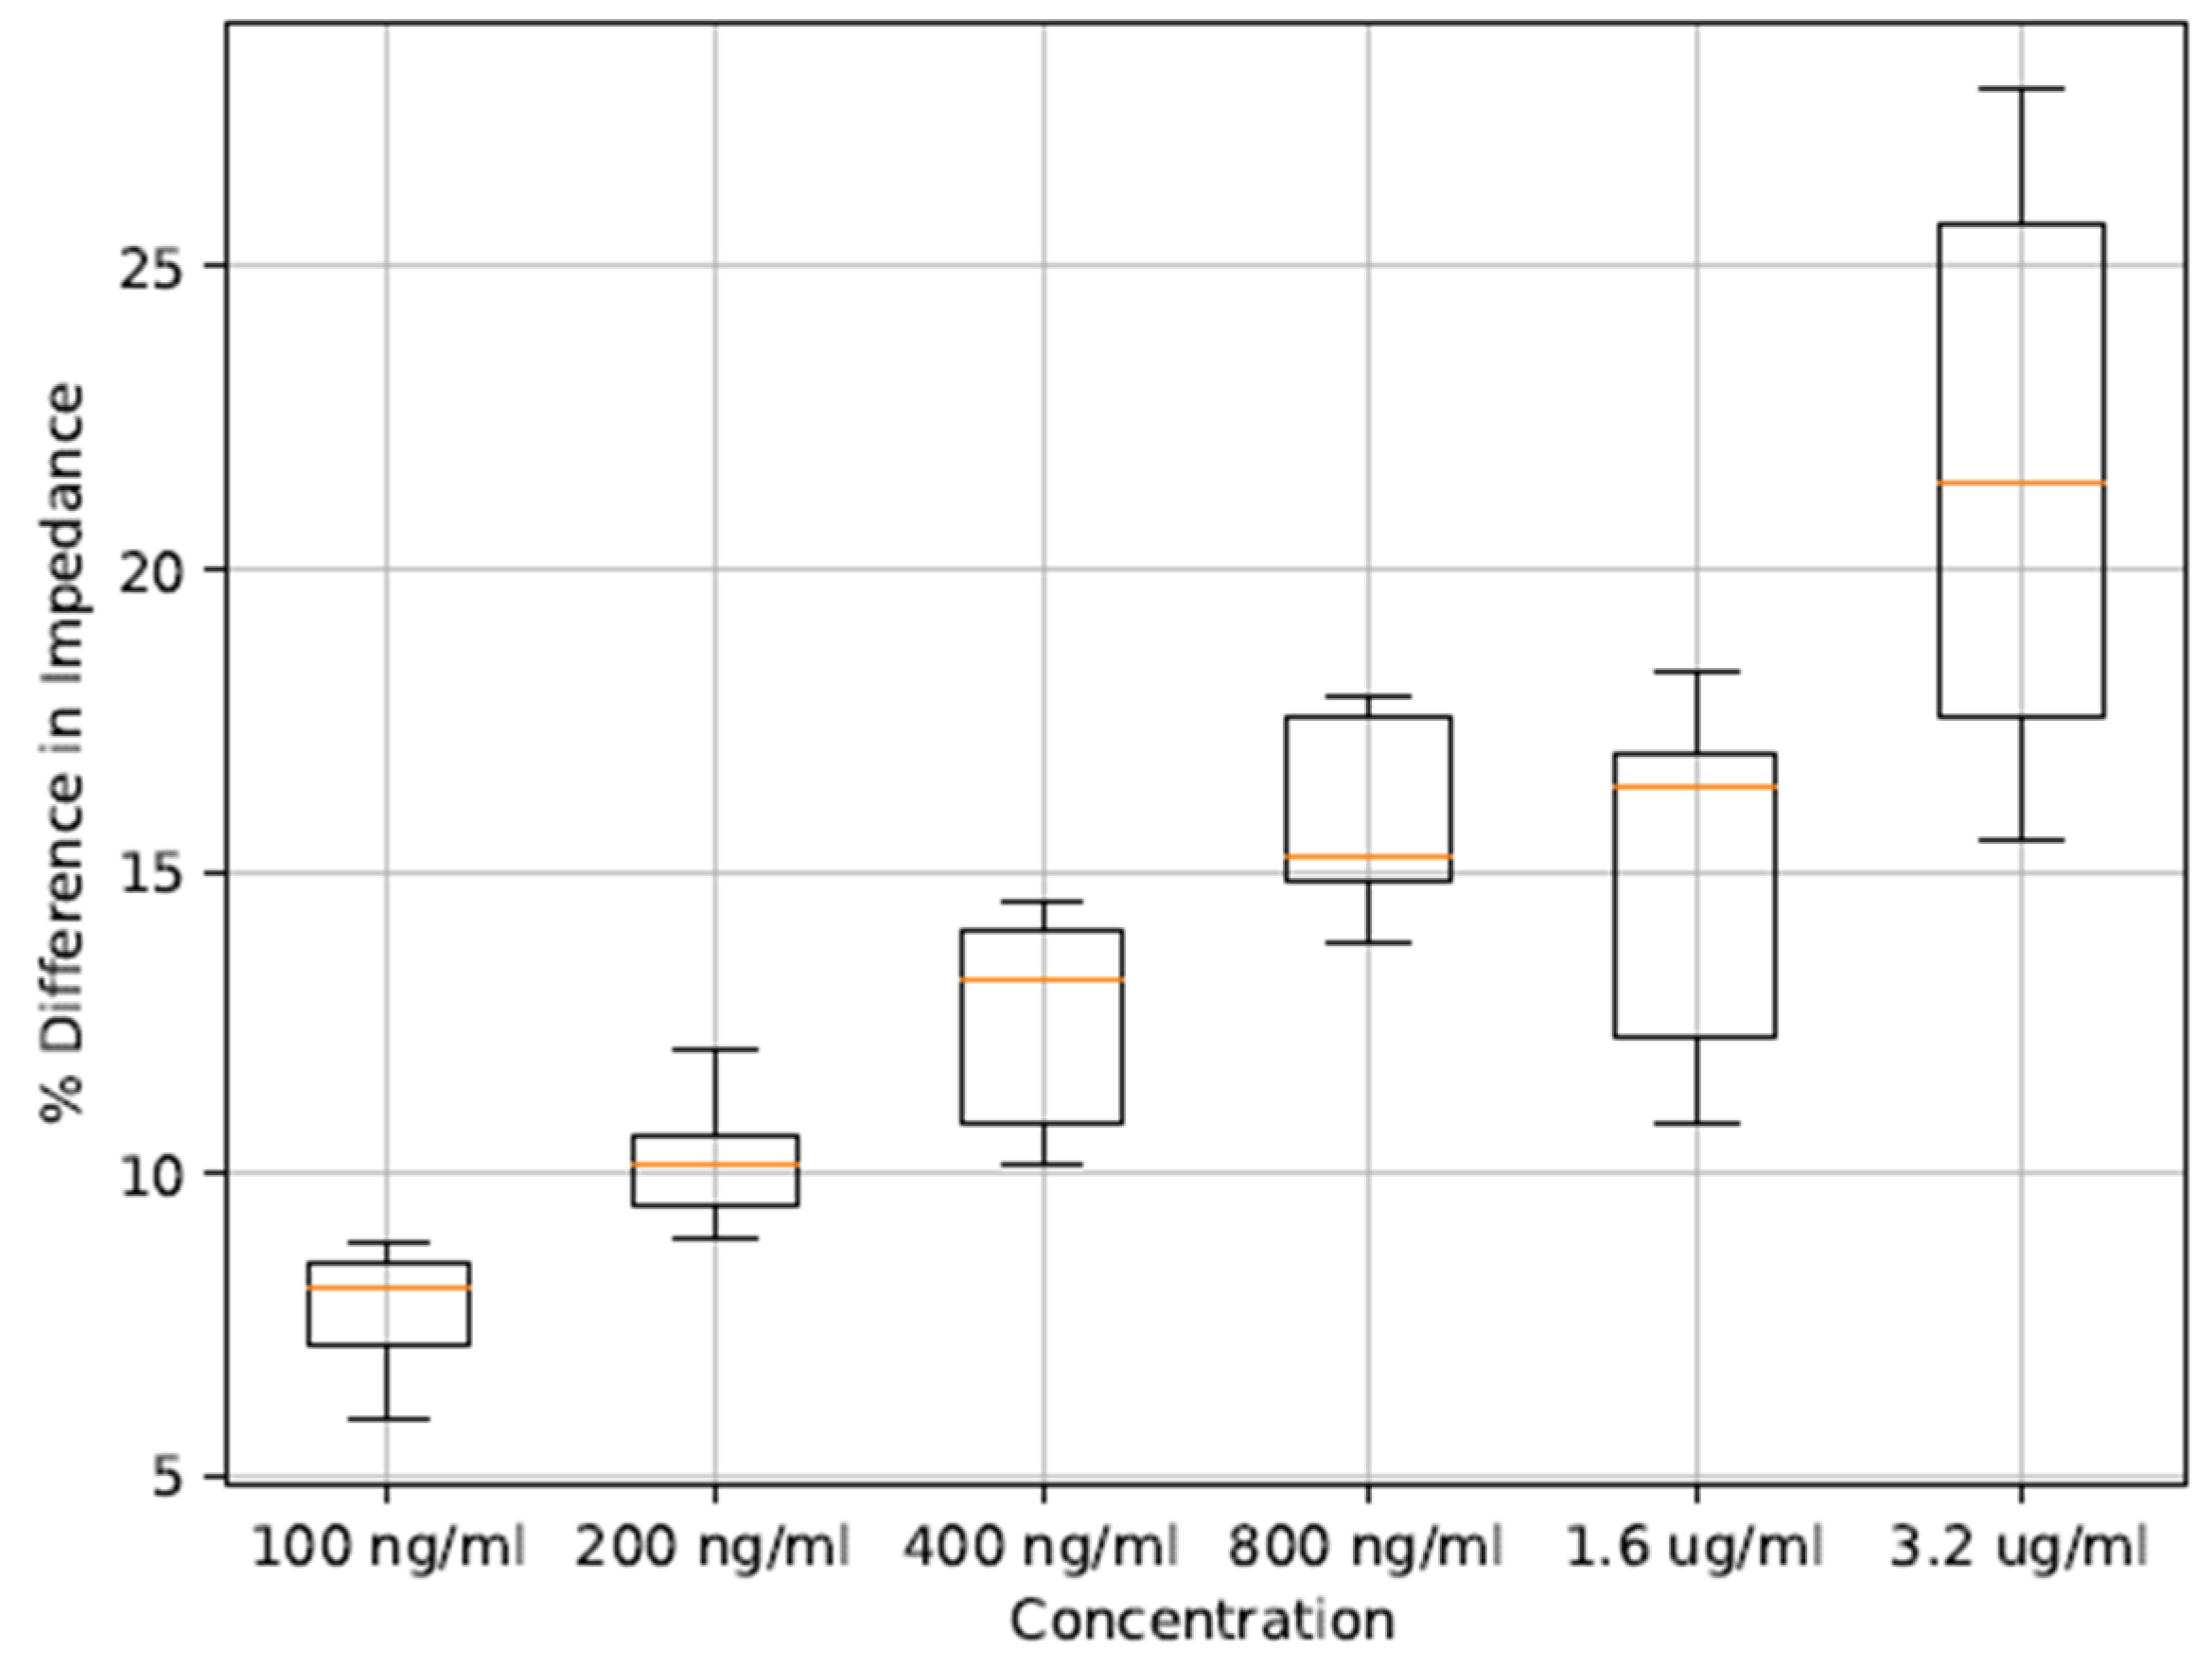
The spectra of the complete data set were then evaluated at 10 Hz, and the percentage difference in the sensor responses (before and after exposure to the antigen) was calculated. The spread of the data can be seen in a boxplot in Figure 3.
This figure shows a trend of an increasing change in the impedance modulus, corresponding to an increase in antigen concentration. The data show a tight distribution at lower concentrations. Plotting the medians of the data sets, to gain insight into the trend of the data while accounting for outliers, on a linear plot shows a parabolic trend (see Figure 4).
As the data reflect the behavior of small particles in media, it is appropriate to look to the diffusion equation. In light of the parabolic nature of the diffusion equation, a parabolic curve was fitted to the data, yielding a function that has an R-square rating of 0.9258 and an adjusted R-square rating of 0.8763, which indicates that the plot fits the data well.

4. Conclusions

A link between the medians and the change in the impedance modulus of the data can be observed. It should also be noted that the variance in the data set increases towards higher concentrations. The link shows a parabolic trend, which is in line with the expected results as the sensor is expected to saturate at high concentrations as per the diffusion equation. This sensor shows promise for future practical applications, owing to its high sensitivity.

Author Contributions

Conceptualization, A.L. and W.P.; methodology, A.L.; formal analysis, A.L.; investigation, A.L.; resources, W.P.; data curation, A.L.; writing—original draft preparation, A.L.; writing—review and editing, A.L., W.P. and P.F.; supervision, W.P. and P.F.; project administration, W.P. All authors have read and agreed to the published version of the manuscript.

Funding

This research received no external funding.

Institutional Review Board Statement

Not applicable.

Informed Consent Statement

Not applicable.

Data Availability Statement

The data presented in this study are available on request from the corresponding author.

Conflicts of Interest

Author Pieter Fourie was co-CEO of the company Innovation4Life (PTY) Ltd. The remaining authors declare that the research was conducted in the absence of any commercial or financial relationships that could be construed as a potential conflict of interest.

References

  1. World Health Organization. Global Action Plan on Antimicrobial Resistance; World Health Organization: Geneva, Switzerland, 2015; pp. 1–19.
  2. Dittrich, S.; Tadesse, B.T.; Moussy, F.; Chua, A.; Zorzet, A.; Tängdén, T.; Dolinger, D.L.; Page, A.; Crump, J.A.; D’Acremont, V.; et al. Target product profile for a diagnostic assay to differentiate between bacterial and non-bacterial infections and reduce antimicrobial overuse in resource-limited settings: An expert consensus. PLoS ONE 2016, 11, e0161721. [Google Scholar] [CrossRef] [PubMed]
  3. Dittrich, S. Meeting of Experts on Biomarkers to Discriminate Bacterial from Other Infectious Causes of Acute Fever; World Health Organization: Geneva, Switzerland, 2015; pp. 5–23.
  4. Bernstein, D.; Coster, D.; Berliner, S.; Shapira, I.; Zeltser, D.; Rogowski, O.; Adler, A.; Halutz, O.; Levinson, T.; Ritter, O.; et al. C-reactive protein velocity discriminates between acute viral and bacterial infections in patients who present with relatively low CRP concentrations. BMC Infect. Dis. 2021, 21, 1210. [Google Scholar] [CrossRef] [PubMed]
  5. Levinson, T.; Wasserman, A. C-Reactive Protein Velocity (CRPv) as a New Biomarker for the Early Detection of Acute Infection/Inflammation. Int. J. Mol. Sci. 2022, 23, 8100. [Google Scholar] [CrossRef] [PubMed]
  6. Nehring, S.M.; Goyal, A.; Patel, B.C. C Reactive Protein. In StatPearls; StatPearls Publishing: St. Petersburg, FL, USA, 2023. [Google Scholar]
  7. Lloyd, A.M.; Perold, W.J.; Fourie, P.R. Electrospun Nano- and Microfiber Mesh-Based Transducer for Electrochemical Biosensing Applications. Eng. Proc. 2023, 58, 100. [Google Scholar]
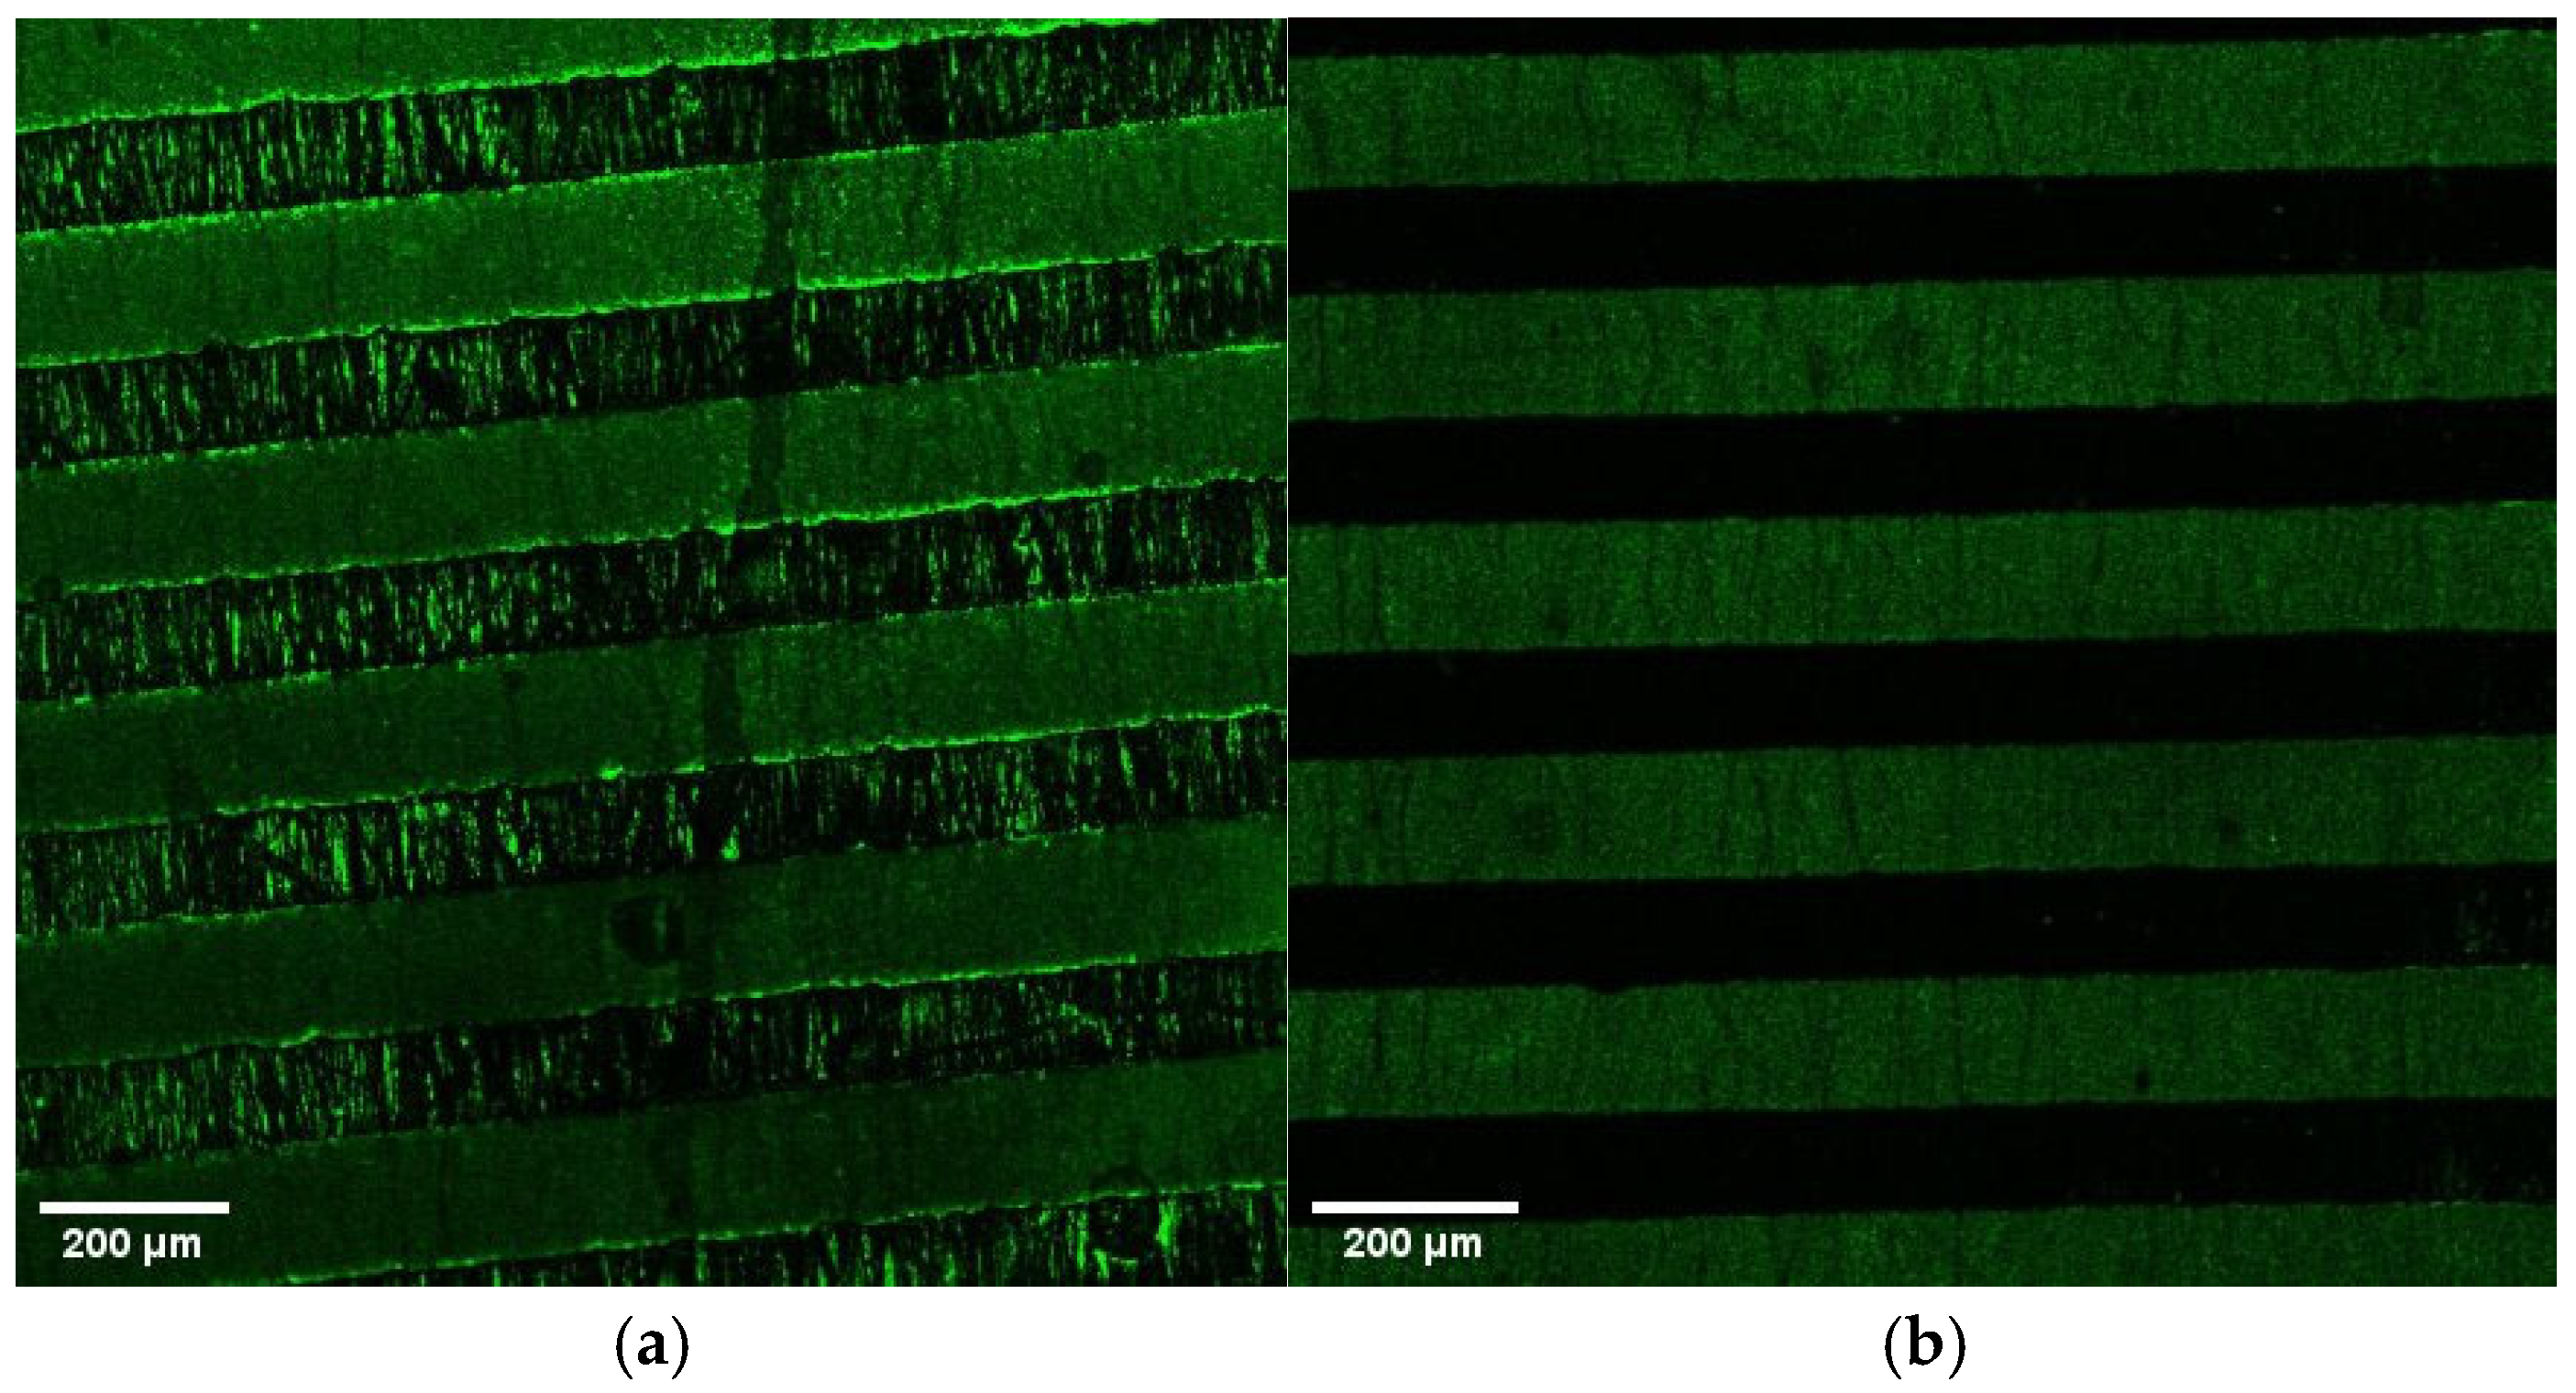
Figure 1. (a) Alexa Fluor 488 tagged antibodies confirming binding of anti-CRP antibodies to the nano- and microfiber mesh-based substrate; (b) control with no streptavidin to bind anti-CRP antibodies.
Engproc 109 00015 g001
Figure 2. A bode plot of measurements taken before and after antigen addition (at 400 ng/mL). The raw data is overlaid with the Savitzky–Golay filtered data set.
Engproc 109 00015 g002
Figure 3. Box-and-whisker diagram of the percentage difference in the impedance modulus observed at different concentrations of CRP in PBS.
Engproc 109 00015 g003
Figure 4. Median sensor responses and trendline of different concentrations of CRP in PBS.
Engproc 109 00015 g004
Disclaimer/Publisher’s Note: The statements, opinions and data contained in all publications are solely those of the individual author(s) and contributor(s) and not of MDPI and/or the editor(s). MDPI and/or the editor(s) disclaim responsibility for any injury to people or property resulting from any ideas, methods, instructions or products referred to in the content.