1. Introduction
Climate change is the most pressing global challenge, with far-reaching consequences that extend beyond environmental degradation and significant socio-economic impacts. The seafood industry is also directly affected by increasing disruptions due to rising sea surface temperatures, ocean acidification, and extreme weather events. These phenomena have contributed to the proliferation of parasites in marine ecosystems, resulting in a growing prevalence of parasite-infested seafood. This is a serious threat to the safety, reliability, and commercial viability of seafood products and a particular concern for intermediaries and distributors who must deliver fresh, safe, and high-quality goods to consumers.
To counteract the decline in seafood quality and ensure product safety, the industry has adopted advanced freezing technologies. These methods offer the ability to preserve the freshness and appearance of fish over long durations without compromising hygiene standards. Such frozen seafood products have opened new avenues for business development, including through exports and the establishment of value-added product lines. However, as freezing technologies have become widely adopted, new operational challenges have arisen in processing seafood before freezing it.
Before freezing fish, they are cut into standardized forms such as filets or sashimi slices. These slices conform to specific size and weight criteria to meet market expectations and ensure even freezing. However, in most processing factories, skilled workers are performing this task. Despite their experience, the manual nature of the task inevitably introduces variability in the product dimensions, leading to inconsistent sizes of sashimi pieces. Such inconsistency worsens the quality and raises the risk of defective or out-of-spec products. The absence of a standardized sizing process affects the production efficiency, introduces delays in packaging and labeling, and undermines the overall reliability of the supply chain.
To address these issues, we developed an artificial intelligence (AI)-based product size detection system for sashimi products. The system was designed to operate under the constraints present in seafood processing, where challenges such as overlapping slices, angular misalignment of trays, and inconsistent lighting conditions affect the detection accuracy. We automated the process of detecting sashimi pieces and evaluating their size parameters, such as their length, width, and surface area, to ensure conformity with predefined quality standards.
The development of this system aligns with the growing trend of utilizing advanced technologies in the food industry, such as AI and computer vision [
1,
2,
3]. Automated inspection systems are important in various food sectors, offering unprecedented precision in recognizing variations and defects. Modern food inspection technology, encompassing machine vision and AI algorithms, enhances control over product safety and quality. Furthermore, the implementation of advanced inspection technologies ensures safety and minimizes waste. Size and color are parameters that consumers consider important [
4]. Computer vision is widely applied in food product inspection for size measurement, sorting, grading, and detecting unwanted objects or defects. Various size attributes, such as the length, width, area, and even the volume and surface area (assuming axisymmetric shapes for objects such as eggs, apples, and lemons), are measured using computer vision for different food products. Machine learning techniques are also employed in image processing for classifying rice grains and predicting their size and mass [
5].
Previous studies demonstrated the applicability of computer vision and machine learning for size and quality assessment in the food processing of raw fish, such as sashimi, but encountered challenges. Sashimi processing involves handling delicate and irregular shapes positioned at various angles, requiring robust detection methods to handle orientation variability. The system we developed employs an angle-aware object detection method using YOLOv11n-obb tailored for sashimi to detect tilted objects. By integrating an advanced computer vision technique with weight measurement, the developed system automates size validation and enhances efficiency and quality control in frozen seafood processing. However, applying advanced AI models requires robust data validation, and challenges exist in adequately validating such methods. Therefore, it is important to obtain sufficient high-quality raw data to ensure robust validation processes. The system solves inherent difficulties in developing AI systems for food inspection applications, especially since it shows a high classification accuracy.
In this article,
Section 2 provides the background and related work on object counting and size detection using images and AI for automated food inspection.
Section 3 describes the methodology, including the data collection system and the implementation of the YOLOv11n-obb model.
Section 4 presents the experimental setup and discusses the results obtained. Finally,
Section 5 provides conclusions and outlines directions for future work.
2. Related Work
Visual object counting and size detection using image analysis have become essential in many industries, particularly for quality control in food processing. Recent advancements in deep learning have significantly enhanced the accuracy, robustness, and speed of object detection systems, enabling high-throughput outcomes. For object detection and counting, recursive convolutional neural network (R-CNN) algorithms are widely used [
6,
7]. These algorithms employ a region proposal network (RPN) [
8] to generate candidate object regions, which are then classified and refined by a CNN [
9]. The faster R-CNN has been widely used due to its balance of speed and precision. For object counting, the final classification layer is modified to output object quantities instead of bounding boxes to aggregate the instance counts. This method is effective on benchmarks such as the common objects in context (COCO) and Pascal visual object class (VOC) datasets [
10,
11].
Another notable architecture is a multi-column CNN (MC-CNN) [
12], which employs multiple CNNs trained at different input resolutions. This accounts for scale variations and occlusions that often hinder accurate object counting. MC-CNNs demonstrate excellent performance in scenes with dense, overlapping, or variably sized objects, making them applicable to complex environments such as fish processing lines. While region-based methods such as the faster R-CNN show high accuracy, You Only Look Once (YOLO) algorithms are used for real-time detection with minimal trade-offs in precision. YOLO divides an input image into a grid and uses a single CNN to predict bounding boxes and class probabilities for each region simultaneously [
13]. This architecture enables high-speed processing and is particularly well-suited for embedded or industrial applications where the detection latency must be minimized.
Subsequent versions of YOLO [
14], YOLOv2 [
15], YOLOv3 [
16], YOLOv4 [
17], YOLOv5 [
18], and YOLOv7, have been improved through the incorporation of deeper backbones, anchor boxes, feature pyramid networks, and attention mechanisms. Notably, YOLOv7 introduces a hybrid backbone structure and self-attention layers that enhance both the detection accuracy and efficiency in food-related applications, including real-time food portioning and product inspection. YOLOv8 advances this architecture by adopting an anchor-free detection mechanism, optimizing it for small-object recognition and multi-scale inference. These enhancements prove that YOLOv8 is effective in dense, cluttered visual scenes, common in food trays or packaging lines [
19]. A variant of YOLOv11 [
20], YOLOv11_obb, introduces an innovative method which supports oriented bounding box (OBB) detection. Unlike previous YOLO models that used axis-aligned rectangles, YOLOv11_obb detects objects at arbitrary angles by outputting rotated bounding boxes. This is important in sashimi processing, where fish slices are placed irregularly or at varying orientations on trays. Traditional detection models often misjudge the dimensions in such scenarios, leading to inaccuracies in object classification and size estimation.
In this research, YOLOv11_obb was utilized to address two challenges, overlapping sashimi pieces, which often occur during high-volume processing, and angular misalignment caused by tilting trays or randomly placed slices. By leveraging OBB detection, the developed system precisely identifies each piece of sashimi, accurately calculates its surface area and dimensions, and determines whether it meets predefined quality criteria. Additionally, YOLOv11_obb maintains the real-time inference capability required for seamless integration into production lines.
3. System Overview
The workflow of the developed system integrates traditional processing methods with AI-based inspection technology for quality control of sashimi processing (
Figure 1). In this process, fish undergoes manual pretreatment, such as cleaning, cutting, and being sliced into sashimi portions. The sliced sashimi is placed on trays for downstream processing. At this stage, an imaging system is used to collect large volumes of training data for training an AI-based sashimi size detection model. Sashimi is placed on trays under a camera. These images are used to train the YOLOv11n-obb model to detect objects at various orientation angles. This allows the model to precisely identify sashimi pieces even when they are slightly rotated or misaligned.
Once the size detection model is trained, it is integrated into the sashimi size detection system. The system is installed on site in the factory, as shown in
Figure 1. Sashimi on trays is passed through the AI detection system, which captures images, detects each sashimi piece, evaluates its size based on bounding box data and the tray dimensions, and judges whether it complies with predefined quality standards. The results are displayed for the immediate identification of out-of-spec products.
After inspection, the trays of approved sashimi slices continue through the standard production flow. The sashimi pieces are vacuum-sealed and inspected for metals to ensure product safety. Approved products are transported to the freezing unit, where they are rapidly frozen to maintain freshness and hygiene. The frozen sashimi pieces are packed for shipment, ensuring high-quality delivery to customers. In the factory, trays are transported between workstations. The transportation process allows for production tracking and process monitoring.
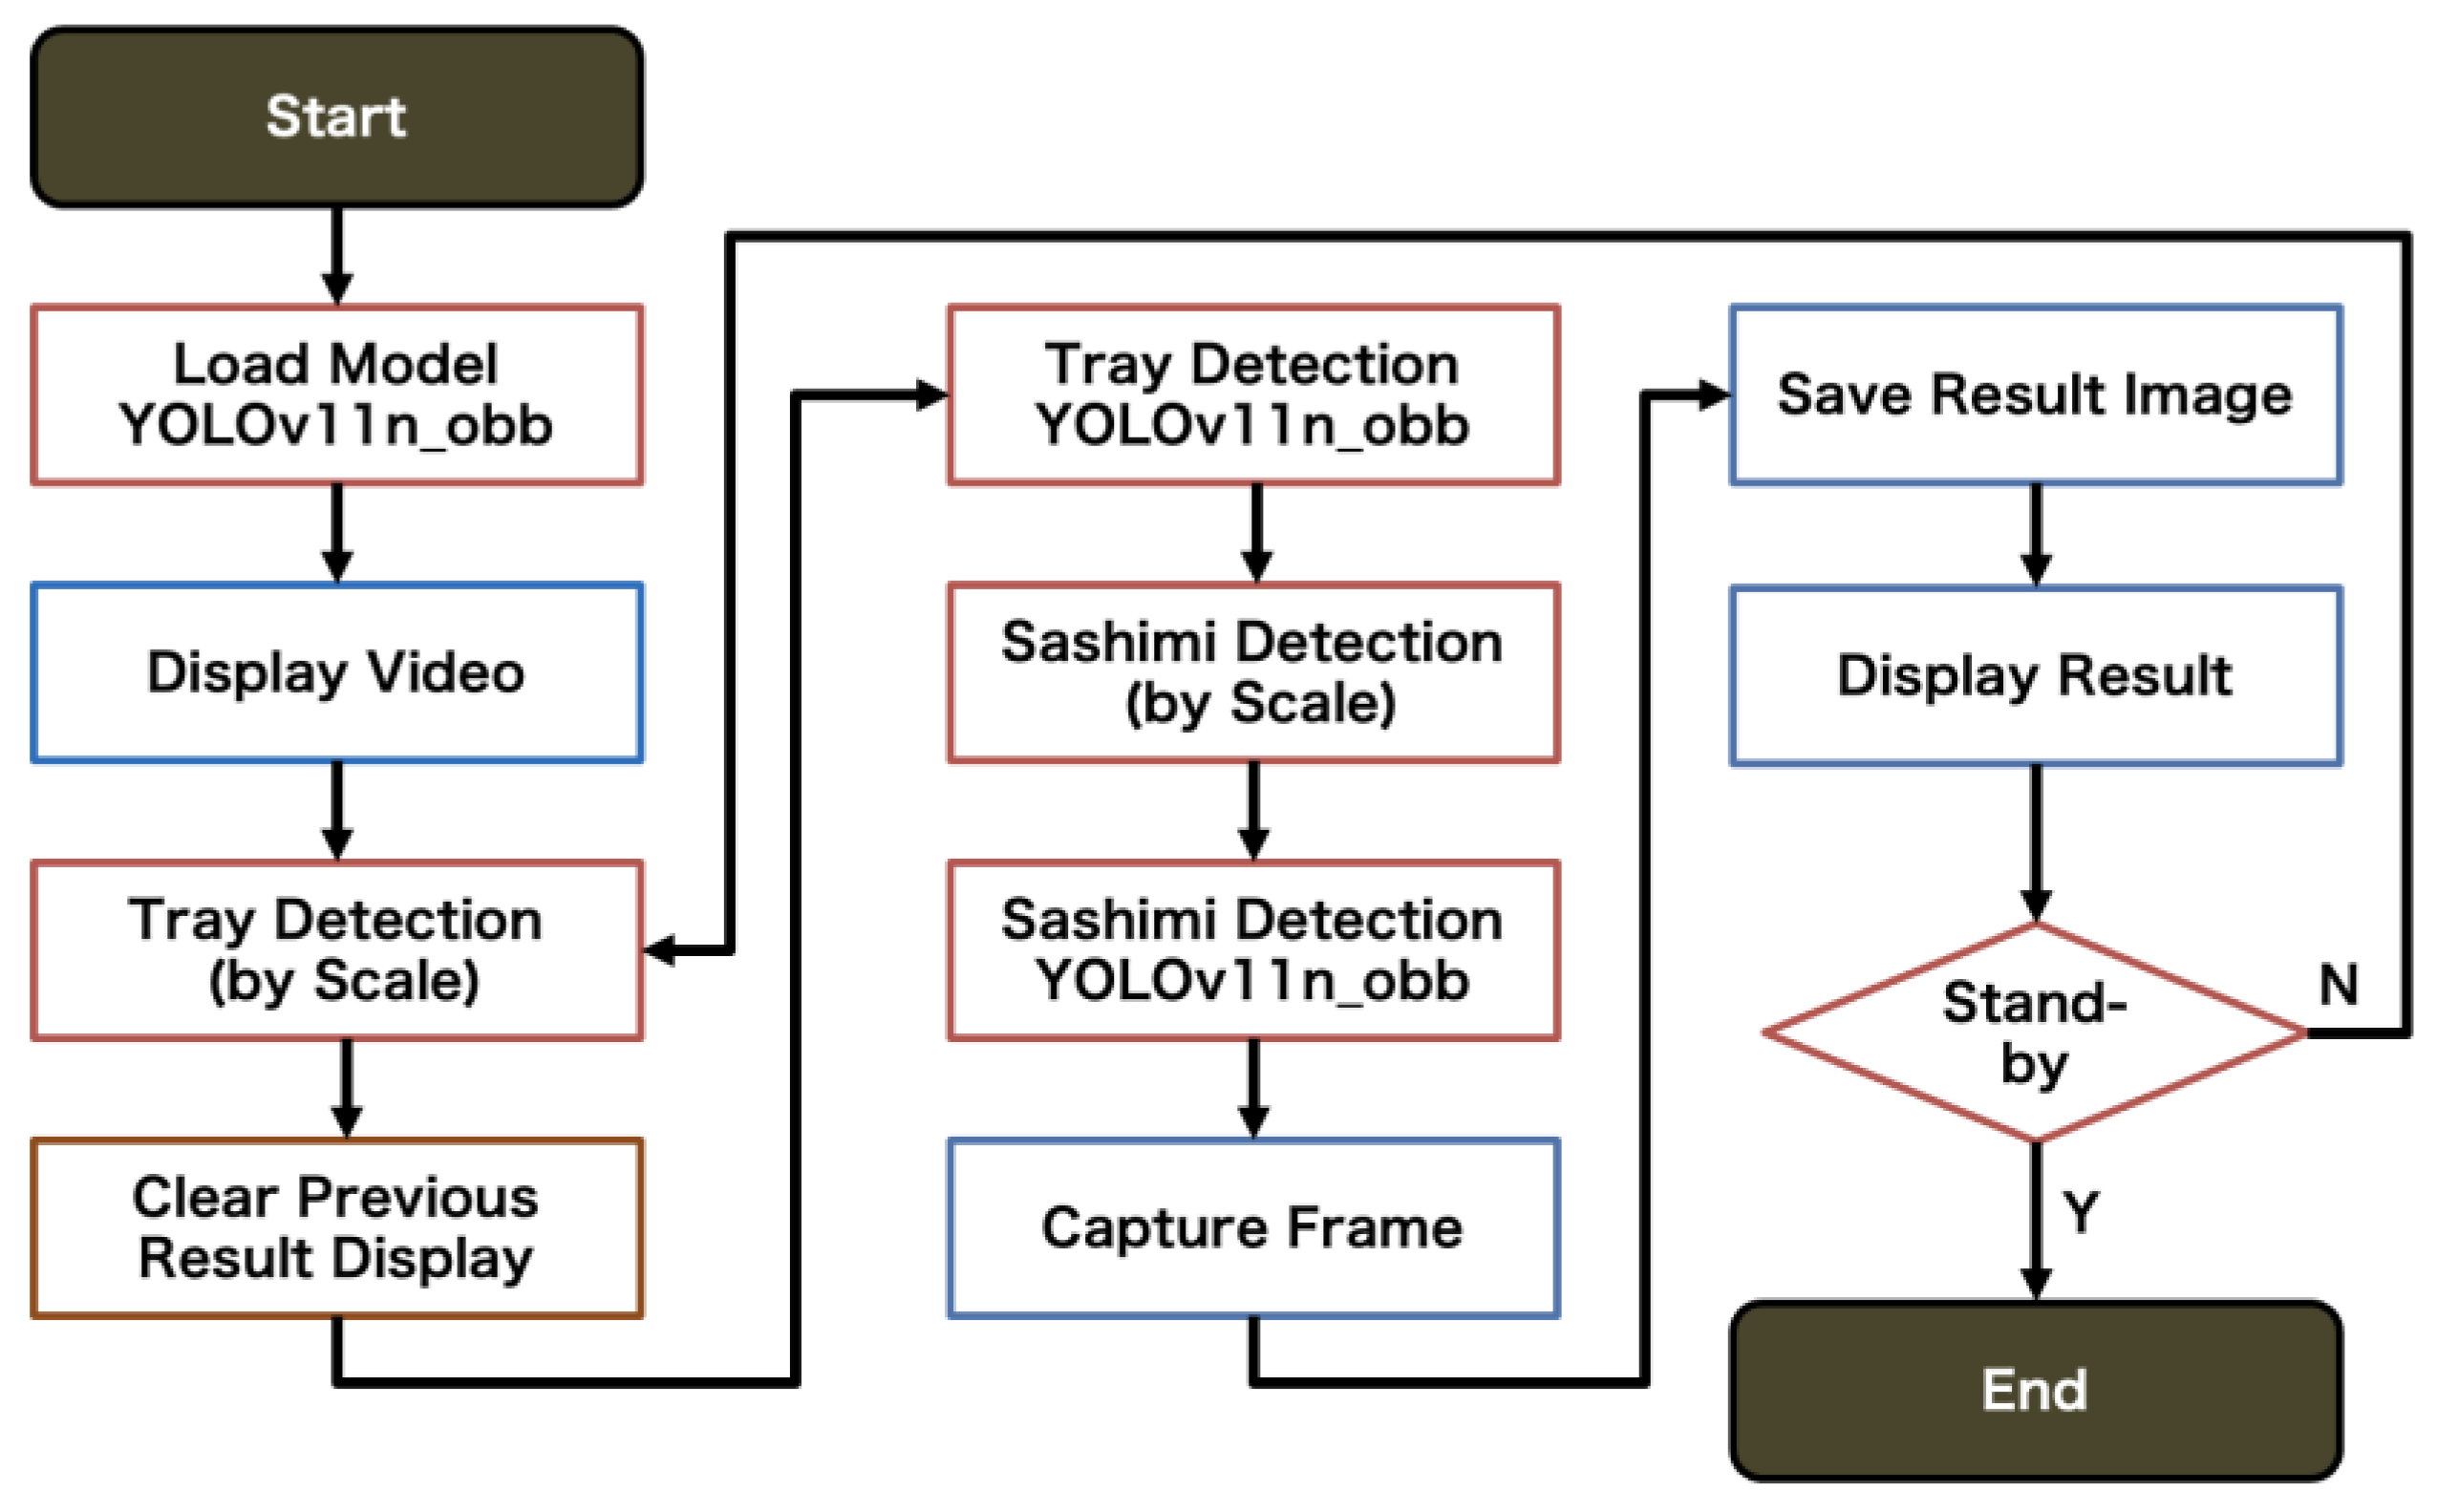
Figure 2 shows a diagram of the developed system. The system first loads a pre-trained YOLOv11n-obb model to perform object detection with oriented bounding boxes. This enables accurate recognition of sashimi pieces, even when they are placed at various angles on the tray.
Once initialized, the system activates a real-time video stream captured by a 1.0-megapixel USB mini camera. This live feed is displayed on the user interface, showing the tray and sashimi positioning in real time. A graphical user interface (GUI), PySimpleGUI, serves as the platform for displaying detection results and triggering user interactions. In this process, the system monitors the input from an electronic scale. When a tray is placed on the scale, the system identifies and locates the tray in the video frame. The detected tray corners serve as reference points for rotation correction, ensuring that size calculations remain accurate regardless of how the tray is physically positioned.
Following tray detection, the system awaits the placement of the sashimi pieces. A change in the weight on the scale indicates that sashimi has been added, and a second round of object detection is conducted using the YOLOv11n-obb model trained for identifying individual sashimi slices. The model provides bounding box coordinates and orientation angles to precisely determine the shape and layout of each slice. Once sashimi detection is completed, the system captures the video frame and saves it for further analysis. It then computes the size of each sashimi piece in millimeters by converting the pixel dimensions to measurement units. This calculation is conducted based on the known dimensions of the tray and the relative position and rotation of the detected sashimi slices. Using this method, the system identifies the width, height, and area of each piece. Alongside size analysis, the system incorporates weight data from the scale to evaluate whether each sashimi slice meets predefined quality standards. The judgment results are presented to the user via the GUI. Before being stopped, the system goes into standby mode, ready to process the next input. The automated workflow enables continuous, accurate, and efficient quality control in sashimi production, significantly reducing judgment errors and improving processing consistency in the factory environment.
4. Experimental Results
To evaluate the performance of the sashimi size detection system, two sets of experiments were conducted using different versions of the YOLO object detection models: YOLOv8n and YOLOv11n-obb. The detection accuracy in frozen seafood processing was measured, considering that factors such as overlapping sashimi slices and tray misalignment introduce significant challenges.
4.1. YOLOv8n Experiments
Experiments were conducted using the YOLOv8n model on a dataset comprising 328 high-resolution images (1920 × 1080 pixels). A total of 263 images were used for training, while 65 were reserved for validation. Although YOLOv8n offers fast inference speeds for real-time implementation, several limitations were observed in the detection accuracy. Two major issues affected the performance. First, overlapping sashimi pieces often led to detection failures. When all the sashimi pieces were placed on the tray before image capture, several pieces overlapped, making it difficult for the model to distinguish individual objects (
Figure 3a). Second, misalignment problems occurred when trays or sashimi slices were tilted during placement (
Figure 3a). Since YOLOv8n relies on axis-aligned bounding boxes, its ability to accurately detect rotated objects and calculate their dimensions was limited. These factors highlighted the need for the development of a more robust, orientation-aware model.
4.2. YOLOv11n-obb Experiments
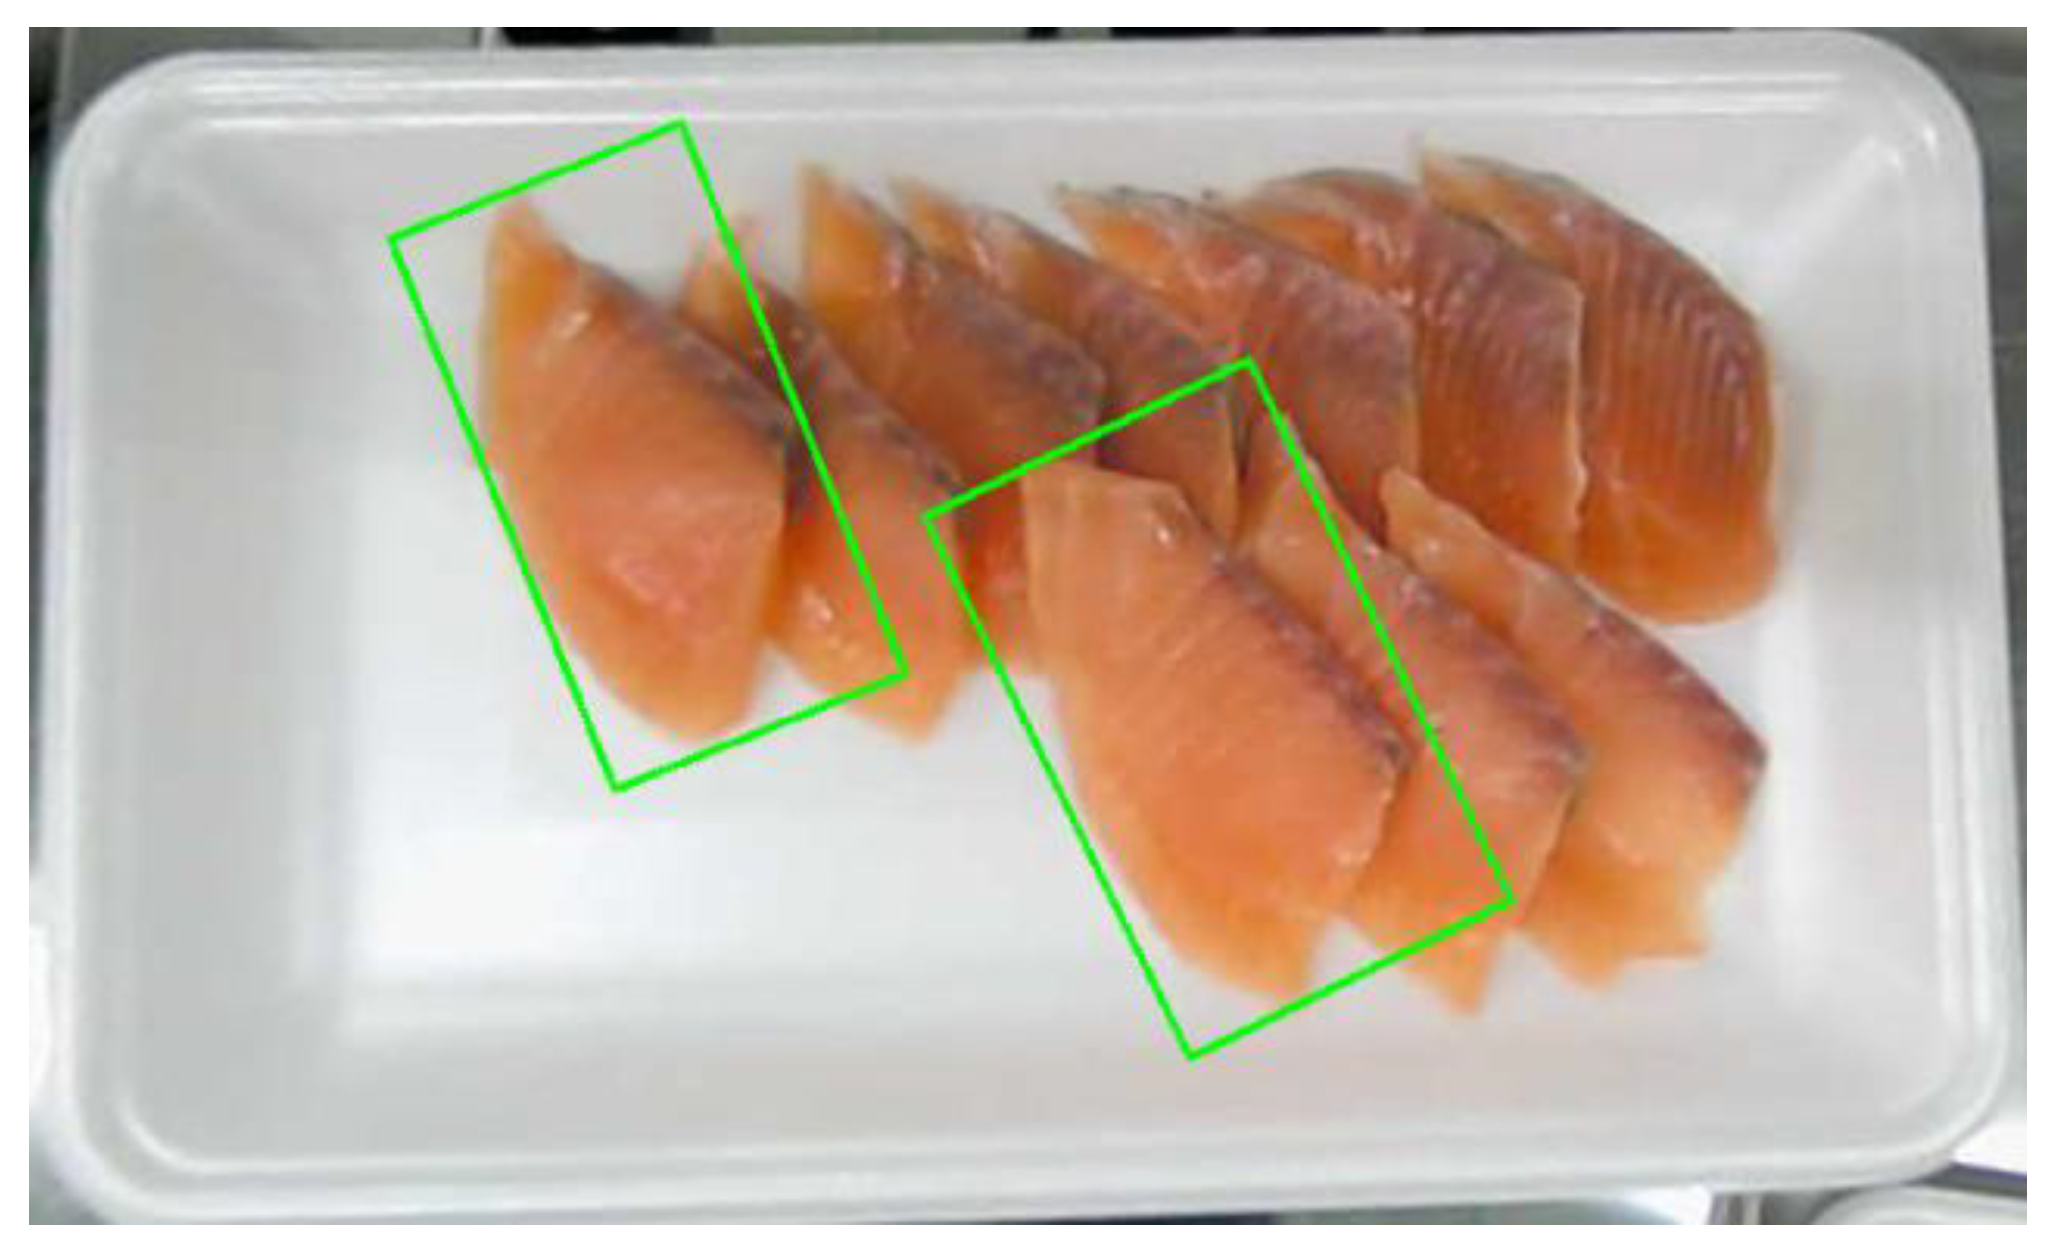
The second round of experiments was conducted using the advanced YOLOv11n-obb model, which supported oriented bounding box (OBB) detection. This version of the model recognized objects at arbitrary angles, a critical feature for accurately detecting sashimi slices that are not perfectly aligned on their trays. A total of 638 annotated images were used in this experiment, with 478 images assigned for training and 160 for validation. The dataset included four sashimi classes—tai, isaki, salmon, and hamachi—to test the model’s classification and size detection abilities. The system conducted tray cropping and rotation correction based on the tray’s corner positions. The orientation of the input image was normalized, enabling consistent detection results regardless of the tray placement. Significant improvements were achieved in the detection accuracy and stability compared with those of YOLOv8n. The YOLOv11n-obb model was effective in identifying individual sashimi pieces even when they overlapped or were rotated. The model accurately estimated the sashimi’s center position and angle by performing accurate width, height, and area calculations to assess the sashimi’s compliance with product specifications (
Figure 4).
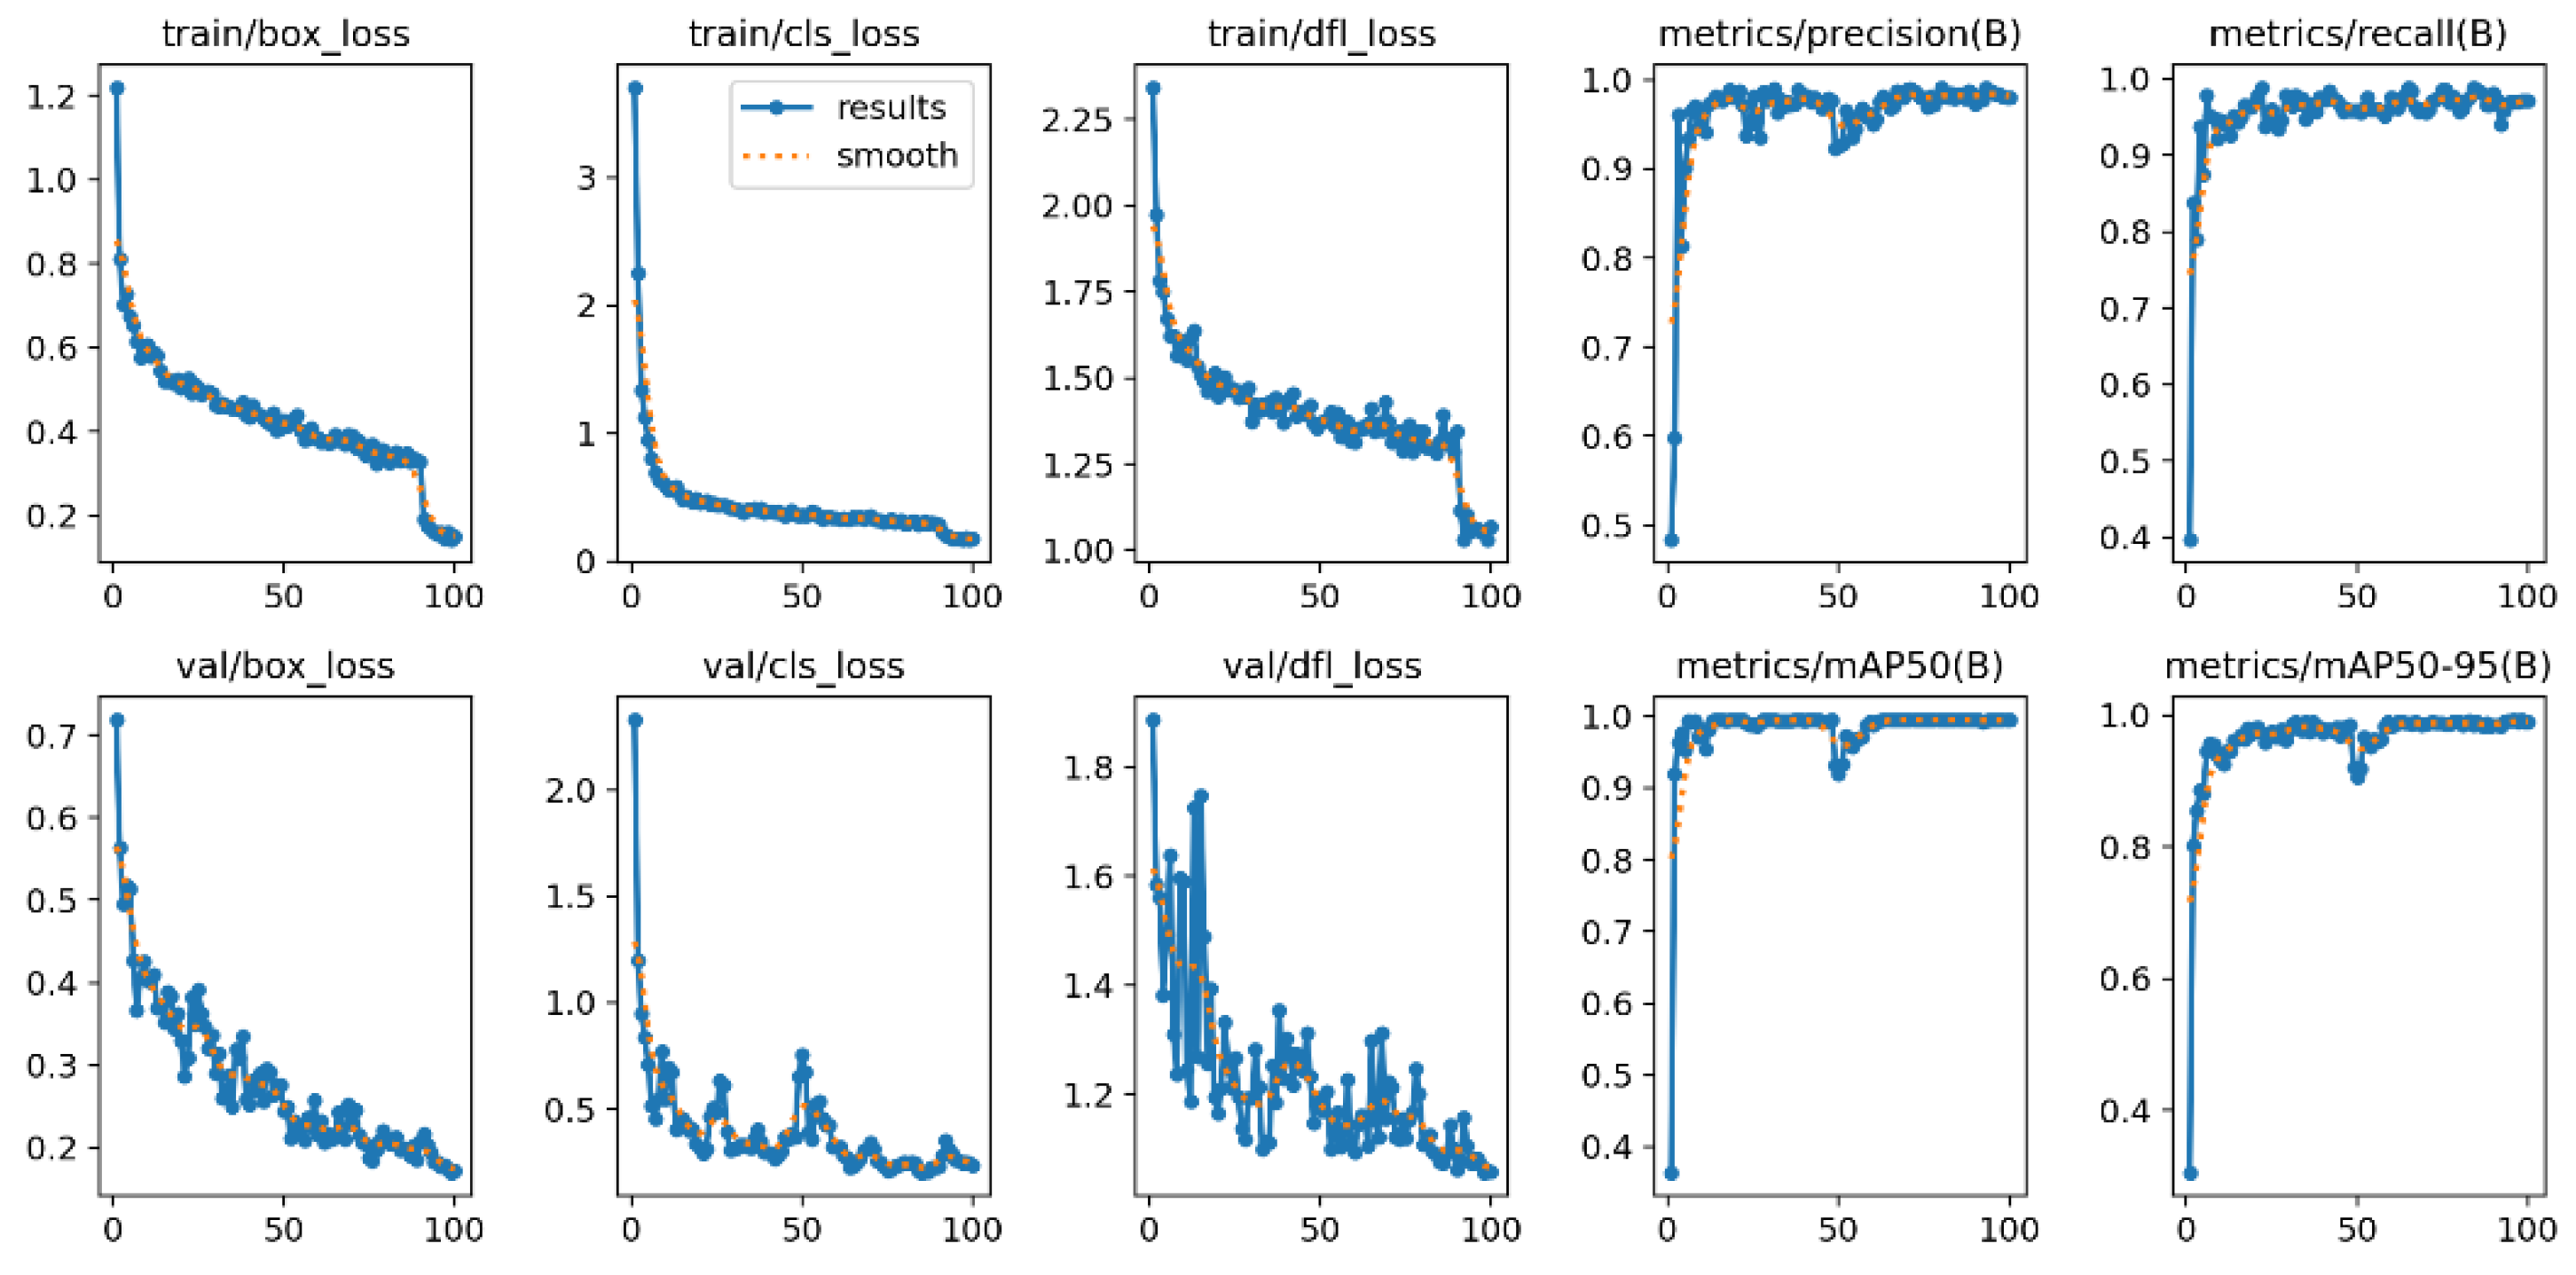
The performance of the sashimi size detection model using YOLOv11n-obb was evaluated for 100 epochs.
Figure 5 presents key metrics, including loss curves and evaluation scores (precision, recall, and mean average precision (mAP)), providing information on the convergence and detection ability of the model.
4.3. Losses in Training and Validation
The training box loss decreased from 1.2 to below 0.2, indicating improved bounding box localization accuracy. The validation box loss showed a similar trend, stabilizing at less than 0.3 after around 70 epochs, demonstrating generalization without overfitting. The classification loss dropped sharply in early epochs and stabilized at below 0.1 in both training and validation. This suggested that the model had effectively learned to differentiate between sashimi classes (e.g., tai, isaki, salmon, and hamachi). The distribution focal loss (DFL) reflects the quality of bounding box regression and prediction distribution and showed a steady decline and stabilization during training and validation. The DFL remained slightly higher during the validation than during training, indicating that there is room for further tuning, particularly in cases with overlapping or rotated sashimi.
4.4. Detection Performance
The precision plateaued at a high level (0.95) after 10 epochs, demonstrating the model’s strong ability to avoid false positives. This is critical in production environments where mislabeling a non-defective item could lead to unnecessary rework. The recall stabilized at around 0.90, indicating that the model successfully identified the majority of sashimi pieces present in the images, with minimal missed detections. The MAP at athreshold intersection over union (IoU) of 0.5 was 0.95, reflecting excellent object detection accuracy for sashimi pieces. The MAP at a threshold intersection over union (IoU) of 0.95 was 0.88, confirming robust detection across varying degrees of object overlap, occlusion, and rotation.
These results confirmed that the YOLOv11n-obb model effectively learned the spatial and class-based features necessary for high-precision sashimi detection, even in challenging visual conditions. The relatively stable and low validation loss curves, coupled with the high mAP and recall, suggested that the model generalized well without significant overfitting. The precision–recall balance ensured the system’s usability in real-time factory applications, where accuracy and reliability are paramount. However, minor fluctuations in the later-stage DFL and class loss suggested that additional augmentation, particularly for overlapping or edge-case samples, enhanced the model performance.
4.5. F1-Score
The
F1-score, which is the harmonic mean of the precision and recall, is a useful metric for measuring false positives and negatives. For the four-class sashimi detection (tai, isaki, salmon, and hamachi), the class-wise
F1-scores on the validation set were measured as shown in
Table 1. The results indicated that the model performed well across all the classes, with a slightly lower recall on isaki and tai, suggesting potential confusion between visually similar classes.
5. Conclusions
We developed an AI-based sashimi size detection system tailored for frozen seafood processing. The system was designed to address key challenges in manual quality control—namely, variations in the product size, orientation misalignment, and overlapping sashimi slices—by leveraging advanced computer vision techniques. The YOLOv11n-obb model supported the use of oriented bounding boxes, enabling accurate detection and measurement of sashimi pieces even when they were placed at arbitrary angles. Through the integration of object detection and weight-based evaluation, the system ensured that each sashimi slice complied with predefined quality standards. The experimental results demonstrated high detection accuracy, with a precision of 0.95, recall of 0.90, and mAP@0.5 exceeding 0.95. These metrics indicated the system’s effectiveness in real-world factory conditions, validating its potential for full-scale deployment in seafood processing lines. However, limitations in models such as YOLOv8n regarding their orientation sensitivity and overlapping object detection capabilities were identified. The custom-trained YOLOv11n-obb model, combined with tray rotation correction and mm per pixel conversion, was practical and robust. While the model performed well in detection, it is necessary to improve its class classification accuracy, especially for visually similar fish types such as tai and isaki, and expand the training dataset, refine the annotation granularity, and enhance duplicate detection filtering. The developed system can be used in automated packing lines and other quality inspection tasks in food production.


