Abstract
Amid expanding higher education and enhancing spatial quality, modern university campuses face challenges including inefficient space utilization and a disconnect from human-centered design. We developed a coupled model that integrates the analytic hierarchy process (AHP) with space syntax theory to identify and address functional fragmentation, limited accessibility, and diminished spatial vitality. The Delphi method was employed to determine weights on visual and traffic influence factors. Through spatial quantitative analysis using Depthmap software, we estimated spatial-efficiency discrepancies across 11 component types, including school gates, teaching buildings, and libraries. A case study was conducted at a university located in the hilly terrain of Conghua District, Guangzhou, China which revealed significant contradictions between subjective evaluations and objective data at components, such as the administrative building and gymnasium. These contradictions led to poor visual permeability, excessive path redundancy, and imbalanced functional layouts. Based on the results of this study, targeted optimization strategies were proposed, including permeable interface designs, path network reconfiguration, and the implementation of dynamic functional modules. These interventions were tailored to accommodate the humid subtropical climate, balancing shading, ventilation, and visual transparency. In this study, methodological support for the renovation of existing campus infrastructure was provided as theoretical and technical references for space renewal in tropical and subtropical academic environments and the enhancement of the quality and resilience of campus spaces. The results also broadened the application of interdisciplinary methods in university planning.
1. Introduction
The rapid expansion of higher education in recent years has presented significant challenges for campus spaces, particularly concerning land scarcity and the need for continuous functional updates. The integration of new and old campuses at many institutions has issues, including “spatial fragmentation,” “lost paths,” and the “decline of vital components” [1]. These manifest traffic congestion that diminishes accessibility to campus entrances, challenging terrain that isolates “spatial islands” between academic and residential areas, and the unidimensional function of traditional squares which leads to their underutilization [2]. These problems show a fundamental contradiction: the mismatch between industrialized campus planning and evolving humanistic needs. Current spatial production, driven by standardized functional zoning, cannot accommodate the diverse and flexible behavioral patterns of Generation Z students. Moreover, road designs prioritizing vehicular movement exclude pedestrians, while landscape aesthetics focused on grand visuals inadvertently weaken the emotional resonance of space.
There has been a pressing need for spatial renewal in universities amidst rapid urbanization. Modern campus environments have evolved beyond teaching containers into complex, multifaceted educational ecosystems. Yet, a persistent disconnect remains in current design models: specifically, between spatial organization and behavioral needs, visual design and cognitive rules, and outdated strategies and contemporary technical methods [3]. To address this, a coupling model of space syntax and analytic hierarchy process (AHP). The model elucidates the mechanism by which key campus components generate spatial efficiency and optimal pathways that align with the behavioral patterns and cognitive laws of faculty and students. Ultimately, we provide a scientific foundation for resolving the paradox where space growth does not equate to improved spatial efficiency.
The quality of campus space is paramount for fostering talent and academic innovation, especially when higher education’s current focus is qualitative development [4]. By enhancing the spatial efficiency of key components, the campus’s core functions can be enhanced. In the post-epidemic era, the design of flexible campus spaces particularly emphasizes visual integration and path reconstruction. Existing research on campus-space evaluation generally falls into two categories. Morphological quantitative analysis, utilizing space syntax, effectively examines topological relationships but often overlooks subjective perceptions. Conversely, qualitative research, based on post-use evaluations, excels at behavioral description but lacks systematic modeling. A limitation of existing studies is their predominant neglect of regional specificities, such as the three-dimensional spatial characteristics and climate factors.
2. Literature Review
AHP, developed by American operations researcher Saaty in the 1970s, offers a robust method for quantitatively analyzing complex decision-making problems [5]. Its principle involves constructing a hierarchical model and integrating expert judgment to derive quantitative insights. Initially applied in engineering management and economic decision-making, AHP has been applied to spatial planning research as the demand for multi-criteria evaluation in urban environments increases [6]. In campus planning, AHP can be employed for functional zoning and historical building assessment, effectively demonstrating the synergy between expert experience and quantitative data [7]. Space syntax, founded by Hillier and Hanson at University College London in 1984, enables analyzing the intricate relationship between spatial structure and social behavior through topological network models [8]. Space syntax evolved from the initial Axial Analysis to refined techniques such as segment analysis and visibility graph analysis (VGA), describing visual perception and path selection [9]. In campus-space research, space syntax has been used for analyzing the accessibility of learning corridors and visual aggregation, thereby revealing connections between spatial structure and utilization efficiency [10]. While Depthmap X software automates visualized space syntax analysis, its adaptability in complex three-dimensional spaces remains limited.
In higher education, the functional efficiency and spatial quality of campus environments directly influence the behavioral experiences and place identity of teachers and students. Early research primarily focused on the rationality of functional zoning and building layouts [11]. However, with advancements in behavioral science and environmental psychology, the emphasis on evaluation has shifted toward spatial perception and visual experience [12]. Specifically, the space syntax theory is used to quantify spatial connectivity, permeability, and accessibility using topological networks, supporting campus-space analysis. The application of indicators, such as visual integration, enables the correlation analysis between spatial structure and behavioral patterns [13].
Despite significant advancements, the integration of AHP and the space syntax theory presents challenges. Most existing studies utilize AHP and the space syntax theory as independent analytical tools, often lacking the integration of the two for objective verification and dynamic feedback [14,15]. This study aims to address this gap by proposing an innovative AHP–Space Syntax linkage model. This model is used to construct a campus component evaluation system in the dimensions of vision and transportation. The model combines Delphi method weights with Depthmap quantitative data and compares the weighted results with Depthmap’s quantitative outputs to propose optimization strategies.
3. Research Methods
We invited 15 experts to this study, comprising six urban and rural planners, four architectural designers, three space syntax specialists, and two campus managers. All experts possessed more than five years of practical experience in their areas. We conducted three rounds of back-to-back consultations using the Delphi method. During these rounds, the experts scored visual indicators based on their spatial perception experience and traffic indicators based on daily use frequency. We constructed the judgment matrix using Yaahp v12.12 software and processed the data using the geometric mean method. All results passed the consistency test (CR < 0.1). Following the expert consultation, a spatial influence evaluation system was developed using AHP. A seven-point Likert scale was adopted for detailed distinctions and nuanced judgments on complex spatial features, such as visual integration and line-of-sight occlusion. This detailed scoring was crucial for accurately reflecting the spatial situation. The seven-point scale also reduced the likelihood of neutral responses, prompting the experts to judge more rationally. When combined with AHP’s weights, the model accurately reflected the importance of indicators, thereby enhancing the explanatory power (Figure 1).
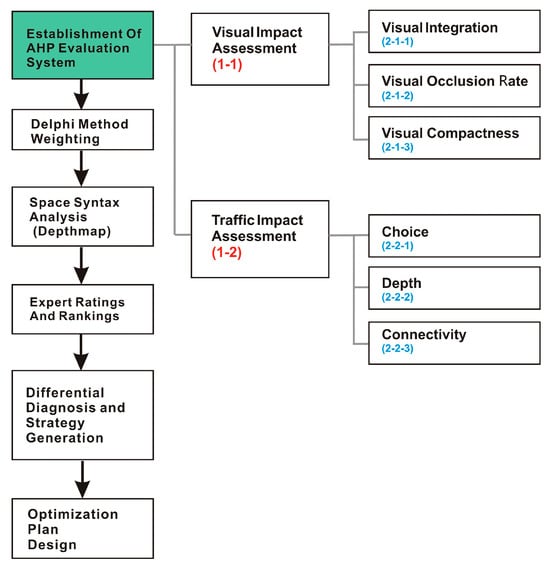
Figure 1.
Research method in this study.
We employed the following space syntax metrics to analyze the campus environment.
- Visual integration: This metric was used to quantify a viewpoint to connect the global visual network to visual accessibility and penetration efficiency. Areas with high visual integration serve as visual focal points, while low-value areas become spatial blind spots. Visual integration was used to identify the components of the campus, such as enclosed squares or obscured building entrances, that lack visual appeal, as shown in Figure 2a.
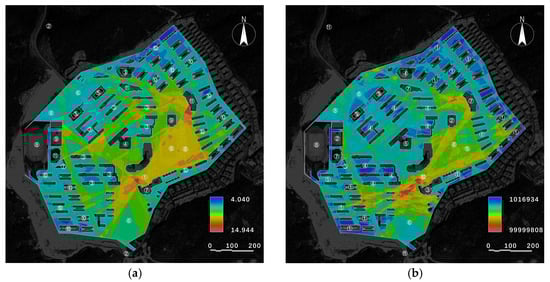
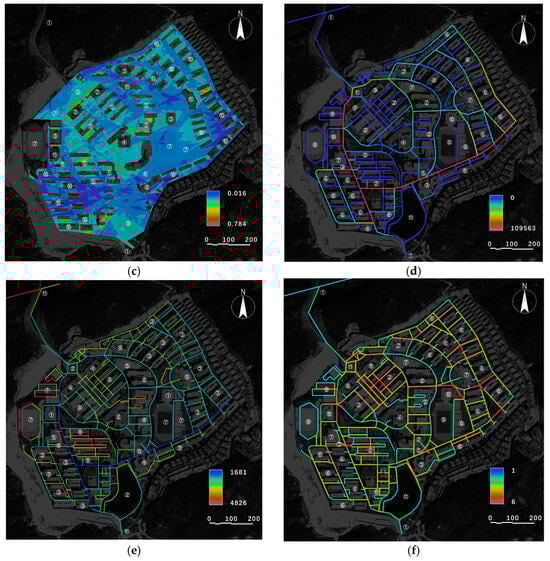 Figure 2. Visual display of Depthmap analysis results. These images show a gradient from red to blue to reflect the value. The numbers in these pictures indicate the ranking of the expert ratings mentioned in Table 2: (a) visual integration; (b) visual occlusion rate; (c) visual compactness; (d) choice; (e) depth; (f) connectivity.
 - Visual occlusion rate: This measures the proportion of visual lines blocked by physical obstacles within a specific area. The rate was calculated by determining the ratio of invisible areas to the whole visual field. This metric was used to identify campus areas with poor visual permeability, as shown in Figure 2b.
- Visual compactness: This describes the degree of spatial aggregation within a given viewpoint’s visible range. The sense of enclosure and the directionality of spatial perception were quantified by calculating the compactness of the visible area’s geometric shape. This metric is crucial for evaluating the visual orientation of the campus’s core components, as shown in Figure 2c.
- Choice: This metric represents the probability of a spatial component being traversed within the path network. Choice was used to quantify the likelihood of a path selected by pedestrians as the shortest route, reflecting its intermediary characteristics and the efficiency and fairness of traffic organization. Based on shortest path calculations in a topological network, high-choice values are obtained as a transportation hub. Choice was used to analyze the traffic efficiency of main roads and branch roads across the campus, as shown in Figure 2d.
- Depth: The depth value indicates the minimum number of steps required to reach other spaces from an origin, representing the number of topological transitions from an entrance to a target component. It reflects the complexity of spatial accessibility, where a lower value signifies higher accessibility. Depth was used to identify areas on campus with poor accessibility, as shown in Figure 2e.
- Connectivity: This refers to the number of components directly connected to a given component, reflecting the degree of spatial networking and permeability. Based on topological adjacency statistics, a high connectivity value indicates that the component is a transportation hub. Connectivity was used to evaluate the permeability between different functional areas on campus, as shown in Figure 2f.
4. Results

Table 1.
Evaluation weight of spatial influence evaluation model of key components on campus.
Table 2.
Expert rankings of campus components under level 2 impact factors (1–7 points).
4.1. Study Area
Guangzhou Nanfang University is located in Conghua District, Guangzhou, in the hilly area where the Nanling Mountains transition to the Pearl River Delta. The campus was built on the mountain, with an overall height difference of 48 m, forming a three-level terraced spatial structure. The university, situated in the Lingnan region, presents unique characteristics, notably its hot and humid summer climate and distinctive three-dimensional spatial organization. This setup deviates significantly from the common horizontal layouts of universities. The campus has prevalent spatial contradictions and subsequent accessibility fragmentation. Its unique topographic and climatic attributes offer an empirical setting for new methodologies and theoretical perspectives.
4.2. Administrative Building
The experts rated the visual impact of the administrative building. As shown in Figure 2a, Depthmap analysis results revealed low visual integration (5th), indicating insufficient visual penetration of this symbolic center of the spatial layout. This discrepancy was caused by (1) the presence of obstructing structures or significant terrain elevation differences around the building, (2) a lack of a visual hierarchy in the building’s facade design, and (3) weak visual connection with primary pedestrian flow paths. Similarly, as shown in Figure 2b, the experts perceived a low visual occlusion rate (9th), yet software detection yielded a high value. This discrepancy highlights a deviation between subjective cognition and objective data, potentially attributable to temporary shielding or seasonal vegetation changes in the square fronting the building.
4.3. Teaching Building
The experts ranked the visual impact of teaching buildings third, but Depthmap indicated low visual integration (Figure 2a). This suggests that their visual leadership role, as the core of teaching activities, was not fully realized. A scattered layout of teaching buildings diminished their visual agglomeration effect with the poor continuity of building interfaces. As shown in Figure 2d, the experts ranked choice high (2nd). However, measured values varied significantly, with the East District showing low values and the Central District exhibiting high values, reflecting an imbalance in path network efficiency. The imbalance was caused by (1) access restrictions in the East District, creating a pseudo-ring road network, and (2) a significant height difference between the entrance of the Central District’s teaching building and the main road.
4.4. Library
The experts ranked the library fourth in visual selectivity, but Depthmap revealed a low choice (Figure 2d). This suggests an inconsistency between its cultural symbolic status and its actual spatial guidance. The core cultural landmark was visually squeezed by surrounding buildings, failing to occupy a dominant visual position. Furthermore, as shown in Figure 2e, the expert ranked its accessibility 6th, while the measured depth value was high, indicating a contradiction between the topological network and actual perception. The contradiction was attributed to (1) the main path requiring diversion around a landscape water body, increasing the actual distance and creating a pseudo-shortcut, (2) the number of entrance steps exceeding 12, forming a psychological barrier, and (3) insufficient lighting at night, leading to decreased path usage.
4.5. Stadium
As shown in Figure 2a, the experts assigned a low visual integration ranking (9th), yet the Depthmap value was high. This indicates a disconnect between the stadium’s spatial topological advantage and actual perception. Although located at a path network hub, the stadium is physically isolated by walls/hedges, forming an “island.” As shown in Figure 2d, its choice was low (10th), while the measured value was high, indicating a structural contradiction within the path network. The main passage was forced to bypass the stadium, creating a false “choice” for pedestrians. Disordered intersections between sports and teaching circulation paths, leading to avoidance behavior. The experts rated accessibility as the worst, but the Depthmap value was low, suggesting a significant disparity between topological accessibility and experience. This was caused by entrance steps exceeding 1.2 m in height, creating a psychological barrier and a hidden location for supporting service facilities.
4.6. Gymnasium
As shown in Figure 2a, the experts ranked the gymnasium’s visual integration low (8th), while the measured value for the East District Gymnasium was high. This reflects a disconnection between visual perception and topological structure. A significant height difference was observed between the stadium and the surrounding road surface, creating a “visual cage” effect. The absence of a night lighting system led to poor visibility during certain periods.
4.7. Residence Hall
As shown in Figure 2a, the experts rated the visual integration of residence halls very low (10th), though the measured value was high. This indicates a conflict between spatial topological openness and functional privacy. The linear arrangement of residence halls along the main road created a visual corridor effect. Excessive distance between buildings resulted in overly high visual penetration. As shown in Figure 2c, visual compactness was ranked low (10th), while the measured value was too high, revealing an unbalanced spatial tension in the West and South District residence halls. This imbalance stemmed from high foot traffic that makes service facilities look like express delivery stations and convenience stores and over-standard parking areas for vehicles, leading to spatial congestion.
4.8. Dining Hall
The expert ranked the dining hall the lowest (11th), yet the measured value for the East District Dining Hall was relatively high (Figure 2a). This discrepancy reveals a significant deviation between spatial topological advantage and experience. The main body of the canteen was surrounded by trails, and its main entrance faced a secondary road, causing a cognitive dislocation of accessibility.
4.9. Commercial District
As shown in Figure 2a, the visual integration of the commercial district was ranked low (7th), but the measured value was high. This indicates a disconnect between spatial topological accessibility and functional recognition. The main entrance square, despite its 25 m diameter, lacked a central anchor point, leading to a failure of its spatial gravitational field.
4.10. Campus Gate
As shown in Figure 2a, the experts prioritized visual integration for the campus gate as high (second), but the measured value was low. This suggests that the topological advantage of the portal space has not translated into significant visual influence. The school gate axis was offset from the main road. The gatehouse was shaded by tree canopies on both sides of the road. Due to an ineffective lighting system, as shown in Figure 2c, the experts ranked visual compactness high (1st), but the measured value was too low, reflecting a lack of cohesion. An overly wide entrance square lacked a core focal point, and homogenized ground paving patterns were observed. There was excessively large spacing between landscape sketches. Furthermore, experts ranked “Choice” and “Connectivity” first, but the measured values were too low, revealing structural defects in traffic organization.
4.11. Square
As a central space for campus activities, the visual compactness of the square was ranked 6th (Figure 2c), but Depthmap results showed low compactness. This reflects a lack of visual cohesion within the square space. The homogenization of ground pavement led to insufficient visual tension and a break in the spatial hierarchy. Excessive surrounding building interfaces resulted in a loss of enclosure.
4.12. Landscape Zone
As an area of high ecological value, as shown in Figure 2c, the campus lake showed a low visual compactness ranking (9th). This indicates excessive intervention of artificial facilities in the natural landscape. The measured values of choice and connectivity were too high, indicating the impact of the transportation network on the ecosystem.
Based on the results, optimization strategies are proposed as follows.
- Visual guidance: implement sequential landscape elements, such as tree arrays and lamp posts, along the main road leading to the administrative building to create a clear visual guidance axis.
- Visual penetration: reduce the height of surrounding walls or replace them with open fences, and remove view-obstructing bushes while retaining tall trees.
- Facade recognition: utilize night lighting systems to emphasize building outlines, add the school logo to the roof, and employ contrasting color materials to highlight main entrances.
- Visual corridor: demarcate a 50 m radius visual protection zone centered on the administrative building, prohibiting new physical structures within this area.
- Spatial organization: relocate non-motorized vehicle parking to side roads and implement dynamic greening management by selectively thinning surrounding trees and replacing bottom vegetation with low perennial flowers.
- Signage system: install a dynamic light strip device at the highest point of buildings to create visible landmarks at night.
- Ecological buffer zones: plant deciduous trees along building perimeters to provide seasonal light and shadow filtering, thus creating a visual sense of hierarchy.
5. Conclusions
Existing problems within campus spaces were examined to propose optimization strategies tailored to different component characteristics of the university campus. By integrating AHP with Depthmap analysis, subjective expectations, and objective defects through spatial reconstruction were explored. Mismatches between function and space were optimized and improved to balance between closed management and open space. The dynamic balance design method of this study ensures safety and vitality. By integrating methods and leveraging technological innovation, the single-dimensional limitations of traditional campus-space evaluation can be addressed. The developed AHP–Space Syntax model in this study accurately identified spatial contradictions through weight allocation and data cross-validation, providing a theoretical basis for the transformation and upgrading of university campus environments.
Author Contributions
Conceptualization, Y.S.; methodology, Y.S.; software, Y.S. and Y.O.; validation, Y.S. and Y.O.; formal analysis, Y.S. and Y.O.; investigation, Y.S. and Y.O.; resources, Y.S.; data curation, Y.S. and Y.O.; writing—original draft preparation, Y.S.; writing—review and editing, Y.S.; visualization, Y.S.; supervision, Y.S.; project administration, Y.O. All authors have read and agreed to the published version of the manuscript.
Funding
This research received no external funding.
Institutional Review Board Statement
Not applicable.
Informed Consent Statement
Not applicable.
Data Availability Statement
Data are contained within the article. The content of the present article reflects solely the authors’ view.
Conflicts of Interest
The authors declare no conflicts of interest.
References
- Popoola, S.I.; Atayero, A.A.; Popoola, O.A. Comparative assessment of data obtained using empirical models for path loss predictions in a university campus environment. Data Brief. 2018, 18, 380–393. [Google Scholar] [CrossRef] [PubMed]
- Hajrasouliha, A.H. Master-planning the American campus: Goals, actions, and design strategies. Urban Des Int. 2017, 22, 363–381. [Google Scholar] [CrossRef]
- Ye, X.; Mansury, Y. Behavior-driven agent-based models of spatial systems. Ann. Reg. Sci. 2016, 57, 271–274. [Google Scholar] [CrossRef][Green Version]
- Cheng, J.; Yan, C. The Construction of High-quality Campus Learning Spaces: A Life-world Perspective. J. East China Norm. Univ. (Educ. Sci.) 2024, 42, 51–60. [Google Scholar]
- Saaty, R.W. The analytic hierarchy process—What it is and how it is used. Math. Model. 1987, 9, 161–176. [Google Scholar] [CrossRef]
- Ishizaka, A.; Labib, A. Review of the main developments in the analytic hierarchy process. Expert Syst. Appl. 2011, 38, 14336–14345. [Google Scholar] [CrossRef]
- Liu, Y. Evaluation of University Campus Landscape Based on AHP: A Case Study of Southwest University of Science and Technology. Open Access Libr. J. 2021, 8, 1–11. [Google Scholar] [CrossRef]
- Hillier, B.; Hanson, J. The Social Logic of Space; Cambridge University Press: Cambridge, UK, 1984. [Google Scholar]
- Xiao, Y. Space Syntax Methodology Review. Urban Morphology and Housing Market. Springer Geography; Springer: Singapore, 2017. [Google Scholar]
- Yaylali-Yildiz, B.; Spierings, B.; Çil, E. The spatial configuration and publicness of the university campus: Interaction, discovery, and display on De Uithof in Utrecht. Urban Des. Int. 2022, 27, 80–94. [Google Scholar] [CrossRef]
- Tomko, M.; Winter, S. Describing the functional spatial structure of urban environments. Comput. Environ. Urban Syst. 2013, 41, 177–187. [Google Scholar] [CrossRef]
- Zhou, Y.; Wang, Y.; Jin, H. Research on the restorative benefits of campus green space under visual and olfactory perception. Chin. Gard. 2023, 39, 36–41. [Google Scholar]
- Wang, T.; Sun, S.; Liu, N.; Chen, Y.; Zheng, L. Quantifying University Campus Imagery: A Social Survey of Three University Campuses in China based on Internet Image Data. In Proceedings of the 2024 International Conference on Digital Society and Artificial Intelligence, Qingdao, China, 24–26 May 2024; pp. 441–450. [Google Scholar]
- Zhang, X.; Song, J.; Peng, J.; Wu, J. Landslides-oriented urban disaster resilience assessment—A case study in Shenzhen, China. Sci. Total Environ. 2019, 661, 95–106. [Google Scholar] [CrossRef] [PubMed]
- Li, J.; Lu, Y. Research on campus spatial structure based on Depthmap. Urban Archit. 2025, 22, 34–38. [Google Scholar]


Disclaimer/Publisher’s Note: The statements, opinions and data contained in all publications are solely those of the individual author(s) and contributor(s) and not of MDPI and/or the editor(s). MDPI and/or the editor(s) disclaim responsibility for any injury to people or property resulting from any ideas, methods, instructions or products referred to in the content. |
© 2025 by the authors. Licensee MDPI, Basel, Switzerland. This article is an open access article distributed under the terms and conditions of the Creative Commons Attribution (CC BY) license (https://creativecommons.org/licenses/by/4.0/).