Proceeding Paper

Advanced Machine Learning Method for Watermelon Identification and Yield Estimation †

1
Department of Information Technology and Management, Tzu Chi University, Hualien City 970374, Taiwan
2
General Education Center, Tzu Chi University, Hualien City 970374, Taiwan
*
Author to whom correspondence should be addressed.
Presented at the 2025 IEEE 5th International Conference on Electronic Communications, Internet of Things and Big Data, New Taipei, Taiwan, 25–27 April 2025.
Eng. Proc. 2025, 108(1), 10; https://doi.org/10.3390/engproc2025108010
Published: 1 September 2025

Abstract

Watermelon is a popular fruit, predominantly cultivated in Asian countries. However, the production and harvesting processes present several challenges. Due to its size and weight, manually harvesting watermelons is labor-intensive and costly. In the future, technology is expected to enable robots to harvest watermelons. Therefore, it becomes essential to introduce intelligent systems to effectively identify and locate watermelons in harvesting. This research aims to develop an advanced methodology for watermelon identification and location using You Look Only Once (YOLO)v8 and YOLOv8-oriented bounding box (OBB) algorithms. Furthermore, the simple online and real-time tracking (SORT) algorithm was employed to track and count watermelons and estimate yield. The performance of YOLOv8-OBB was better than that of YOLOv8 and the highest precision (0.938) was achieved by YOLOv8s-OBB. Additionally, the size of each watermelon was measured with both models. The models help farmers find the optimal watermelons for harvest.

1. Introduction

Artificial intelligence (AI) is widely applied across medical to agricultural industries as it helps with routine tasks, making life easier. Besides this, AI in agriculture helps farmers harvest efficiently. Watermelon is a popular fruit that is mostly grown in Asian countries. This fruit is heavier than other fruits; therefore, there are challenges in watermelon production, harvesting, and yield estimation. Moreover, the choice of well-ripe watermelon is also challenging. Traditional methods for harvesting watermelon require much labor and accurate quality determination is a challenge for the methods.
Therefore, it is important to develop advanced AI methods for automatic watermelon detection to enhance operational efficiency, yield estimation, and quality determination. Integrating AI with machine learning algorithms enables a sophisticated approach to improve object detection and facilitate the extraction of crucial features, such as the shape, size, and color of watermelons. Several advanced machine learning algorithms are employed for these tasks, including convolutional neural networks (CNN), support vector machines (SVM), and k-means clustering based on image processing for watermelon disease classification [1,2]. Each algorithm presents unique strengths.
SVM is effective for classification tasks, CNN excels in image recognition and feature extraction, and k-means clustering is useful for grouping similar objects based on their attributes. Nazulan et al. used machine learning algorithms to assess watermelon sweetness levels, addressing the challenges of manual inspection, such as labor intensiveness and inconsistency. They applied image processing methods to analyze rind color and indicators of sweetness. By employing machine learning algorithms, they automated sweetness detection and improved efficiency and consistency in agricultural quality assessment [3].
Yield estimation is important in watermelon harvesting. Accurate yield estimation enables farmers to access available yields for their retailers. Manual counting is used for watermelon. The determination of watermelon maturity level using image processing techniques has shown reliable and consistent results compared with the manual method [4]. An intelligent mobile application was developed to detect watermelon taste noninvasively. Smartphones were used to record sound and images aimed to help experts. This data was processed in the cloud using fast Fourier transform (FFT) and image analysis. Taste indices were then sent back to users [4].
A questionnaire on sweetness, pulp color, and water content aided in building a taste sample database for machine learning algorithms and an artificial neural network [5]. R-CNN, a deep learning approach for watermelon recognition using cross-scanning, enhanced accuracy and lowered the error rate of recognition. Their method showed a 99% accuracy in yield estimation by reducing the missing number of watermelons, meeting the requirement of the farmer [6]. They introduced an advanced method for recognizing and estimating watermelon yields using aerial images using mathematical morphology with a naïve Bayesian classifier. The method addressed the challenges in complex field environments by removing background noise from canvas, vines, and smaller watermelons. Their results demonstrated efficiency in agricultural yield estimation using automated image analysis.
You Only Look Once (YOLO) is a popular algorithm used to detect objects. YOLO algorithms were used for watermelon detection, enabling accurate yield estimation and quality determination. A real-time visual location system was developed for identifying picking points in strawberry harvesting, enhancing efficiency and accuracy, and resulting in a success rate of 84.35% [7]. For accurate detection and yield estimation, counting fruit plays an important role. Gao et al. employed a video-tracking system to detect and count fruits by correlating similar targets in video frames [8]. Wang et al. developed a system for fruit counting for mangoes utilizing a Kalman filter, which resulted in an R2 of 0.88 [9]. However, the variable time dynamic count model (VTDCM) requires high computational demands and relies on accurate fruit detection. Therefore, tracking watermelons is difficult because of their size and field markers [8,10].
YOLO is a new method for watermelon detection as it identifies small objects in a wide area using panorama stitching and overlap partitioning [11]. The panorama stitching and overlap partitioning-based detection and counting method (PSO-PDCM) was compared with the VTDCM method. Jiang et al. developed an unmanned aerial vehicle (UAV)-based system to detect and count watermelons with YOLOv8 and enhance detection accuracy in agriculture. They combined PSOPDCM with deep learning methods in three stages: generation of panoramic images, detection, and counting of watermelons. Their YOLOv8s model achieved an accuracy of 99.20% and the PSOPDCM model achieved 96%, being an improved method compared with VTDCM [12].
This present research aims to develop an advanced method for watermelon identification and location using YOLOv8 to detect, track, and count watermelons. We created and trained a YOLOv8 model to accurately detect watermelons and estimate crop yield by counting individual watermelons. The sizes of watermelons were estimated by using YOLOv8 and YOLOv8-OBB to determine the accuracy of the size estimation process.

2. Method and Material

2.1. Dataset

In this research, we used a dataset collected from Shoufeng Township, which is located in Hualien City on the eastern coast of Taiwan. This dataset consists of 292 images. We split them into three groups to facilitate the following analysis. A total of 205 images were assigned to training, 59 to validation, and 29 to testing datasets. To efficiently label the images and assign them to these groups, we utilized a user-friendly tool called Roboflow. The images were captured with a drone equipped with a DJI FC8482 camera, which features an aperture of ƒ/1.7, a shutter speed of 1/4000 s, a focal length of 6.72 mm, and an International Organization for Standardization (ISO) setting of 110. This combination of specifications enabled high-quality images. After labeling was completed, we resized all images to a standard resolution of 1024 × 768 pixels to ensure consistency across the dataset.

2.2. YOLOv8 Model

YOLOv8 offers significant improvements in both precision and speed compared with its predecessors, making it an excellent choice for real-world applications. The model has several versions, including YOLOv8n, YOLOv8s, YOLOv8m, YOLOv8l, and YOLOv8x. Each was designed to suit different levels of hardware capability and application needs. YOLOv8 introduces improvements over earlier YOLO versions. For instance, it uses an anchor-free design, enhanced feature aggregation, and an updated loss function to improve detection results. It also supports image segmentation and classification, making it highly versatile for different computer vision problems.
In this study, we utilized the YOLOv8n (Nano) which is the smallest and most lightweight variant of the YOLOv8 https://github.com/ultralytics/ultralytics (accessed on 15 November 2024). This model contains approximately 3.7 million parameters for object detection. The model is fast and enhances accuracy as it is light and appropriate with limited computational resources. YOLOv8n achieves real-time inference speeds, often exceeding 30 frames per second (FPS) on typical hardware setups, particularly for graphics processing unit (GPU) usage.

2.3. Equations

The backbone of YOLOv8n extracts features from the input image. It uses a cross-stage partial network (CSPNet), a modified version of efficient convolutional architectures, minimizing computations without sacrificing performance. Feature extraction blocks use the sigmoid linear unit function (SiLU) which is defined as follows.
S i L U = x . a x = x 1 + e x ,
Equation (1) improves the model’s performance by improving gradient flow during the training process. The YOLOv8n model is a pre-trained model with various image datasets and network weights to detect relevant features from an image. The pre-trained YOLOv8n was trained using the watermelon dataset in this study, which included 292 images and 205 text files containing the coordinates of the bounding box in each picture.

2.4. YOLOv8-OBB

The introduction of the OB model in YOLOv8 represents an advancement in object detection, particularly for handling angled or rotated objects. Traditional bounding boxes struggle to accurately enclose objects that are not aligned with the axes, resulting in reduced detection accuracy. In contrast, the OBB feature allows YOLOv8 to better fit its boxes around objects in various orientations, enhancing precision in detection tasks. This capability is beneficial in applications, such as aerial imagery, where objects are captured from oblique angles, and in text detection in diverse orientations. By minimizing background noise and providing tighter bounding volumes, the OBB model of YOLOv8 significantly improves the model’s performance for diverse research and real-world applications.
The leaky rectified linear unit (LeakyReLU) activation function is commonly used for YOLOv8-OBB.
f x i = x i i f   x i 0 a i x i i f   x i < 0   ,
where ai is a constant factor (typically set to 0.01). This function allows a small, non-zero gradient ai when the input is negative, promoting better learning dynamics. In this study, the pre-trained model of YOLOv8-OBB was used to train the same dataset and YOLOv8n. Both models were employed to compare the results.

2.5. Method

The watermelon dataset was obtained from the Google Collaboratory with Ultralytics version 8.3.53 with the runtime set to T4 GPU. The YOLOv8n model was trained for 20 epochs with a batch size of 16 and an initial learning rate of 0.01. Google Collaboratory integrated with Google Cloud was used to save the watermelon dataset for training the model. The weights were saved in the cloud server. YOLOv8m, YOLOv8l, YOLOv8s, and YOLOv8x were used to identify the best-performing model. The 20-epoch training was completed in 8 min. To evaluate each model’s performance, we compared their mean average precision (mAP) at the intersection over union (IoU) and precision.
The mAP score is the average precision across the classes, providing a single-valued score that presents the quality of predictions made by the model.
m A P = 1 N i = 1 N A P i ,
where N is the number of classes and APi is the average precision for each class i. IoU is defined as the ratio of the area of overlap between the predicted bounding box and the ground truth bounding box to the area of their union.
I o U = A r e a   o f   o v e r l a p A r e a   o f   U n i o n ,
where the area of overlap (AoU) is the area between the predicted bounding box and the ground truth bounding box. AoU is the total area covered by both predicted and ground truth bounding boxes. Precision is the accuracy of positive predictions, i.e., it measures how many of the predicted positive predictions are positive.
P r e c i s i o n = T r u e   P o s i t i v e ( T P ) T r u e   P o s i t i v e ( T P ) + F a l s e   P o s i t i v e ( F P ) ,
where TP means true positive and FP is false positive.
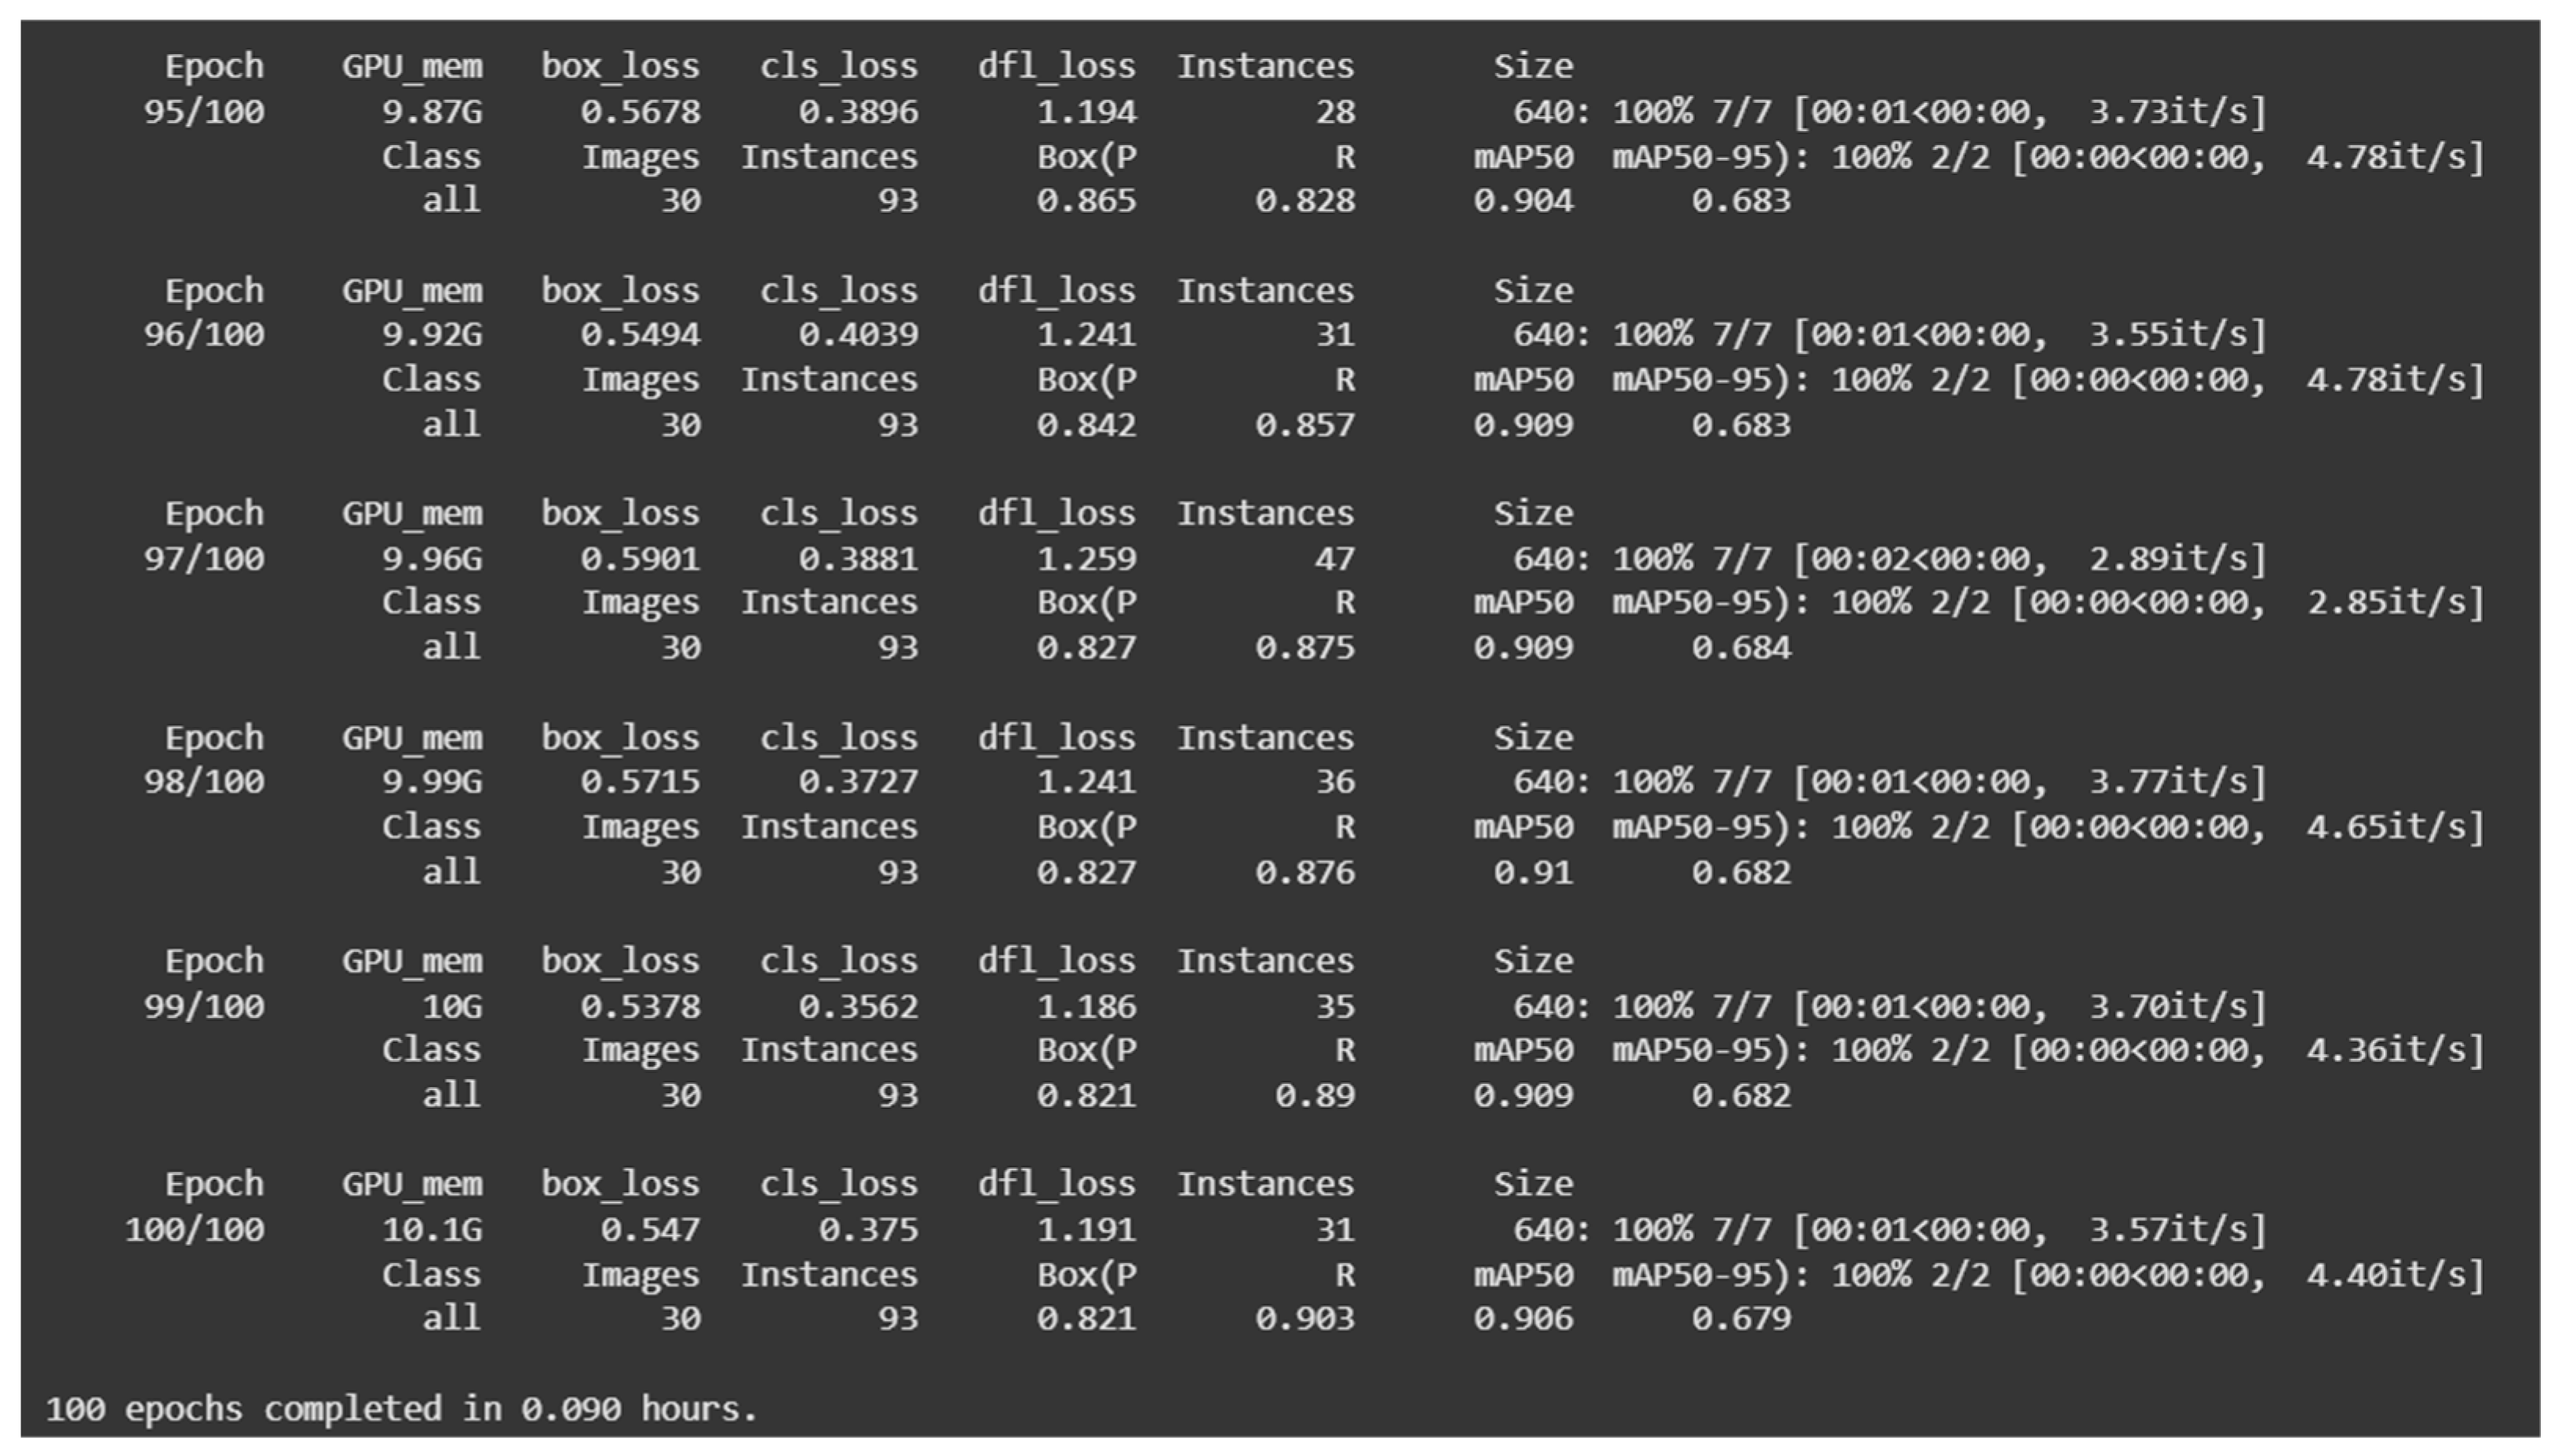
Figure 1 shows the training log of YOLOv8n, showing the progress and performance metrics over epochs. Key metrics include box_loss and cls_loss, which measure the accuracy of predicted bounding boxes and classification performance. The dfl_loss focuses on challenging classes, while mAP50 and mAP50–95 represent the model’s mean average precision at various IoU thresholds (0.5 and 0.5–0.95, respectively). The log shows GPU memory usage and the number of instances and images processed per epoch. As training progresses, the decreasing loss values and improving mAP scores suggest that the model is effectively learning the underlying patterns in the dataset. Batch sizes and processing times are provided to present the efficiency of the training process.
The trained model was used to develop a system for detecting, tracking, and counting the number of watermelons from the input images and videos. The trained model was combined with a simple online and real-time tracking (SORT) algorithm for watermelon monitoring. A video was captured from the same field where the image dataset was collected. To detect, count, and track the number of watermelons, an open-source computer vision (OpenCV) library was used to read the video files. The resolution of the video was set to 1280 × 746 pixels to assist in timing calculations. The model path was specified using the YOLO class obtained from the Ultralytics library.
The SORT tracker was initialized to maintain the identity of detected objects across multiple frames. The tracker was configured with parameters such as maximum age, minimum hits, and IoU threshold. A horizontal line was defined in the frame to serve as a counting line. The coordinates of the line were established as [0, 550, 1920, 550], indicating the x and y coordinates for the start and end of the line. To set up video output, a “VideoWriter” object was created to save the output video with tracking and counting overlays. The output video was configured to use the motion JPEG (MJPG) codec at 10 FPS. The frame captured from the video was resized to match the predefined dimensions and the YOLOv8n model was executed to detect watermelon in the resized frame, generating the bounding boxes along with confidence scores specified above 0.3. For each tracked watermelon, the bounding box was set by calculating the center point. The SORT tracker was updated to maintain identities across frames. The dimensions of each bounding box were captured and converted from pixels to centimeters (cm) by using a predefined pixel–per-centimeter ratio (7.88).
Counting logic was implemented to check if the center coordinates of detected watermelons intersect with the counting line. If so, the number of watermelons was counted, and a unique identification (ID) was assigned to each watermelon. A visual indication was assigned by changing the color of the counting line. The total count of watermelons was displayed in the top left corner, with the ID number and confidence score shown on each bounding box. This methodology resulted in a functional system that efficiently detects, tracks, and counts watermelons in video footage, while exporting the results for further analysis. After processing all frames, the details of the counted watermelons were compiled into a pandas DataFrame and exported to an Excel file (Microsoft Excel 2016).
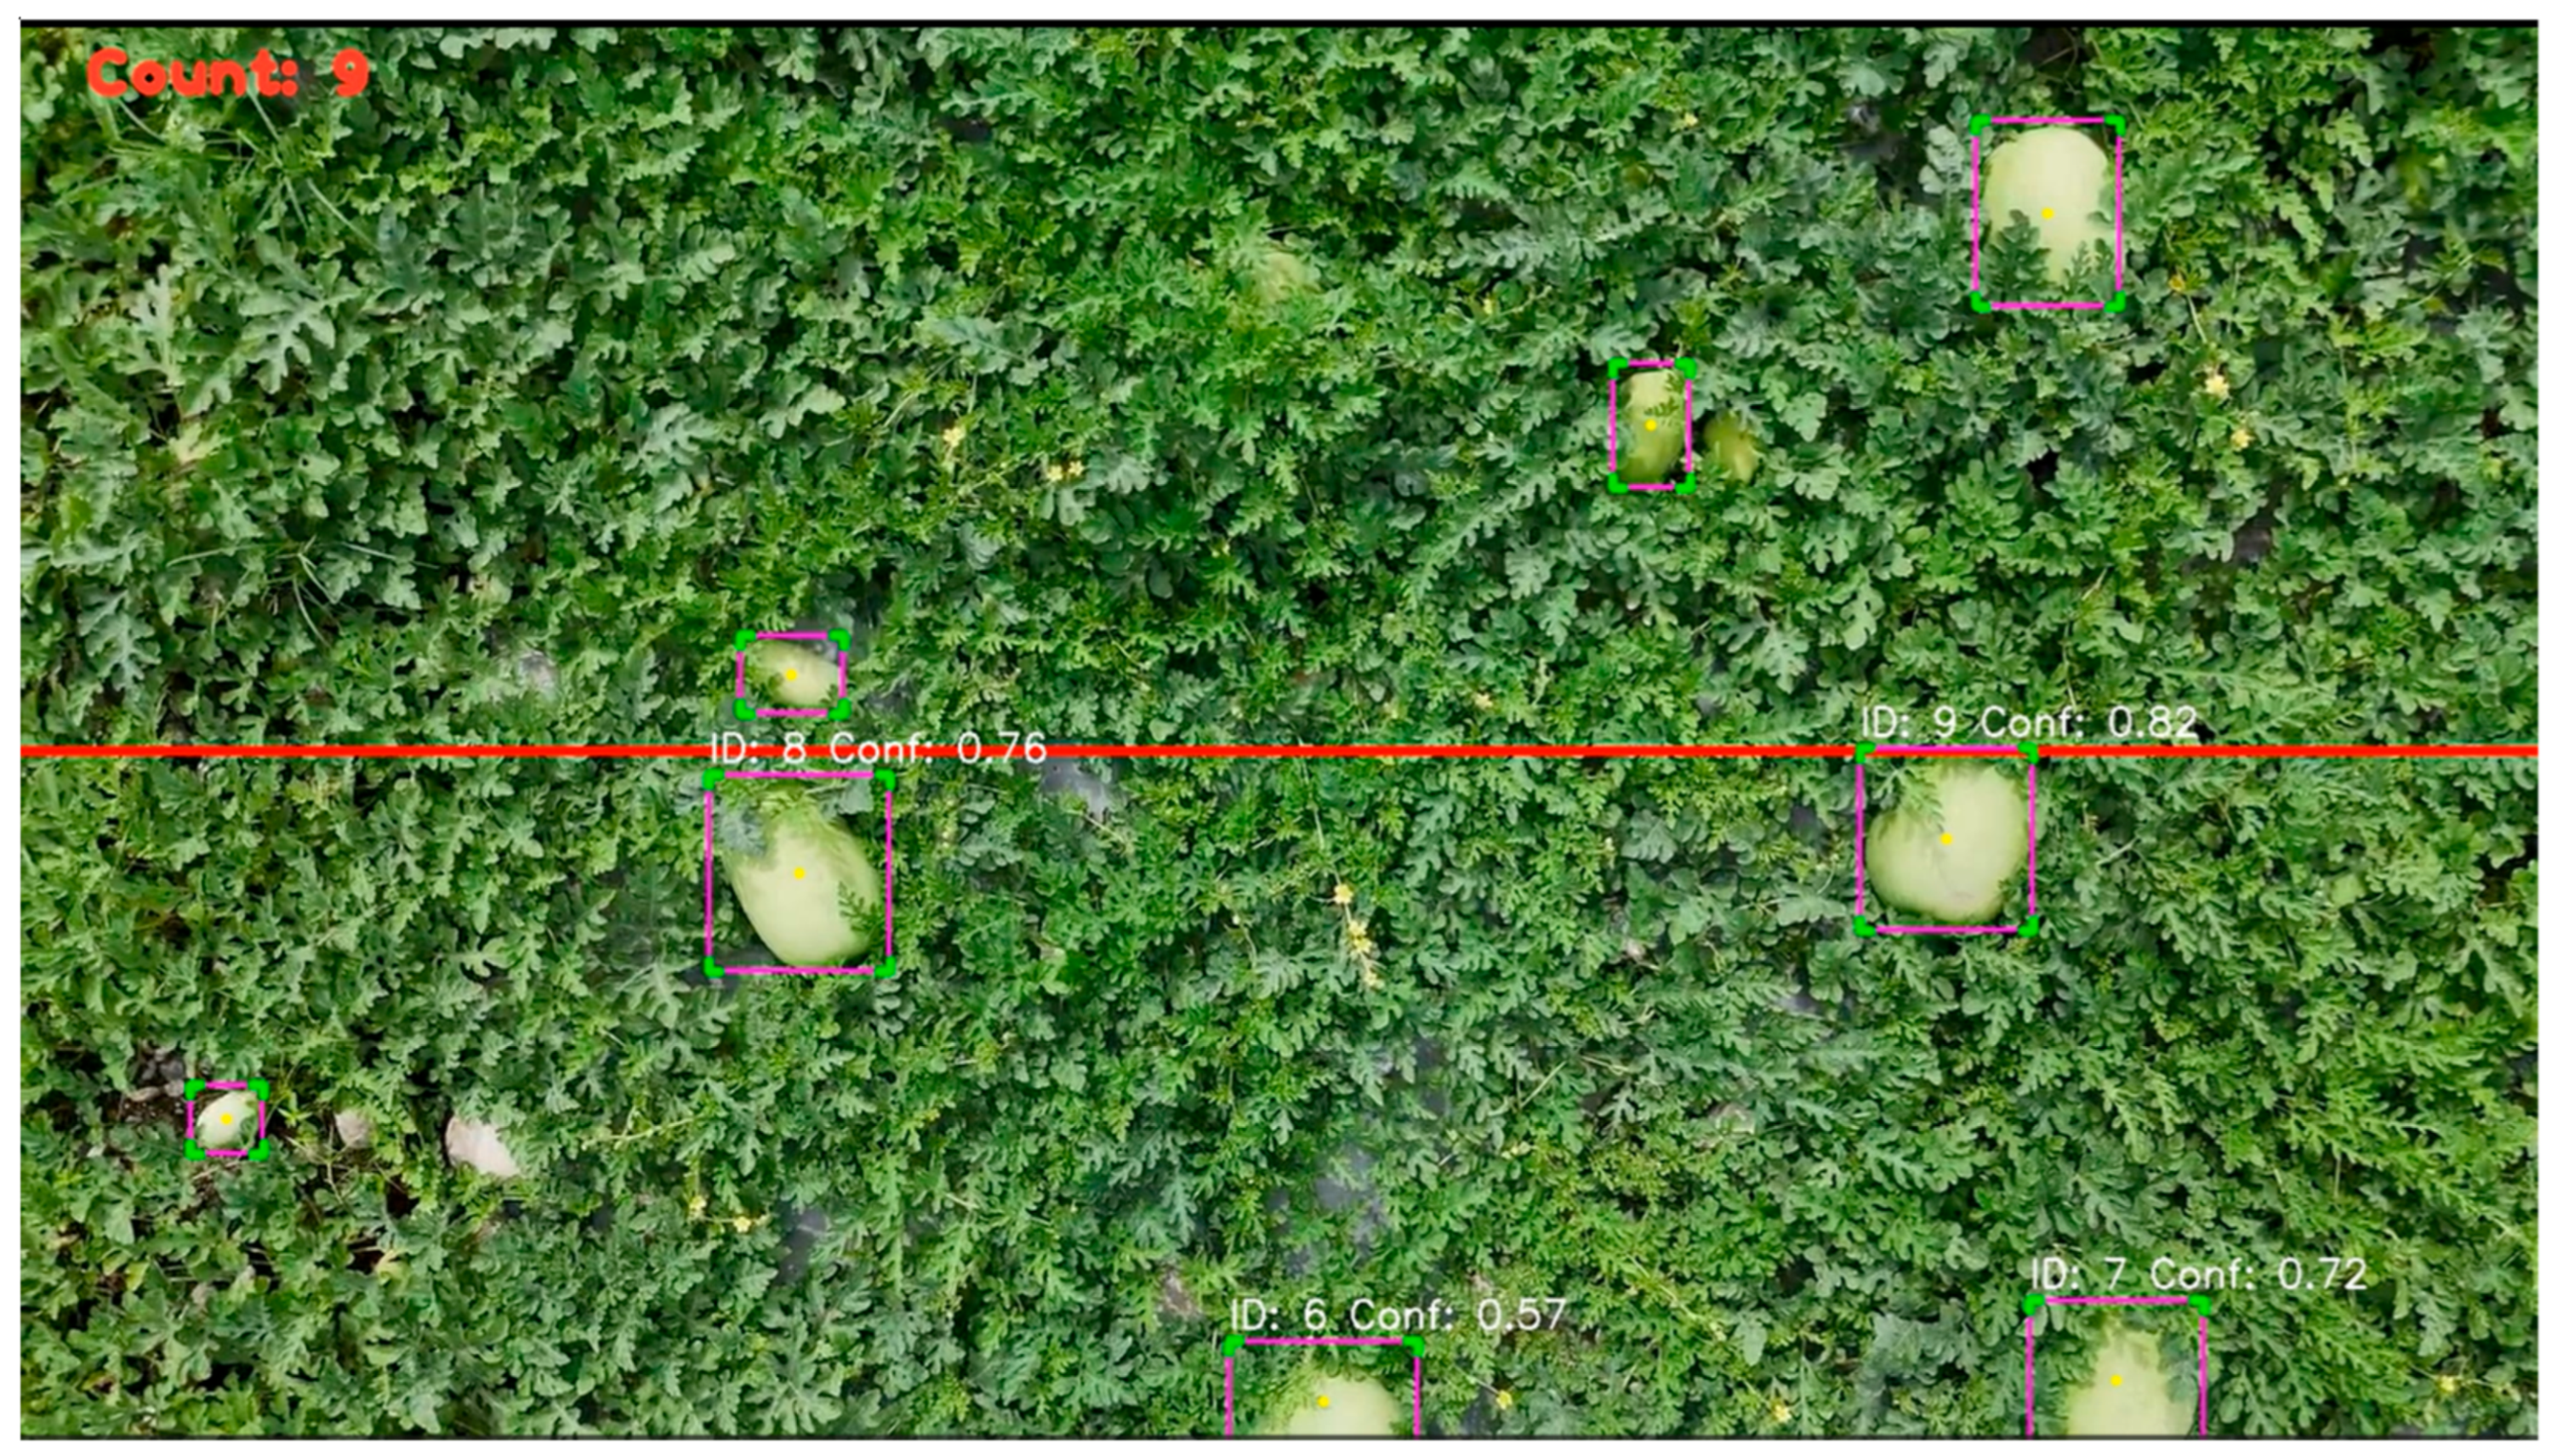
Figure 2 displays the training results of the YOLOv8n-OBB model applied to the watermelon dataset, which was labeled using Roboflow. This dataset was annotated for the OBB model, resulting in the incorporation of rotated bounding boxes that accurately showed the orientation of the watermelons in the images. The log detailed 95 through 100 epochs, displaying metrics, including GPU memory usage, bounding box loss, classification loss, distribution focal loss, and the number of instances detected. Precision and recall for bounding boxes were also displayed. The log presented the image size, progress within each epoch, mAP at different IoU thresholds, and the iterations per second. After 100 epochs, the training was completed in 0.112 h, and the optimizer was stripped from the weights files to save space. Finally, the model was validated with the YOLOv8-OBB architecture details, the validation metrics (precision, recall, and mAP), and the processing speed. The results were stored in the specified directory. The oriented bounding boxes were used for the precise location of fruits at various angles, thereby enhancing the model’s detection capabilities and overall performance in identifying watermelons in diverse field settings.
Interference produced the detection results of YOLOv8-OBB. It was caused by oriented bounding box coordinates in both corner and centroid format, along with confidence scores for each detected object. In other words, the four vertices of the bounding box were captured from the model output to calculate the height and width of the bounding box. Moreover, the center of the bounding box was also calculated. After scaling these measurements with the scale factor (a ratio of real object size and image size), the detected watermelons were counted, and the oriented bounding box was drawn on the image using OpenCV’s cv2.polylines. Finally, each box was annotated with its area and confidence score.

3. Results and Discussion

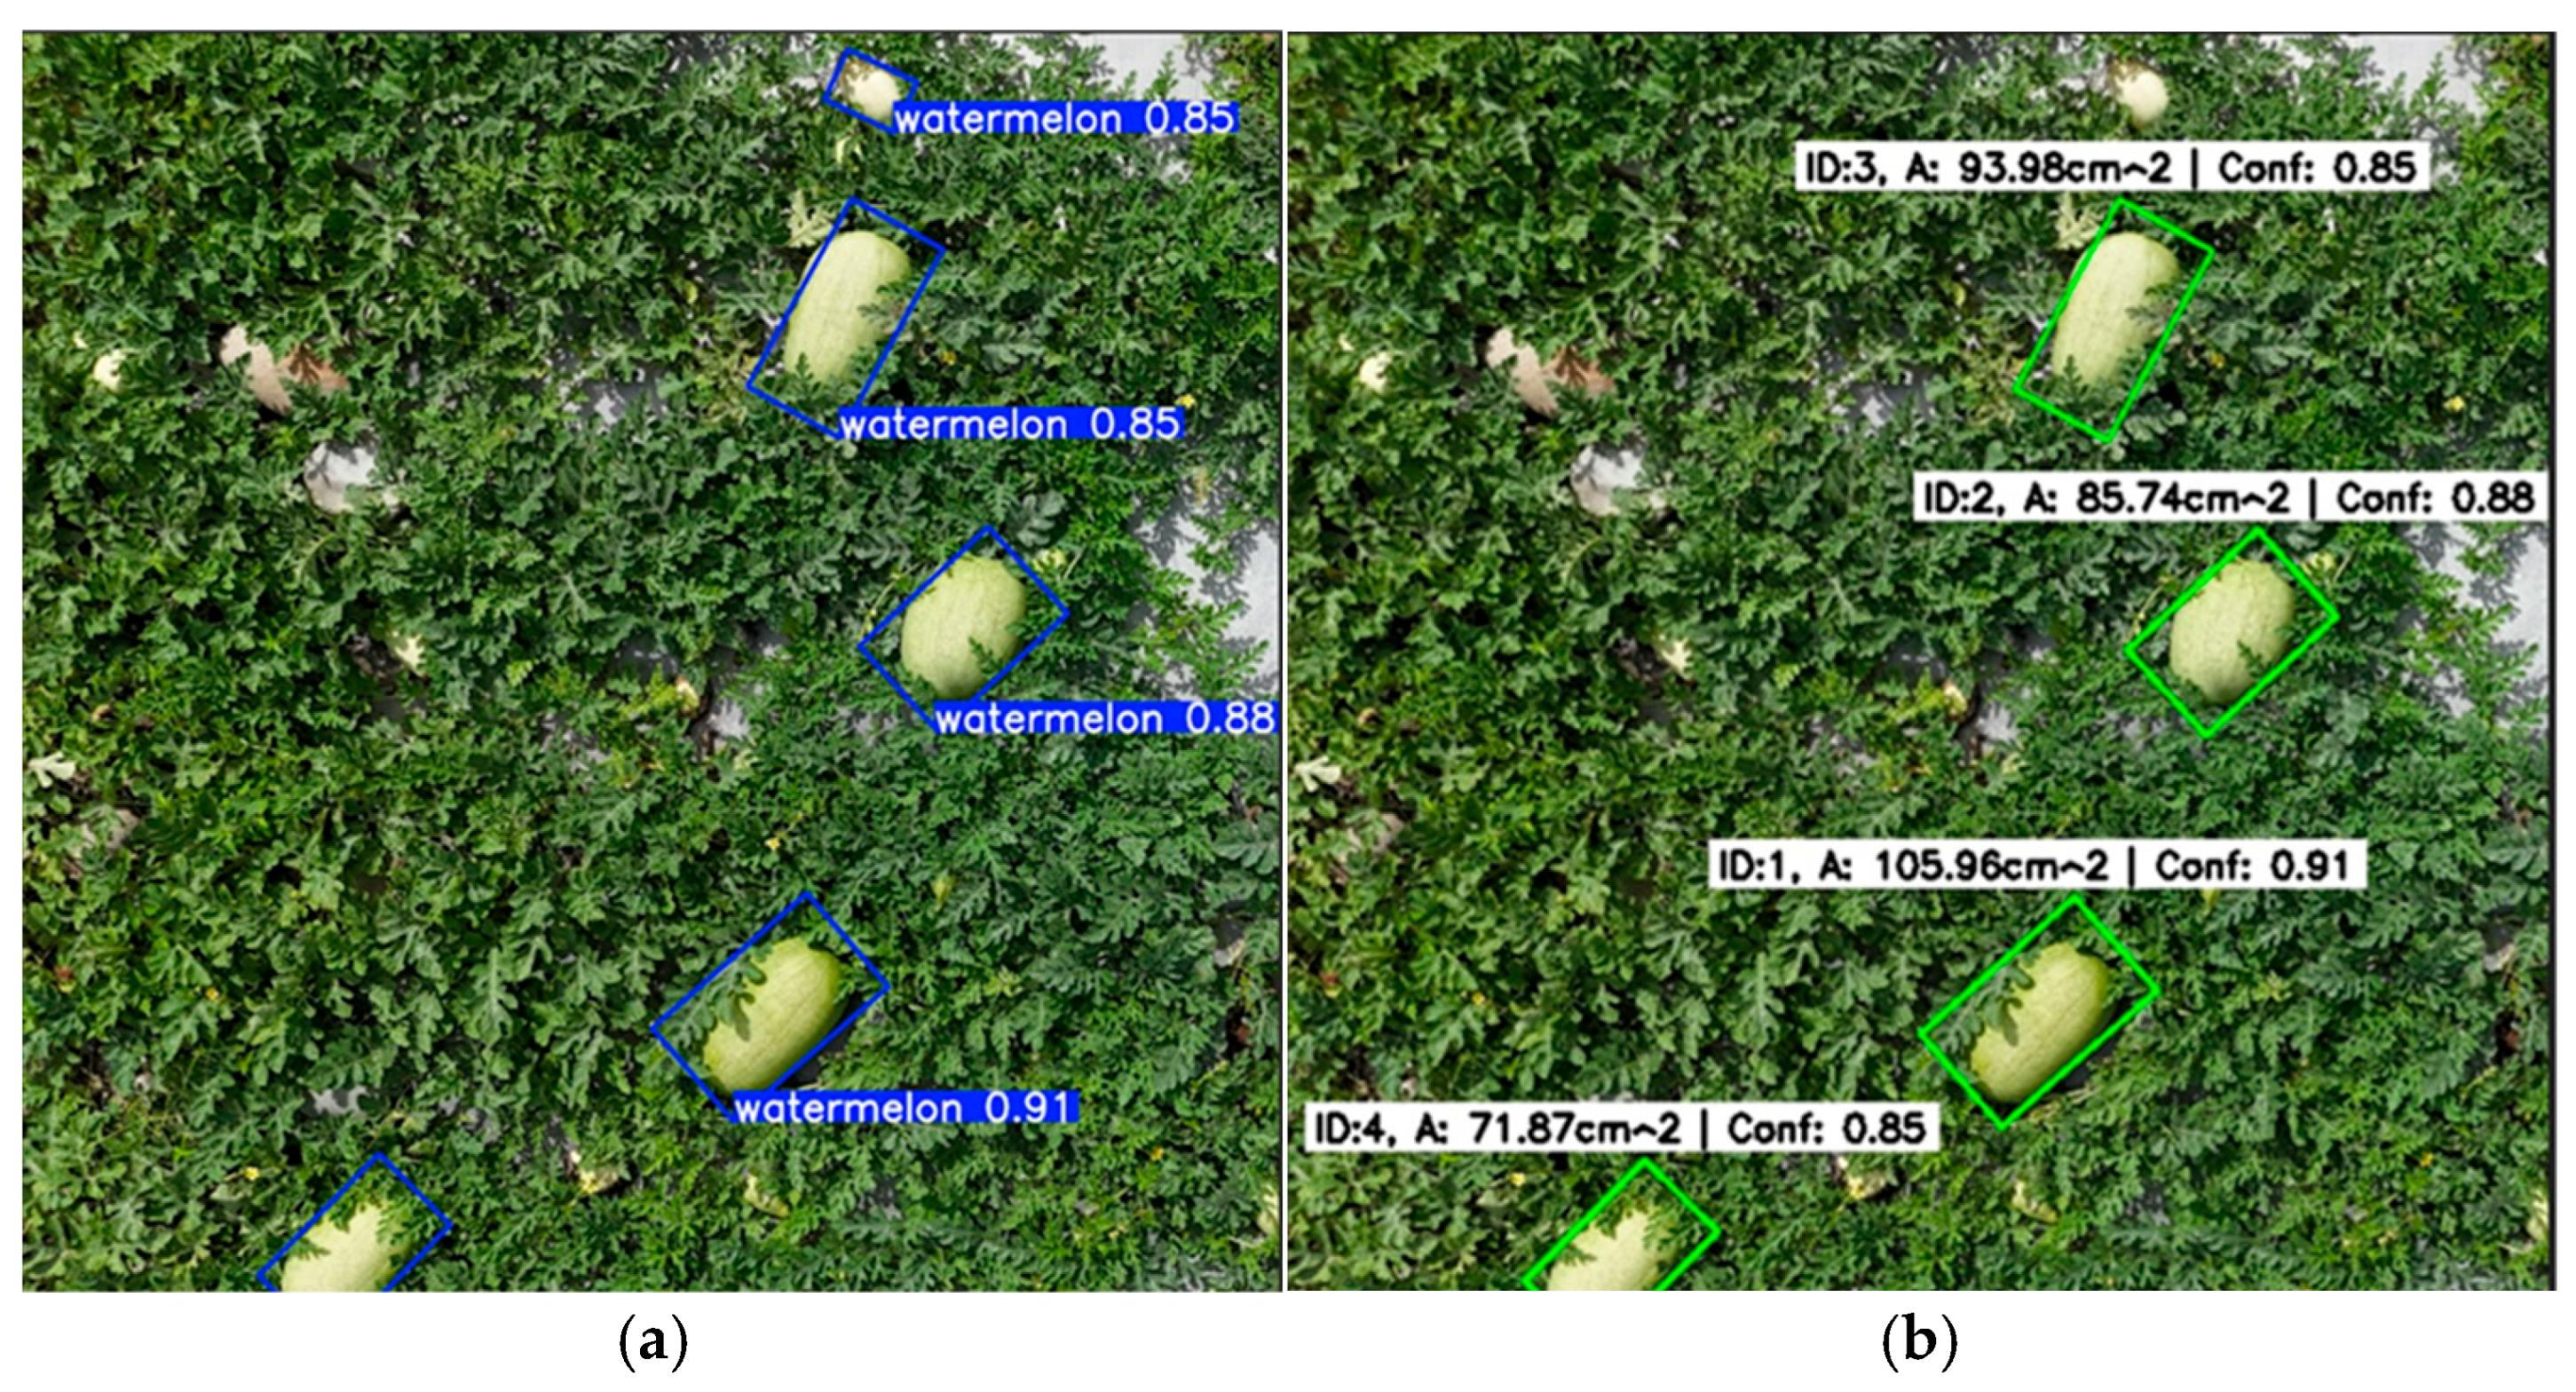
Figure 3 shows the real-time detection of watermelon in a real field. The “Count: 9” at the top indicates that there are nine watermelons that have already been detected and counted. The red line is the counting logic applied to the video frame. As the center of a bounding box touches the red line, the algorithm captures and saves key metrics (unique ID, confidence score, width, height, area, and timestamp) in Microsoft Excel for each detected watermelon. This process ensured that only the relevant data for watermelons that intersect with the designated line was logged, facilitating precise tracking and analysis of the detected watermelon.
The combination of real-time image detection and comprehensive data logging formed a robust dataset for agricultural assessments and monitoring yield quality, as illustrated in both the image and the organized Excel data. Table 1 shows the performance analysis of YOLOv8 models, specifically focusing on mAP at IoU thresholds of 0.50 and 0.50–0.95 and precision along with their respective memory usage. YOLOv8l showed the highest mAP50 at 0.964, indicating strong accuracy at the 0.50 IoU threshold. YOLOv8n exhibited the best mAP50–95 score at 0.526, suggesting it performed well across various detection difficulties. The YOLOv8n model showed its low memory usage at just 6.2 MB, making it ideal to use in environments with limited resources.
Table 2 presents the data captured from the video after performing prediction using the trained model. The Unique ID column included a distinct identifier for each entry for easy reference. The Confidence column included the model’s certainty about the presence of a detected watermelon and the accuracy of its predicted bounding box, while the width (cm) and height (cm) columns showed the dimensions of the bounding box in centimeters. The area (cm2) column included the total area of the bounding box, derived from the width and height, and the time (s) column contained metrics with measurements in seconds.
Figure 4a presents the prediction results from the trained YOLOv8n-OBB model before counting and area measurement, highlighting the confidence scores alongside the oriented bounding boxes. Figure 4a shows that the model effectively identifies five watermelons within the images, with the confidence scores and the oriented bounding boxes, indicating the model’s certainty in each prediction.
The previous version of the YOLOv8n-OBB model detected watermelon with a confidence score (Figure 4). Furthermore, to find the area of the bounding box and unique ID, we modified the YOLOv8n-OBB. Figure 4b shows the detection results and the measurement of watermelon size with the modified YOLOv8n-OBB model on the same image as Figure 4a. The modified version of YOLOv8n-OBB was powerful because it predicted watermelon and provided the bounding box area and counting numbers. There were four predicted watermelons in Figure 4b because we added a filter to ignore the bounding box with an area less than 50 cm2 for finding bigger watermelons. In Figure 4a, the upper predicted watermelon was predicted in Figure 4b due to the area of the bounding box being less than 50 cm2 even if its confidence score exceeded 0.85.
Each bounding box in Figure 4b shows an ID number, which indicates the detected watermelon. The area of each bounding was calculated in pixels, and then a scale factor was used to convert from pixels to square centimeters, reflecting the size of the watermelon. Each annotation includes a confidence score indicating the model’s certainty about the detection. For better visualization, bounding boxes were drawn in green color and the text was written on a white background.
Table 3 represents the YOLOv8-OBB model performance for each version, focusing on mAP at IoU thresholds of 0.50 and 0.50–0.95 and precision, along with their respective memory usage. YOLOv8l-OBB showed the highest mAP50–95 at 0.702, suggesting it performed well across various detection difficulties. YOLOv8s-OBB exhibited the best precision at 0.933, indicating strong accuracy at the 0.50 IoU threshold. The YOLOv8n-OBB model presented its low memory usage of 6.2 MB, making it ideal to use in environments with limited resources.

4. Conclusions

We developed an automated watermelon detection and yield estimation system using YOLOv8 and YOLOv8-OBB, and the model performance was compared with that of all versions of the YOLOv8 models. For tracking and counting watermelons, the SORT algorithm was used, and the results including watermelon size and confidence score were saved in a Microsoft Excel file. The highest precision was achieved by the YOLOv8s-OBB model, which was (0.938). The evaluation results of the YOLOv8 and YOLOv8-OBB models showed that the YOLOv8-OBB model performed better in terms of mAP50-95 and precision.
The YOLOv8-OBB models can be used for the yield estimation of watermelons and bounding boxes around watermelon stems. The picking point can be located for harvesting. The models contribute to the development of AIoT autonomous harvesting robots for big and heavy fruits. Limitations of the YOLOv8-OBB model still need to be addressed by correcting the rotation angle of the bounding boxes because bounding boxes were over-rotated. For precise yield estimation and accurate picking point location, these challenges need to be addressed for precision farming.

Author Contributions

Conceptualization, C.-Y.C. and C.-P.W.; methodology, C.-Y.C.; software, M.F.; validation, M.F., C.-Y.C. and C.-P.W.; formal analysis, M.F., C.-Y.C. and C.-P.W.; investigation, M.F., C.-Y.C. and C.-P.W.; resources, C.-Y.C. and C.-P.W.; data curation, M.F.; writing—original draft preparation, M.F.; writing—review and editing, M.F., C.-Y.C. and C.-P.W.; visualization, M.F.; supervision, C.-Y.C. and C.-P.W.; project administration, C.-Y.C. and C.-P.W.; funding acquisition, C.-Y.C. and C.-P.W.; All authors have read and agreed to the published version of the manuscript.

Funding

This research received no external funding.

Institutional Review Board Statement

Not applicable.

Informed Consent Statement

Not applicable.

Data Availability Statement

Primary dataset used in this research is available at https://universe.roboflow.com/test-og0sq/test-for-watermelon (accessed on 15 November 2024).

Conflicts of Interest

The authors declare no conflict of interest.

References

  1. Banerjee, D.; Kukreja, V.; Gupta, A.; Singh, V.; Brar, T.P.S. CNN and SVM-based model for effective watermelon disease classification. In Proceedings of the 2023 3rd Asian Conference on Innovation in Technology (ASIANCON), Ravet IN, India, 25–27 August 2023; pp. 1–6. [Google Scholar]
  2. Adda, S.A.; Nwaogwugwgu, I.B.; Wama, A. Detection of cucumber and watermelon diseases based on image processing techniques using K-means algorithm. Int. J. Multidisc. Res. Growth Eval. 2023, 4, 38–46. [Google Scholar] [CrossRef]
  3. Nazulan, W.N.S.W.; Asnawi, A.L.; Ramli, H.A.M.; Jusoh, A.Z.; Ibrahim, S.N.; Azmin, N.F.M. Detection of sweetness level for fruits (watermelon) with machine learning. In Proceedings of the 2020 IEEE Conference on Big Data and Analytics (ICBDA), Langkawi Island, Malaysia, 16–17 November 2020; pp. 79–83. [Google Scholar]
  4. Nasaruddin, A.S.; Baki, S.R.M.S.; Tahir, N.M. Watermelon maturity level based on rind colour as categorization features. In Proceedings of the 2011 IEEE Colloquium on Humanities, Science and Engineering, Penang, Malaysia, 5–6 December 2011; pp. 545–550. [Google Scholar]
  5. Cheng, Y.S.; Wang, S.C.; Liu, Y.H.; Peng, B.R. An intelligent noninvasive taste detection app for watermelons. In Proceedings of the 2017 5th International Conference on Applied Computing and Information Technology/4th International Conference on Computational Science/Intelligence and Applied Informatics/2nd International Conference on Big Data, Cloud Computing, Data Science (ACIT-CSII-BCD), Hamamatsu, Japan, 9–13 July 2017; pp. 90–94. [Google Scholar]
  6. Ho, M.J.; Lin, Y.C.; Hsu, H.C.; Sun, T.Y. An efficient recognition method for watermelon using faster R-CNN with post-processing. In Proceedings of the 2019 8th International Conference on Innovation, Communication and Engineering (ICICE), Hangzhou, China, 25–30 October 2019; pp. 86–89. [Google Scholar]
  7. Yu, Y.; Zhang, K.; Liu, H.; Yang, L.; Zhang, D. Real-time visual localization of the picking points for a ridge-planting strawberry harvesting robot. IEEE Access. 2020, 8, 116556–116568. [Google Scholar] [CrossRef]
  8. Gao, F.; Fang, W.; Sun, X.; Wu, Z.; Zhao, G.; Li, G.; Zhang, Q. A novel apple fruit detection and counting methodology based on deep learning and trunk tracking in modern orchard. Comput. Electron. Agric. 2022, 197, 107000. [Google Scholar] [CrossRef]
  9. Wang, Z.; Walsh, K.; Koirala, A. Mango fruit load estimation using a video based MangoYOLO-Kalman filter-Hungarian algorithm method. Sensors 2019, 19, 2742. [Google Scholar] [CrossRef] [PubMed]
  10. Guo, Y.; Aggrey, S.E.; Yang, X.; Oladeinde, A.; Qiao, Y.; Chai, L. Detecting broiler chickens on litter floor with the YOLOv5-CBAM deep learning model. Artif. Intell. Agric. 2023, 9, 36–45. [Google Scholar] [CrossRef]
  11. Van Etten, A. You Only Look Twice: Rapid Multi-Scale Object Detection in Satellite Imagery. In Proceedings of the IEEE Conference on Computer Vision and Pattern Recognition, Salt Lake City, UT, USA, 18–23 June 2018. [Google Scholar]
  12. Jiang, L.; Jiang, H.; Jing, X.; Dang, H.; Li, R.; Chen, J.; Fu, L. UAV-based field watermelon detection and counting using YOLOv8s with image panorama stitching and overlap partitioning. Artif. Intell. Agric. 2024, 13, 117–127. [Google Scholar] [CrossRef]
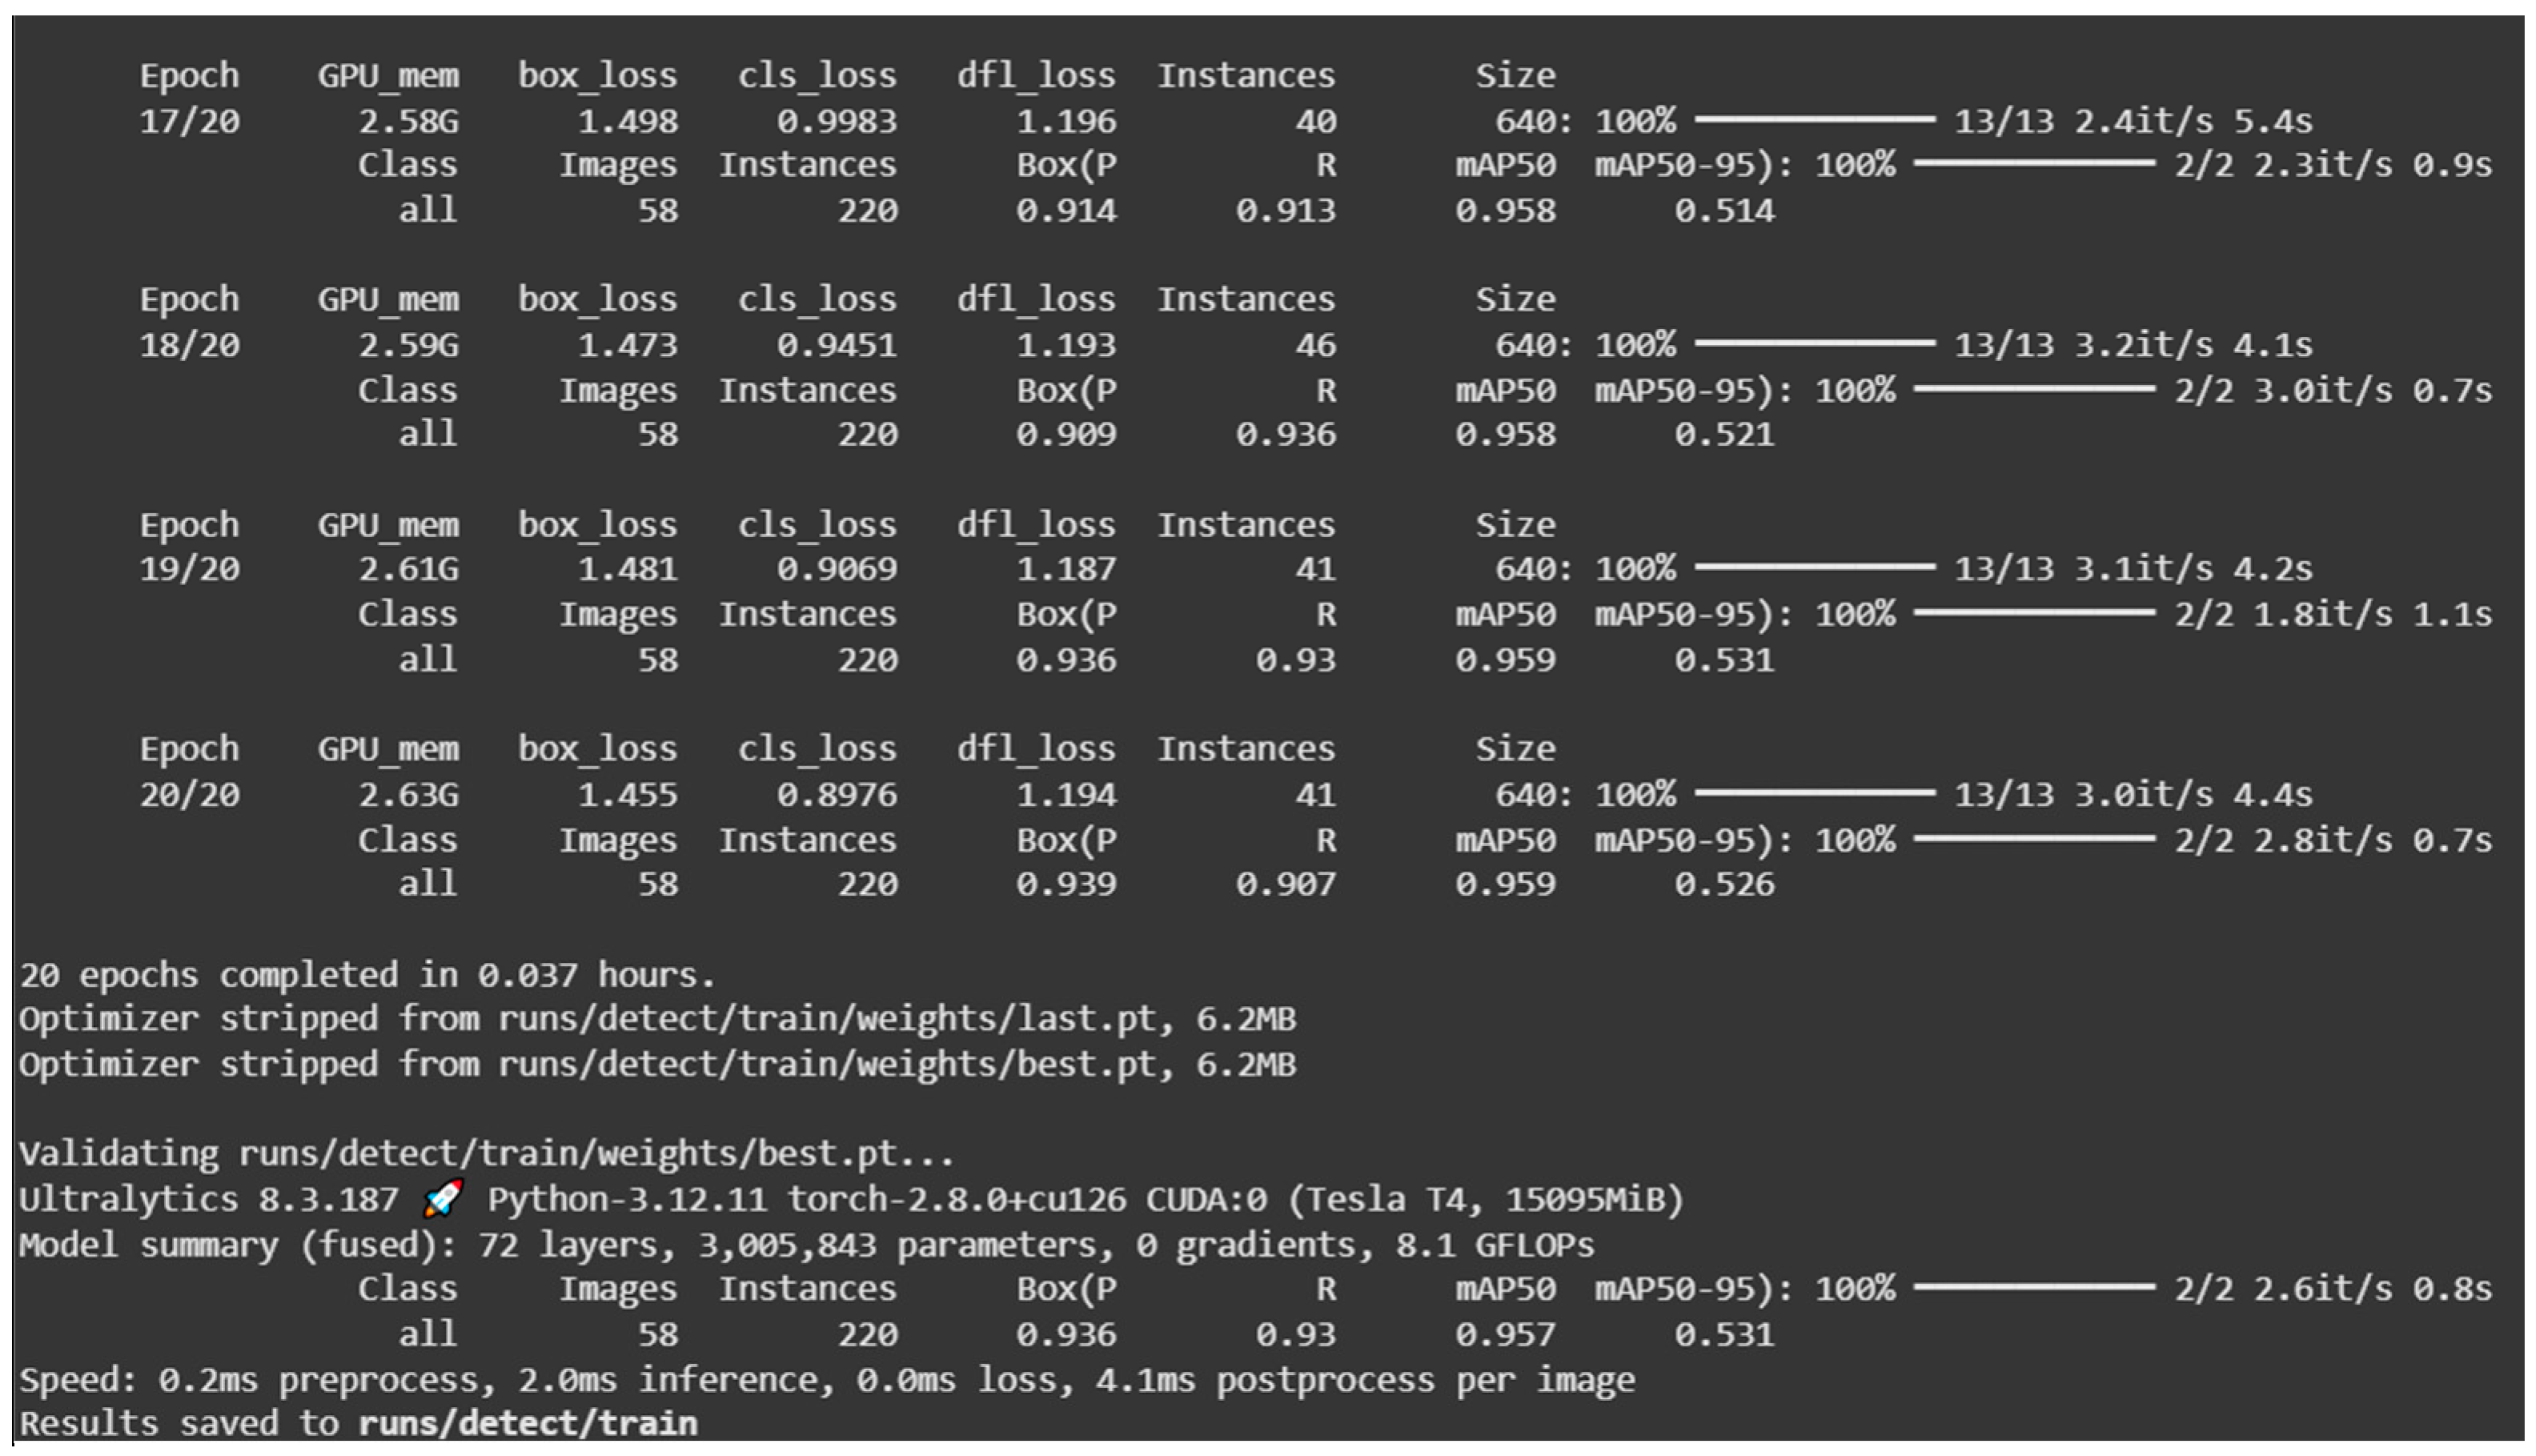
Figure 1. YOLOv8n training process over watermelon dataset.
Engproc 108 00010 g001
Figure 2. YOLOv8n-OBB training processing over watermelon dataset.
Engproc 108 00010 g002
Figure 3. Detected watermelon process on a video. Red points indicate the center of each bounding box.
Engproc 108 00010 g003
Figure 4. (a) Watermelon detection using YOLOv8n-OBB. (b) Watermelon detection and area measurement with modified YOLOv8-OBB.
Engproc 108 00010 g004
Table 1. Evaluation of YOLOv8 (m, n, l, s, x, and l) models.
ModelsmAP50mAP50–95PrecisionMemory
YOLOv8m0.9460.5190.81952.0 MB
YOLOv8n0.950.5260.9156.2 MB
YOLOv8l0.9640.5080.80687.6 MB
YOLOv8s0.9510.5280.82022.5 MB
YOLOv8x0.9610.4770.798136.7 MB
Table 2. Watermelon detection metrics from the video.
Unique IDConfidenceWidth (cm)Height (cm)AreaTime (s)
10.6711.6820.43238.621.13
20.8217.1318.78321.71.67
30.7910.9115.86173.031.73
40.718.7611.2998.91.8
50.347.366.2245.782.53
60.816.6216.37272.073.1
70.8115.8620.05317.993.27
80.7717.7718.91336.034.67
90.8117.1317.64302.174.77
100.479.527.3670.075.23
110.445.467.7442.265.9
120.626.8511.5579.125.97
130.8113.0718.53242.196.57
140.7412.3115.48190.567.93
150.7312.1817.01207.188.7
160.7612.3115.61192.169.57
170.814.0918.27257.429.87
180.517.497.7457.9712.07
190.8112.6919.04241.6212.3
200.8317.1321.57369.4913.47
210.7814.5916.88246.2813.83
220.455.339.2649.3614.17
230.526.477.9951.714.2
240.5510.037.6176.3314.33
250.7612.4419.29239.9714.57
Table 3. Evaluation of YOLOv8 (m, n, l, s, x, and l)-OBB models.
ModelsmAP50mAP50–95PrecisionMemory
YOLOv8m-OBB0.9210.6850.89553.4 MB
YOLOv8n-OBB0.9330.6940.8976.2 MB
YOLOv8l-OBB0.9220.7020.91989.6 MB
YOLOv8s-OBB0.900.6850.93823.5 MB
YOLOv8x-OBB0.9060.7010.924139.7 MB
Disclaimer/Publisher’s Note: The statements, opinions and data contained in all publications are solely those of the individual author(s) and contributor(s) and not of MDPI and/or the editor(s). MDPI and/or the editor(s) disclaim responsibility for any injury to people or property resulting from any ideas, methods, instructions or products referred to in the content.