Abstract
The development of information technology has transformed various aspects of life, including education, by making it more flexible, interactive, and accessible. One platform that plays an important role in this transformation is YouTube, a video sharing platform that allows users to upload, watch, share, and comment on videos online. YouTube is not only a medium of entertainment, but also a significant source of additional learning, especially in higher education such as the Informatics Engineering Department. The platform provides various learning materials, such as programming tutorials, computer network concepts, and software development, which can be accessed anytime and anywhere. YouTube’s advantages lie in its accessibility and the ability for users to repeat videos, making it easier to understand complex material. However, using YouTube as a learning resource also has its challenges, such as the difficulty in finding relevant and high-quality content, as well as the variety of academic standards used in the delivery of the material. Therefore, this study aims to evaluate the effectiveness of YouTube as an additional learning media and provide recommendations for the best channels for Informatics Engineering students. Factors, such as the number of views, the number of subscribers, the frequency of uploading new content, and the background of the content creator, are considered in channel selection. The Weighted Product (WP) method in the Decision Support System (SPK) is used to evaluate the effectiveness of YouTube based on predetermined standards. The research results are expected to provide recommendations for the most relevant and high-quality YouTube channels so as to improve students’ understanding of educational materials and optimize the use of digital learning resources.
1. Introduction
Various aspects of life, including education, have been transformed by the rapid development of information technology. Digitalization has made education more flexible, interactive, and accessible, including on YouTube.
YouTube is a video-sharing platform that allows users to upload, watch, share, and comment on videos online [1]. YouTube provides various types of video content, including music, movies, educational videos, vlogs, tutorials, live streaming, and more. The platform has become one of the most popular websites in the world and plays an important role in popular culture, education, and business [2].
In addition to being a video-based entertainment medium, YouTube also provides a variety of educational content and has become a major source of supplemental learning in higher education settings, particularly in the Department of Informatics Engineering. It has become an important resource to help students understand complex academic concepts more easily.
YouTube provides various learning materials, such as programming tutorials, computer network concepts, software development, and the latest technological developments. YouTube has an easy accessibility that can be used anytime and anywhere, which is its main advantage in supporting learning [3]. In addition, the ability to repeat videos allows students to master the material better, especially on topics that are difficult to understand in formal lectures [4].
While YouTube has many advantages, there are some things to be aware of when using it. When many videos are available, it is often difficult for students to find the most relevant and quality content [5]. In addition, not all YouTube videos can be used as a good learning resource, as the academic standards used to deliver the material differ greatly. As a result, more in-depth research is needed to evaluate YouTube as an additional learning medium and identify the factors that influence it. This study also aims to select YouTube channels that are more suitable to be used as supplemental learning resources. The number of views, the number of subscribers, the frequency of uploading new content, and the background of the teacher or content creator are important factors that influence the selection of these channels. Therefore, students can be directed to the most relevant and high-quality resources to improve their learning outcomes.
The purpose of this research is to evaluate how effective YouTube is and provide recommendations for the best channels to use as learning media for Informatics Engineering students. In addition, this research focuses on the benefits of selecting the right YouTube channel for students to improve their understanding of educational content, offer better access to educational content, and optimize digital learning methods through reliable sources. The Weighted Product (WP) method in Decision Support Systems (DSS) is used to evaluate the effectiveness of YouTube based on predefined standards. This research is expected to produce recommendations.
2. Materials and Methods
The method used in this research is a questionnaire involving research sources as the object to be studied. This methodology will include a series of steps needed to design, develop, and evaluate an effective decision support system using the Weighted Product (WP) method. The application of the WP method in this study, with a focus on determining the weight of criteria such as evaluating user effectiveness and recommendations for determining YouTube channels.
2.1. Data Collection
In the research, data collection for decision-making is taken through interviews and observations. The sample in this study consisted of 15 Informatics Engineering students, who were considered to represent the population of majors at Nusa Putra University. The data collected from interviews and observations are then converted into numerical or quantitative form to be processed using the Weighted Product (WP) method, an efficient method for collecting quantitative data from a large number of respondents. The questionnaire must be carefully designed to ensure clarity of questions and reduce bias [6].
2.2. Weighted Product (WP) Method
The method used is Weighted Product (WP), which allows decision-making based on the calculation of weights against various predetermined criteria, then multiplying the value of each alternative by the weight given to each criterion [7]. With this method, the effectiveness of YouTube in improving student understanding and selecting the best channel can be analyzed objectively. The steps in the WP method are as follows [8,9]:
- Determine the criteria and weights that will be used as assessment parameters;
- Determines the calculation of the relative value of the initial weight or weight normalization.
The weight of each criterion needs to be normalized so that the total amount is equal to 1. Normalization is done by the formula:
Description:
- = Normalized weights
- = Initial weight
- = Total weight of all criteria before normalization
- 3.
- Calculate the preference value for each alternative vector S.
After the normalized weight value is obtained, each alternative is calculated to obtain the value of the S vector using the formula:
For the attribute cost, the valueX must be negatively scaled:
Description:
- Multiplication operator (product)
- Total value of the alternative
- The value of the ke = alternative on the ke-criterion
- Normalized weight of the criterion
- 4.
- Calculating Relative Preference Value (Vi)
- = Multiplication operator (Product)
- = The value vector of the th alternative
- = Total value of all alternatives
- 5.
- Perform Ranking and Analysis of Results
After going through the calculation process using the Weighted Product (WP) method, the last step is to rank and analyze the results to determine the best value based on the final value obtained, namely, the highest V value is the best [10].
2.3. Implementation of Decision Support System
Implementation of a Decision Support System (SPK) is a web-based system designed to assist the decision-making process by presenting information, data analysis, and modeling alternative decisions. This development process uses the Waterfall Software Development Life Cycle, which is one of the most traditional and structured software development models. This model follows a linear and sequential approach, where each phase must be completed before proceeding to the next phase, as illustrated in Figure 1. In the development of researchers using the waterfall model, which includes Requirement Analysis, System Design, Implementation, Testing, Deployment, and Maintenance [11].
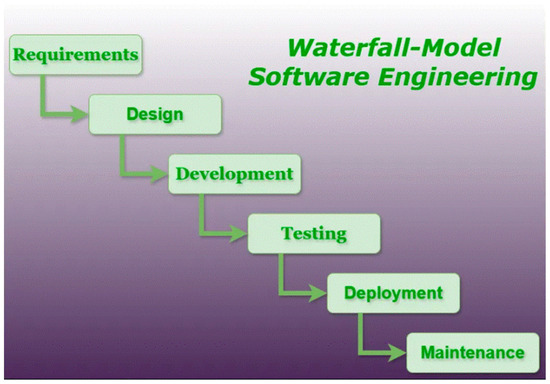
Figure 1.
Waterfall model (source: https://www.geeksforgeeks.org/waterfall-model/ (accessed on 16 November 2024)).
In this research, SPK is used to evaluate the effectiveness of YouTube usage and determine the best channels that can be used as learning references for Informatics Engineering students.
3. Results and Discussion
The results of research conducted on the Decision Support System for Evaluating the Effectiveness of Using YouTube and Recommending the Best Channel as a Learning Media for Informatics Engineering Students with the Weighted Product Method. This stage will include a series of steps needed to design, develop, and evaluate an effective decision support system using the Weighted Product (WP) method of applying the WP method in this study, focusing on determining the weight of criteria such as evaluating user effectiveness and recommendations for determining YouTube channels.
3.1. Data Collection
This stage presents data collection, processing, and drawing reliable conclusions by taking from case study questionnaire data with attributes used [12]. The questionnaire items used in this study and the YouTube channel recommendation data are presented in Table 1 and Table 2, respectively.
- Question Data for Evaluation of the Effectiveness of YouTube Usage;

Table 1.
Question data for evaluation of the effectiveness of YouTube usage.
Table 1.
Question data for evaluation of the effectiveness of YouTube usage.
| No. | Question Category | Question |
|---|---|---|
| 1 | Personal Data | full name, number and class, and e-mail. |
| 2 | Content Relevance | To what extent do the learning videos you watch on YouTube match what you want, or are they relevant to the course material being taught and support your understanding of the topic being studied? |
| 3 | Quality of Delivery | To what extent do the learning videos you watch on YouTube match what you want or are they relevant to the course material being taught and support your understanding of the topic being studied? |
| 4 | Audiovisual Quality | What is the quality of the audio–visual or sound and images in the YouTube learning videos that you use in the learning process? |
| 5 | Interactivity & Engagement | How often do you engage in discussions or interactions through comment features, discussion forums, or other platforms related to the learning videos you watch on YouTube? |
| 6 | Frequency of Use | How often do you use YouTube as a learning medium outside of lecture hours? |
| 7 | Access Barriers | How often do you experience problems accessing learning videos on YouTube due to technical factors or internet limitations? |
| 8 | Impact on Understanding | How much does YouTube contribute to helping you understand the theoretical and practical concepts taught in lectures, or understand the world of information technology? |
- 2.
- YouTube Channel Recommendation Data
Table 2.
YouTube channel recommendation data.
Table 2.
YouTube channel recommendation data.
| No. | Channel Name | Total Number of Views | Number of Subscribers | Upload Frequency | Number of Videos | Teacher Background |
|---|---|---|---|---|---|---|
| 1 | Web Programming UNPAS | 98,556,122 | 933,000 | Very Routine | 1088 | Sandhika Galih (IT Lecturer at Pasundan University), a special channel that discusses internet technology and web development, managed by Sandhika Galih (Pa Dhika). |
| 2 | Dea Afrizal | 504,000 | 511,000 | Once every 2 weeks | 566 | Anything related to my daily life and technology is shared here. dea afrizal programming and tech YouTube channel. |
| 3 | Online Computer Class | 5,297,380 | 63,200 | Routine, twice a week | 735 | All started with a hobby, the Online Computer Class Channel was created with the aim of education, which discusses material, tutorials, and tips on computer tricks, especially in the use of software and online computer classes for friends, especially those who want and are just starting to learn about computers and generally for anyone who is interested in learning in online computer classes. And of course, the material that will be delivered in the Online Computer Class Channel is based on experience/practice ranging from operators, technicians, and computer instructors, since starting to know the name of the computer in 2001 and until now will continue to try to share experiences about computers through videos on this channel, and, of course, all of this is made for those who want to learn about computers. Hopefully, this channel is useful. With me: Andhisstekom |
| 4 | Today’s Programmer | 24,448,643 | 278,000 | Very Routine | 1048 | Eko Kurniawan Khannedy’s YouTube channel, commonly called Kang Eko, discusses more about the backend world, such as Golang, Kotlin, Python, APIs, Databases, Microservices, and more. |
| 5 | Open Class | 28,420,093 | 437,000 | 3–6 Videos in one month. Be regular | 666 | Open Class is a channel for learning programming/programming/coding/coding in Indonesian. This channel discusses programming techniques in general, along with related technologies and computing and data processing techniques. The approach taken in the open class is brief, friendly, and fun. Thus, this channel is expected to fill the void of practical implementation in formal education materials in Indonesia. This channel is managed by Faqihza Mukhlish, a researcher in the field of control systems. He graduated from Bachelor of Engineering Physics, Master of Instrumentation and Control, ITB, and Doctorate (Ph.D) at UNSW, Sydney, Australia. Currently, he is an active lecturer at the Department of Engineering Physics, Bandung Institute of Technology. |
| 6 | School Coding | 12,766,477 | 140,000 | Last year, he was regular, but this year, it has been 5 months without upload | 1017 | Sekolah Koding is a site for learning programming for free in Indonesian. Starting from the lack of well-organized Indonesian tutorials, a YouTube channel called Sekolah Koding and a learning site like w3schools were created in early 2015 by Hilman Ramadhan to establish an |
| 7 | Indonesia Learning | 6,897,559 | 133,000 | Three Videos and three live every 2 months, previous year more regularly | 589 | Indonesian language computer science learning channel. This channel was initiated by Setia Budi in 2016 while he was studying for his PhD in Australia, but the first learning video on this channel was only started in January 2019. The motto of this channel is “Learn a lot so you can help people”. This channel was built with the motivation to encourage the development of human resources in Indonesia with qualified basic skills in the field of information technology, or IT. |
| 8 | CodePolitan | 1,254,174 | 37,500 | Routine | 196 | CodePolitan is an educational and informational media about programming and technology. CodePolitan was built to facilitate developers in getting information and knowledge about programming and technology. The content in CodePolitan is organized in such a way and in Indonesian language so that it is easily understood by Indonesian developers. Codepolitan was founded in 2016 by Kresna Galuh with the aim of helping the younger generation learn and practice programming languages in order to have competence and be able to compete in the digital era. |
| 9 | Dicoding Indonesia | 6,702,306 | 78,400 | 3–7 videos a month | 1054 | Narenda Wicaksono is the founder and CEO of Dicoding, an education platform for Indonesian software developers consisting of Academy, Challenges, Events, and Job Platforms. |
| 10 | Angga Risky | 10,791,129 | 98,200 | Routinely, this month, it has been 5 months since I uploaded. But more and more, in previous years, have been uploaded regularly | 1125 | Sharing knowledge is what I love, and teaching is where I am at my best because I believe the more I teach, the more I learn. Also, I love providing useful training and being part of a creative community. I have spent a long time watching others learn and teach something new in their field. I want to help you reach your next goal with this online course. I have been teaching for over 4 years. I was a graphic designer when I was 12 years old, I worked as a product lead for a global company to manage teams to create products that benefit customers. I focused on YouTube to train myself to learn and teach the best training for digital media on YouTube. Angga Risky |
Source: observation conducted/these data were updated on 19 January 2025.
3.2. Weighted Product (WP) Method
At the weighted product method stage, which is carried out by calculating the determination of values, criteria weights, alternative data, weight normalization, vector value s, relative preference value v, and, finally, ranking and analysis on channel evaluation and recommendations, the following steps are conducted:
3.2.1. Determination of Criteria Values and Weights
Before determining the weights, a classification of the level of importance was carried out on a scale of 1 to 5 [13]. The classification of importance levels used in this study is presented in Table 3.
Table 3.
Level of importance weight.
In determining the value and weight of the criteria, the following results are obtained. The evaluation criteria for YouTube usage effectiveness, including content relevance, quality of delivery, audiovisual quality, interactivity, frequency of use, access barriers, and impact on understanding, are presented in Table 4. Furthermore, the criteria values and weights used to evaluate YouTube channel recommendations, such as number of views, subscribers, upload frequency, number of videos, and teacher background, are shown in Table 5.
- Value and Weight Criteria for Evaluating the Effectiveness of YouTube Usage
Table 4.
Values and weights of YouTube usage effectiveness evaluation criteria.
Table 4.
Values and weights of YouTube usage effectiveness evaluation criteria.
| Code | Criteria | Weight | Type | Description |
|---|---|---|---|---|
| C1 | Content Relevance | 4 | Benefit | Assess the extent to which the content corresponds to the course topic |
| C2 | Quality of Delivery | 4 | Benefit | Measuring the way the material is presented in the video |
| C3 | Audiovisual Quality | 3 | Benefit | Assess the clarity of sound and images in supporting learning |
| C4 | Interactivity and Engagement | 1 | Benefit | Measure user participation through comments and discussions |
| C5 | Frequency of Use | 3 | Benefit | Monitor how often students use YouTube as a learning resource |
| C6 | Access Barriers | 2 | Cost | Assess accessibility limitations due to technical or internet factors |
| C7 | Impact on Understanding | 5 | Benefit | The main factor in assessing the improvement of student understanding |
- Value and Weight of YouTube Channel Recommendation Criteria
Table 5.
YouTube channel recommendation criteria values and weights.
Table 5.
YouTube channel recommendation criteria values and weights.
| Code | Criteria | Weight | Type | Description |
|---|---|---|---|---|
| C1 | Total Number of Channel Views | 4 | Benefit | Illustrates the popularity and reach of the content |
| C2 | Number of Subscribers | 4 | Benefit | Indicates the level of user trust and loyalty |
| C3 | Frequency of New Content Upload | 5 | Benefit | Assess the channel’s consistency in providing up-to-date materials |
| C4 | Number of Videos Uploaded | 3 | Benefit | Measures the diversity of materials available |
| C5 | Background of Teacher/Content Creator | 2 | Benefit | Assess the credibility of the instructor in the academic or industry field |
Determination of alternative data is used as input data, as well as the following alternative data for channel evaluation and recommendations:
- Alternative Data for Evaluation of the Effectiveness of YouTube Usage
The results of questionnaire interviews conducted with 15 students who used YouTube as a learning medium constitute alternative data in this study. Each student was evaluated based on seven criteria. The alternative data obtained from 15 students who used YouTube as a learning medium, along with their evaluation scores based on seven criteria, are presented in Table 6.
Table 6.
Alternative data for evaluating the effectiveness of YouTube usage.
- YouTube Channel Recommendation Alternative Data
To determine which YouTube channels are most effective as learning media, direct observation was conducted on the 10 YouTube channels most used by Informatics Engineering students. These data were obtained by monitoring student activities and analyzing statistics from the YouTube platform to evaluate the popularity, engagement, and content upload frequency of each channel. The alternative data for YouTube channel recommendations, including values for popularity, engagement, and content consistency of the observed channels, are shown in Table 7.
Table 7.
Alternative data for YouTube channel recommendations.
3.2.2. Weight Normalization Calculation
To obtain a more proportional value in the calculation, the criteria weights are normalized by dividing each weight by the overall weight, as shown in the following calculation:
Calculation of Normalization Weight Evaluation of the Effectiveness of YouTube Use
= 4 + 4 + 3 + 1 + 3 + 2 + 5 = 22
So that the normalized weight for each criterion is:
= = 0.1818
= = 0.1818
= = 0.1364
= = 0.0455
= = 0.1364
= = 0.0909
= = 0.2273
Calculation of Normalization Weight of Best YouTube Channel Recommendations
= 4 + 4 + 5 + 3 + 2 = 18
So that the normalized weight for each criterion is:
= = 0.2222
= = 0.2222
= = 0.2778
= = 0.1667
= = 0.1111
1
3.2.3. Calculating the s Vector Value
After the weights are normalized, the S vector value is calculated by multiplying the value of each alternative by the normalized weight of the criteria concerned. This value is then used to determine the relative preference value V.
- Calculating the S Vector Value of YouTube Usage Effectiveness Evaluation.
The results of the S vector value evaluation of YouTube usage effectiveness and the best YouTube channel recommendations are presented in Table 8 and Table 9, respectively.
(A1) = () () () () () () () = 41.5085
(A2) = () () () () () () () = 37.4739
(A3) = () () () () () () () = 38.2346
(A4) = () () () () () () () = 38.9273
(A5) = () () () () () () () = 41.5085
(A6) = () () () () () () () = 37.0452
(A7) = () () () () () () () = 41.5085
(A8) = () () () () () () () = 28.8122
(A9) = () () () () () () () = 37.0452
(A10) = () () () () () () () = 37.6686
(A11) = () () () () () () () = 35.4508
(A12) = () () () () () () () = 41.3524
(A13) = () () () () () () () = 39.8380
(A14) = () () () () () () () = 32.9815
(A15) = () () () () () () () = 39.8380
= 569.1663
Table 8.
Results of S vector value evaluation of effectiveness of YouTube usage.
Table 8.
Results of S vector value evaluation of effectiveness of YouTube usage.
| Alternative | S Value |
|---|---|
| A1 | 41.5085 |
| A2 | 37.4739 |
| A3 | 38.2346 |
| A4 | 38.9273 |
| A5 | 41.5085 |
| A6 | 37.0452 |
| A7 | 41.5085 |
| A8 | 28.8122 |
| A9 | 37.0452 |
| A10 | 37.6686 |
| A11 | 35.4508 |
| A12 | 41.3254 |
| A13 | 39.8380 |
| A14 | 32.9815 |
| A15 | 39.8380 |
| Total | 566.9485 |
- Calculating the S Vector Value of Best YouTube Channel Recommendations
(B1) = ()() ()() () = 61.9225
(B2) = ()() ()() () = 58.7255
(B3) = ()() ()() () = 90.9784
(B4) = ()() ()() () = 86.3895
(B5) = ()() ()() () = 67.0512
(B6) = ()() ()() () = 69.3375
(B7) = ()() ()() () = 40.2371
(B8) = ()() ()() () = 81.4005
(B9) = ()() ()() () = 66.4321
(B10) = ()() ()() () = 93.2552
= 715.7293
Table 9.
Results of S vector value of best YouTube channel recommendations.
Table 9.
Results of S vector value of best YouTube channel recommendations.
| Alternative | S Value |
|---|---|
| B1 | 388.8272 |
| B2 | 403.6393 |
| B3 | 677.6289 |
| B4 | 593.7828 |
| B5 | 267.3913 |
| B6 | 435.3879 |
| B7 | 276.5623 |
| B8 | 559.4920 |
| B9 | 264.9223 |
| B10 | 694.5864 |
| Total | 4562.2203 |
3.2.4. Calculating the Relative Preference Value V
After obtaining the S value, the calculation of the relative preference value of V on the evaluation and recommendation is carried out. The results of the relative preference values (V) for YouTube usage effectiveness and the best YouTube channel recommendations are presented in Table 10 and Table 11, respectively.
- Calculating Relative Preference Value V Evaluation of Effectiveness of YouTube Usage
= = 0.0729
= = 0.0658
= = 0.0672
= = 0.0684
= = 0.0729
= = 0.0651
= = 0.0729
= = 0.0506
= = 0.0651
= = 0.0662
= = 0.0623
= = 0.0726
= = 0.0700
= = 0.0579
= = 0.0700
Table 10.
Results of relative preference value V evaluation of effectiveness of YouTube usage.
Table 10.
Results of relative preference value V evaluation of effectiveness of YouTube usage.
| Alternative | Value V |
|---|---|
| A1 | 0.0729 |
| A2 | 0.0658 |
| A3 | 0.0672 |
| A4 | 0.0684 |
| A5 | 0.0729 |
| A6 | 0.0651 |
| A7 | 0.0729 |
| A8 | 0.0506 |
| A9 | 0.0651 |
| A10 | 0.0662 |
| A11 | 0.0623 |
| A12 | 0.0726 |
| A13 | 0.0700 |
| A14 | 0.0579 |
| A15 | 0.0700 |
| Total | 1 |
- Calculating Relative Preference Values for Best YouTube Channel Recommendations
= = 0.0865
= = 0.0820
= = 0.1271
= = 0.1207
= = 0.0937
= = 0.0969
= = 0.0562
= = 0.1137
= = 0.0928
= = 0.1303
Table 11.
Results of Relative Preference Values V Best YouTube Channel Recommendations.
Table 11.
Results of Relative Preference Values V Best YouTube Channel Recommendations.
| Alternative | Value V |
|---|---|
| B1 | 0.0865 |
| B2 | 0.0820 |
| B3 | 0.1271 |
| B4 | 0.1207 |
| B5 | 0.0937 |
| B6 | 0.0969 |
| B7 | 0.0562 |
| B8 | 0.1137 |
| B9 | 0.0928 |
| B10 | 0.1303 |
| Total | 1 |
3.2.5. Ranking and Analysis
Based on the V vector value, ranking is done to determine the evaluation and recommendation of YouTube as a learning medium for each student. The higher the V value, the more effective students are in utilizing YouTube as a learning resource.
- Ranking and Analysis of YouTube Usage Effectiveness Evaluation
The ranking results show that students with higher V scores have a greater propensity to learn through YouTube compared to students with lower V scores. Compared to other criteria, Impact on Understanding (C7) has the greatest influence in this calculation. The ranking and evaluation analysis results of YouTube usage effectiveness are presented in Table 12.
Table 12.
The Result of Ranking and Evaluation Analysis of YouTube Usage Effectiveness.
- Ranking and Analysis of Best YouTube Channel Recommendations
Ranking is done based on the V value to determine how effective each YouTube channel is in helping students learn. A higher V-value indicates that the channel provides useful learning materials for students. The ranking results and analysis of the best YouTube channel recommendations are shown in Table 13.
Table 13.
Ranking results and analysis of best YouTube channel recommendations.
3.3. Implementation of Decision Support System
At this stage, The implementation results of the Decision Support System are shown in Figure 2, which illustrates several interface menus including the login view, front page, effectiveness evaluation display, criteria and weighting display, alternative data display, calculation result display, and evaluation result display.
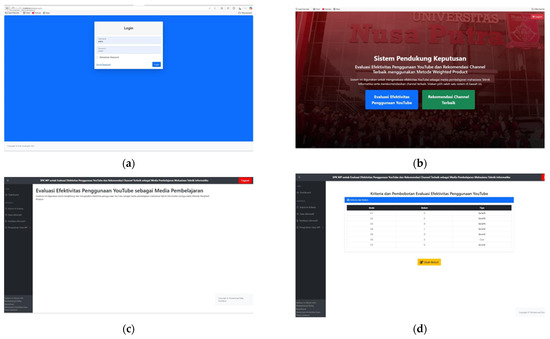
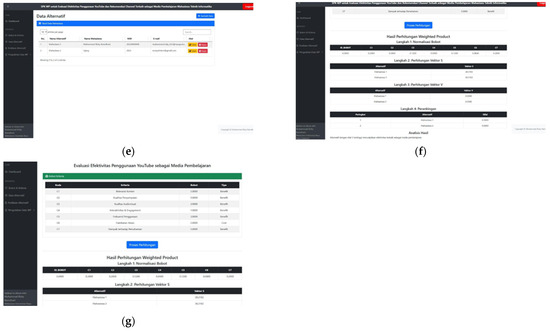
Figure 2.
(a) Implementation of Login View, (b) Front Page Display Implementation, (c) Implementation of Effectiveness Evaluation Display, (d) Implementation of Criteria and Weighting Display, (e) Implementation of Alternative Data Display, (f) Implementation of WP Calculation Result Display, (g) Implementation of the Display of Effectiveness Evaluation Calculation Results.
4. Conclusions
The main conclusion of this research is that YouTube has proven to be an effective learning medium for Informatics Engineering students, especially if used by selecting relevant and quality channels. This is in line with the results of previous research by Abdillah (2017) showing that the use of YouTube in Information Technology lecture material can create a conducive learning environment and increase student understanding in their field of study [3]. The Weighted Product (WP) method successfully provides the best channel recommendations based on predetermined criteria so that it can help students in utilizing YouTube optimally to support their learning process. In the evaluation results, Students with the highest scores, A1, A5, and A7, are ranked top with a relative preference (V) value of 0.0729. This indicates that they effectively utilize YouTube as an additional learning resource. The main contributing factor is Impact on Understanding (C7) with the highest weight (5), which means YouTube really helps them in understanding the theoretical and practical concepts taught in lectures. As for channel recommendations, UNPAS Web Programming (B10) is ranked first with a V value of 0.1522. This channel excels in the criteria of Total Number of Views (C1), Number of Subscribers (C2), and Upload Frequency (C3) and has a credible teaching background (Sandhika Galih, IT Lecturer at Pasundan University). The content that focuses on web development and internet technology is very relevant to the needs of Informatics Engineering students. This study is in line with various previous studies that show that YouTube is a useful and effective learning medium. Among them, Micolich (2008) suggested that YouTube has great potential as a film archive for lecturers in the 21st century, which can be used as a teaching resource [14]. Islam (2024) revealed that educational technology plays a role in facilitating learning and improving performance through the creation, utilization, and proper management of technological resources [15]. Millati (2021) emphasized that educational technology plays a significant role in the independent learning program in the 4.0 era, improving the quality of education by providing freedom to innovate and learn independently [16].
Author Contributions
Conceptualization, A.F.; methodology, M.R.R., R.F. and D.R.; software, M.R.R. and R.F.; validation, A.F.; formal analysis, M.R.R. and D.R.; investigation, M.R.R., R.F. and D.R.; resources, D.R.; data curation, M.R.R. and R.F.; writing—original draft preparation, L.S.P. and A.F.; writing—review and editing, L.S.P. and A.F.; visualization, A.F.; supervision, A.F.; project administration, L.S.P. and A.F. All authors have read and agreed to the published version of the manuscript.
Funding
This research received no external funding.
Institutional Review Board Statement
Ethical review and approval were waived for this study due to the use of anonymized survey data collected from students for academic purposes, which does not involve intervention or sensitive personal information.
Informed Consent Statement
Informed consent was obtained from all subjects involved in the study. Written informed consent has been obtained from the participant(s) to publish this paper.
Data Availability Statement
The data supporting the findings of this study are stored in the Decision Support System developed by the authors. The data are not publicly available due to system access restrictions but can be obtained from the corresponding author upon reasonable request.
Conflicts of Interest
The authors declare no conflict of interest.
References
- Burgess, J.; Green, J. YouTube: Online Video and Participatory Culture; Polity Press: Cambridge, UK, 2018. [Google Scholar]
- Snickars, P.; Vonderau, P. The YouTube Reader; National Library of Sweden: Stockholm, Sweden, 2009. [Google Scholar]
- Abdillah, L.A. Enriching information technology course materials by using YouTube. arXiv 2017, arXiv:1708.04878. [Google Scholar] [CrossRef]
- Wahyuni, J.S.; Haryadi; Nuryatin, A. The Effectiveness of Using Video-Based Learning Media via the Rumah Belajar Website on Explanatory Text Material. Silampari Bisa J. Penelit. Pendidik. Bhs. Indones. Drh. Dan Asing 2022, 5, 22–32. (In Indonesian) [Google Scholar] [CrossRef]
- Rahmatika, R.; Yusuf, M.; Agung, L. The Effectiveness of YouTube as an Online Learning Media. J. Educ. Technol. 2021, 5, 152–158. [Google Scholar] [CrossRef]
- YouTube. About YouTube. Available online: https://www.youtube.com/about/ (accessed on 10 September 2024).
- Saunders, M.N.K.; Lewis, P.; Thornhill, A. Research Methods for Business Students, 8th ed.; Pearson Education: Harlow, UK, 2019. [Google Scholar]
- Sabti Septarini, R.; Taufiq, R.; Al Fattah, S. The Implementation of Weighted Products in the Support System of Scholarship Acceptance Decisions at the MA Al-Falahiyah Al-Asytari. J. Inform. Univ. Pamulang 2020, 5, 438–444. [Google Scholar] [CrossRef]
- Fernandez, S.; Prihantoro, C.; Hidayah, A.K. Implementation of Weighted Product on the selection of the best lecturer at Universitas Muhammadiyah Bengkulu. Pseudocode 2021, 8, 126–133. [Google Scholar] [CrossRef]
- Satriani, L.J.; Wulandari, H.A.; Arifa, P.N.; Tahyudin, I. The Weighted Product Method in the DSS for Employee Rewards at the Cosmetics Warehouse. IOTA 2022, 2, 188–197. [Google Scholar] [CrossRef]
- Herdiansah, A.; Handayani, N.; Kurniawan, A. A Development of Decision Support Systems Selection of Employee Acceptance Using Weighted Product Method. Journalisi 2019, 1, 87–97. [Google Scholar] [CrossRef]
- GeeksforGeeks. Waterfall Model—Software Engineering. Available online: https://www.geeksforgeeks.org/waterfall-model/ (accessed on 10 September 2024).
- Sugiyono. Quantitative, Qualitative, and R&D Research Methods; Alfabeta: Bandung, Indonesia, 2020. [Google Scholar]
- Micolich, A.P. The latent potential of YouTube—Will it become the 21st century lecturer’s film archive? arXiv 2008, arXiv:0808.3441. [Google Scholar]
- Islam, M.H.; Nayeem, M.A.; Liton, M.I.A.; Sizan, J.J.; Sadik, S. The Role of Educational Technology in Enhancing Learning in Developing Countries. J. Sci. Rep. 2024, 7, 197–212. [Google Scholar] [CrossRef]
- Widiyono, A.; Millati, I. The Role of Educational Technology in the Perspective of Independent Learning in the 4.0 Era. JET 2021, 2, 1–9. (In Indonesian) [Google Scholar] [CrossRef]


Disclaimer/Publisher’s Note: The statements, opinions and data contained in all publications are solely those of the individual author(s) and contributor(s) and not of MDPI and/or the editor(s). MDPI and/or the editor(s) disclaim responsibility for any injury to people or property resulting from any ideas, methods, instructions or products referred to in the content. |
© 2025 by the authors. Licensee MDPI, Basel, Switzerland. This article is an open access article distributed under the terms and conditions of the Creative Commons Attribution (CC BY) license (https://creativecommons.org/licenses/by/4.0/).