1. Introduction
The rapidly growing expansion of the biomedical literature marks the importance of research in finding advanced tools for efficient information extraction. Biomedical text mining, which encompasses tasks like named entity recognition (NER), relation extraction (RE), and question answering (QA), is pivotal in managing this deluge of data. The traditional natural language processing (NLP) models, primarily trained on general domain corpora, often underperform when applied to biomedical texts due to domain-specific terminology.
Recently, BioBERT (Bidirectional Encoder Representations from Transformers for Biomedical Text Mining) was introduced as a domain-specific adaptation of the BERT model. While BERT demonstrated significant success in general NLP tasks, its application to biomedical texts revealed limitations. BioBERT was pretrained on large-scale biomedical corpora, including PubMed abstracts and PubMed Central full-text articles, enabling it to capture the intricacies of biomedical language.
As shown in
Figure 1, BioBERT’s domain-specific pretraining led to substantial improvements in various biomedical NLP tasks. For instance, in biomedical NER, BioBERT achieved a 1.86% absolute improvement over BERT. Similarly, in biomedical RE, it outperformed BERT by 3.33%, and in biomedical QA, it surpassed BERT by 9.61%. These enhancements underscore the importance of domain-specific pretraining in adapting general NLP models to specialized fields.
The success of BioBERT has spurred further research into domain-specific language models. Studies have shown that pretraining language models from scratch on domain-specific corpora, rather than fine-tuning general domain models, can lead to even greater performance gains. This approach has been particularly effective in biomedicine, where specialized knowledge is crucial for accurate interpretation.
Using this as a motivation for our research work, we explore the application of BioBERT in an unsupervised analysis of electrocardiogram (ECG) clinical reports, a direction that remains largely underexplored. Unlike prior works that focus on supervised learning tasks, our study looks into how pretrained biomedical language models can be utilized for unsupervised clustering, visualization, and interpretation of free-text ECG narratives.
This paper makes the following contributions:
We designed an unsupervised pipeline that uses BioBERT to generate dense vector embeddings of ECG report texts, enabling semantic representation of medical narratives.
We evaluated and compared multiple clustering techniques—including KMeans, hierarchical clustering, Density-Based Spatial Clustering of Applications with Noise (DBSCAN), and Partitioning Around Medoids (K-Medoids), on the BioBERT embeddings, providing insights into the latent structure and grouping patterns in ECG narratives.
We introduced a combination of t-Distributed Stochastic Neighbor Embedding t-(SNE) visualizations, token graphs, and word cloud generation per cluster to interpret the themes and vocabulary associated with each discovered cluster, enhancing transparency and clinical relevance.
The remainder of this paper is organized as follows:
Section 2 reviews relevant literature on biomedical NLP and the role of domain-specific language models.
Section 3 details the dataset, pre-processing, and methodology, including the embedding and clustering pipeline.
Section 4 presents the experimental results, visualizations, and evaluation metrics.
Section 5 discusses key findings, clinical implications, and limitations. Finally,
Section 6 concludes the paper and outlines future research directions.
2. Literature Review
In the last decade, the intersection of NLP and healthcare has opened up new horizons of clinical text data analysis. Clinical texts such as discharge summaries, radiology reports, and ECG or Electroencephalography (EEG) interpretations often contain dense biomedical language that exceeds general domain NLP capabilities. To offset this limitation, the NLP community has moved more and more towards domain-specific pretraining of language models.
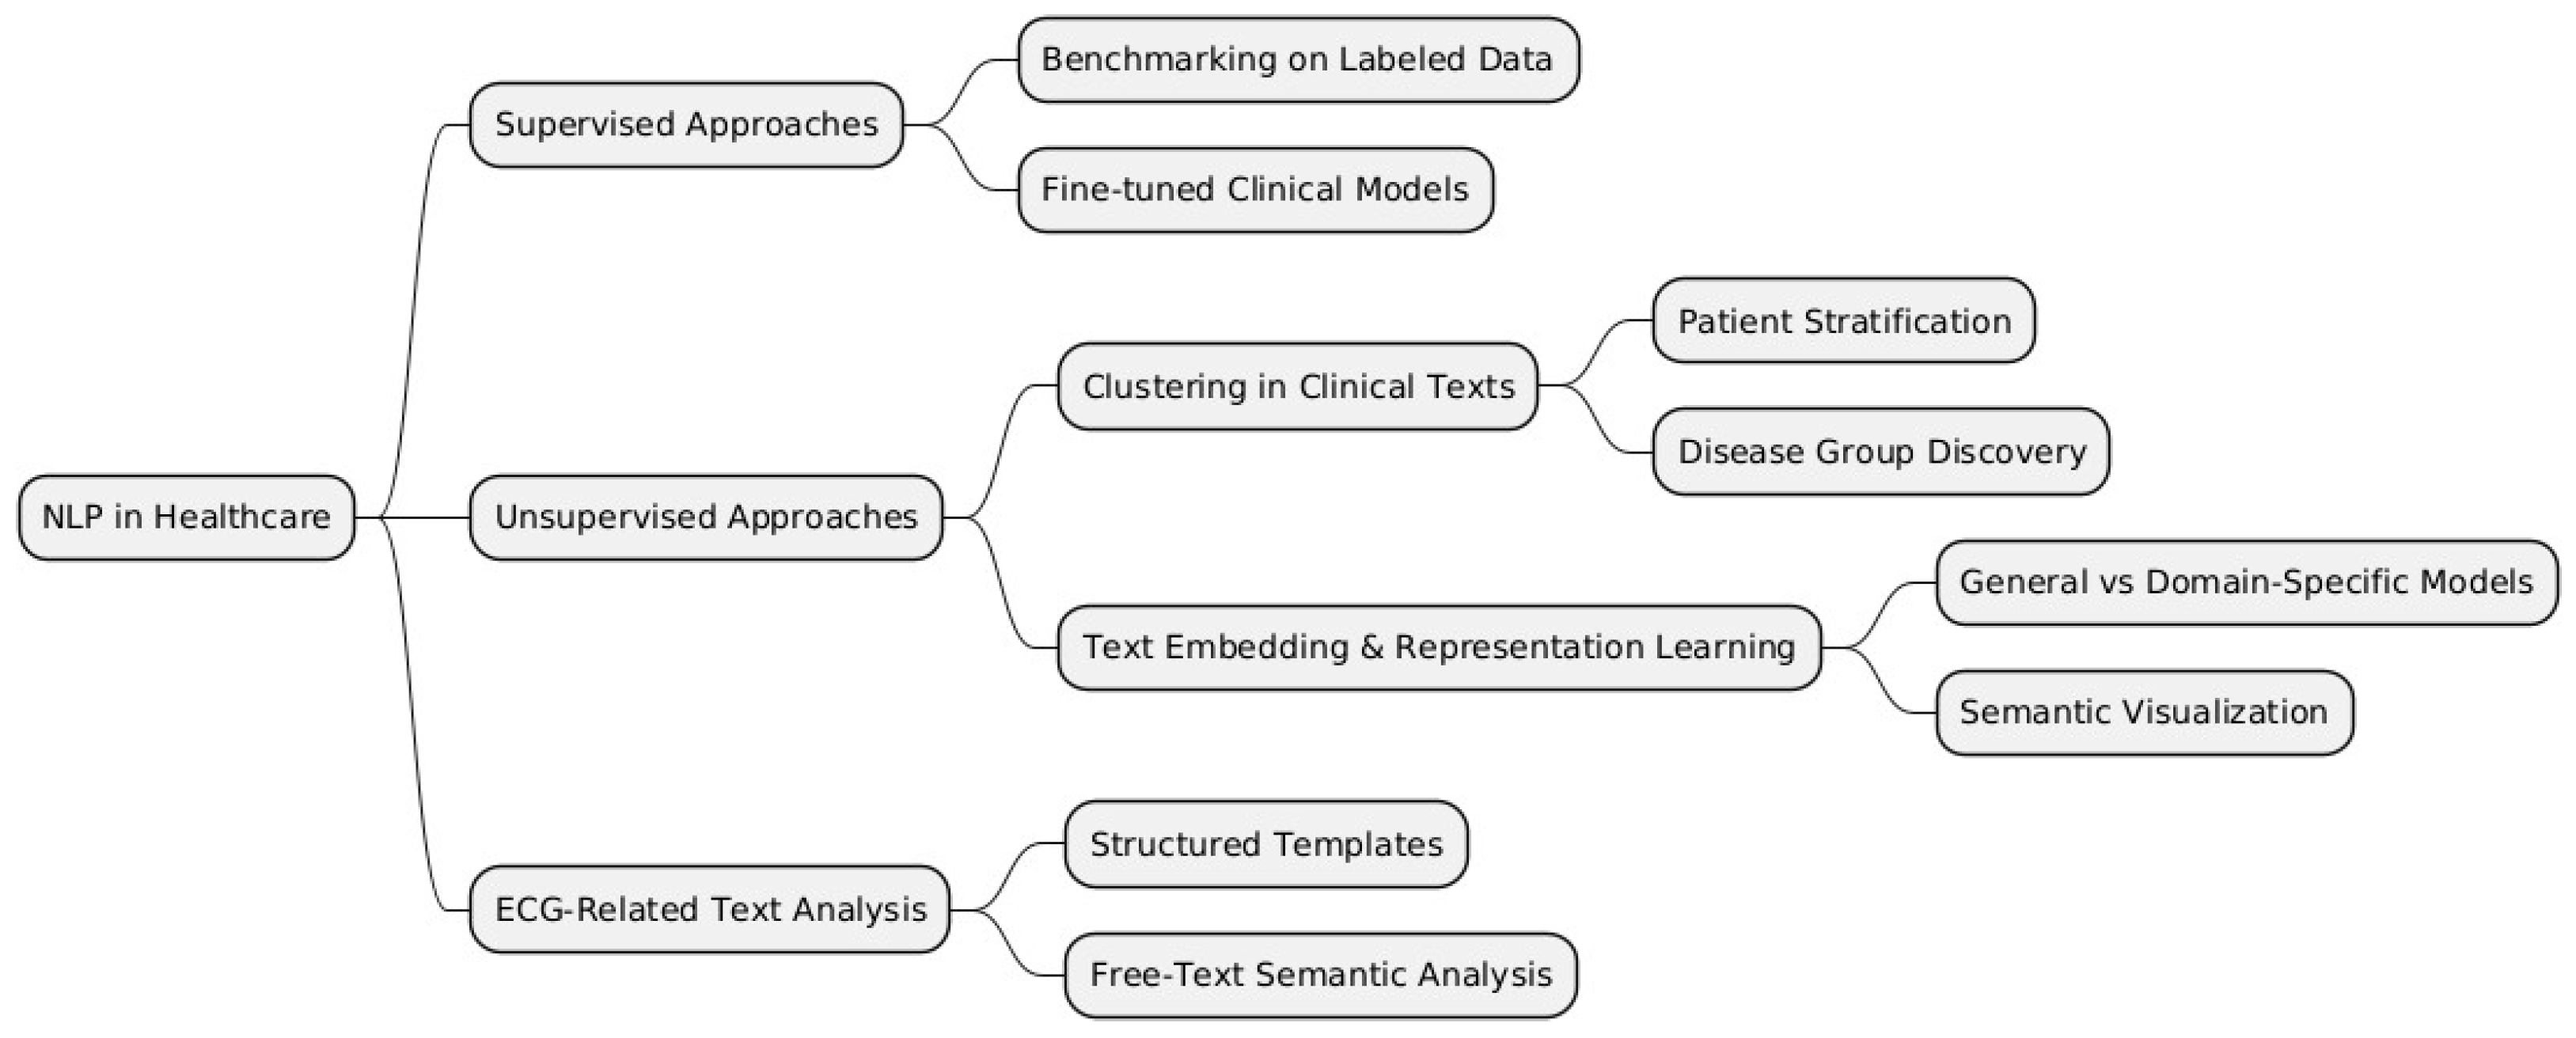
To structure the various methodologies and applications of NLP in healthcare, we categorize them into supervised, unsupervised, and domain-specific approaches, such as ECG-related text analysis.
Figure 2 below provides a visual representation of these categories and their respective subcategories, which will be further discussed in this literature review.
Domain-specific models like BioBERT [
1], ClinicalBERT [
2], and PubMedBERT [
3] were introduced to bridge the semantic gap between general language understanding and biomedical literature. These models showed substantial improvements over BERT in tasks like NER, QA, and RE. However, most of this work focuses on supervised learning using curated datasets such as BC5CDR [
4], i2b2 2010 [
5], and BioASQ [
6]. While informative, these datasets represent controlled environments, and the models often require labeled data, which is scarce in real-world clinical applications.
Hence, biomedical NLP has been heavily influenced by the development and use of pretrained language models customized to the special terminology and structure of biomedical texts. These specially trained models, optimized for the unique words and features of biomedical texts, have delivered staggering improvements on a wide variety of NLP tasks, including NER, RE, and QA.
Traditional NLP models such as BERT are pretrained primarily on general domain corpora, where performance degradation is common when applied in specialized domains such as biomedicine. A marked milestone was BioBERT, whereby pretraining BERT on large-scale biomedical corpora, such as PubMed abstracts and full-text articles in PubMed Central (PMC), enabled BioBERT to acquire knowledge specific to the medical domain and achieve significant performance gains over general domain models.
Subsequent to this, more recent studies have explored the benefit of pretraining models from scratch over domain-specific corpora. In [
3], the authors demonstrated that simply training language models on biomedical texts alone, without pretraining them on general domain texts, can result in an improved performance on a variety of biomedical NLP tasks. This finding indicates the importance of domain-specific data in enhancing model performance.
Biomedical NER involves identifying and classifying entities such as genes, proteins, and diseases within text. Early attempts at applying general domain NER models to biomedical texts were met with limited success due to the specialized terminology and context. The adaptation of BERT to BioBERT addressed this challenge, leading to an improved recognition of biomedical entities.
Recent studies have further refined NER tasks by incorporating advanced techniques. For instance, ref. [
7] evaluated BioBERT’s performance in medical NER and found it to outperform other models like ClinicalBERT and SciBERT, highlighting its effectiveness in understanding complex medical terminology.
In machine learning, unsupervised methods provide an attractive alternative for settings where annotations are limited. Clustering algorithms such as KMeans [
8], DBSCAN [
9], and agglomerative clustering [
10] have been applied in healthcare to group patients [
11,
12,
13], discover disease subtypes [
14], and categorize clinical notes [
15]. These methods can uncover latent structures without relying on labels. However, they depend heavily on meaningful feature representations, which recent biomedical transformers now enable.
In the last few years, several studies have employed embeddings from models based on transformers to power downstream unsupervised tasks [
16,
17]. In particular, models with domain-specific embeddings improve cluster cohesion and separation. Nonetheless, limited work has applied such approaches to ECG-related clinical notes or diagnostic text reports, which are typically noisy, heterogeneous, and domain-rich. This makes our use of BioBERT as a semantic encoder for unsupervised clustering on custom ECG report data novel in its application.
Until now, the work on ECG data has predominantly focused on signal processing or image classification [
18,
19,
20], with far less attention to the textual narratives associated with ECG readings. A few studies have explored the structured representation of ECG interpretations using rule-based or template-matching approaches [
21]. However, end-to-end NLP pipelines applied to ECG free-text reports remain limited. This presents a research gap, especially when paired with the clustering of semantic embeddings for knowledge discovery.
Although biomedical transformers and clustering have been individually explored, their combined use in clinical free-text clustering remains underaddressed. Additionally, most existing work assumes access to well-labeled corpora. Limited exploration of pipelines designed to operate on raw, domain-specific, and unlabeled medical records is available, especially those that integrate embedding generation, dimensionality reduction, clustering, and interpretability tools in a single workflow.
3. Methodology
In this study, we apply unsupervised machine learning techniques to cluster ECG text reports from the MIMIC IV dataset. The objective is to explore patterns in the reports through the application of various clustering algorithms, dimensionality reduction techniques, and the visualization of the results. We also investigate token-level clustering using NLP embeddings and produce visual representations like t-SNE plots and word clouds to enhance our understanding of the clusters. The methodology involves multiple stages, from data pre-processing to model evaluation. Each section will explain the steps followed in detail.
3.1. Data Pre-Processing and Preparation
3.1.1. Data Acquisition
The data used in this study comes from the MIMIC IV ECG dataset, which includes machine-generated ECG reports. These reports are in text form, and the task is to group them into similar clusters based on their content. The dataset includes several columns representing different aspects of the ECG report, such as report_0, report_1, etc.
3.1.2. Combining Report Columns
The raw dataset contains multiple report columns (from report_0 to report_8). Each row in the dataset may have some missing values in these columns. To overcome this, we concatenate the content of all available report columns into one comprehensive column, full_report, that combines all the text from these columns into a single string. If the column contains missing data (NaN / Null values), it is replaced by an empty string (“”). This combined report column serves as the input for further analysis and embedding generation, as shown in
Figure 3. The code for the function to encode the text embedding is shown in
Figure 4.
3.2. Text Embedding Generation
3.2.1. Transformer Model Selection
To capture the semantic meaning of ECG reports, we implemented the BioBERT model, which is specifically trained for biomedical text data. BioBERT has been pretrained on large biomedical corpora, making it particularly suitable for processing medical text data like ECG reports.
We use the AutoTokenizer and AutoModel from the Hugging Face transformers library (version 4.30.0) to load BioBERT and tokenize the text data. The tokenizer splits the text into smaller subword units, while the model generates embeddings that represent the meaning of the text.
3.2.2. Encoding Texts into Embeddings
We define a function, encode_texts, to generate embeddings for all the ECG reports. The function splits the data into batches, tokenizes each batch, and passes the tokens through the BioBERT model to obtain the embeddings. These embeddings are extracted from the [CLS] token, which is the representation of the entire sentence in BERT-based models.
The embeddings are generated for the entire corpus of reports and stacked into a single matrix.
3.2.3. Standardization of Embeddings
The generated embeddings are scaled to have zero mean and unit variance, which ensures that no individual feature dominates the clustering process due to differences in scale. We apply StandardScaler to standardize the embeddings before clustering.
3.3. Clustering Algorithms
In this study, we explore three different clustering algorithms: KMeans, Agglomerative Clustering, and DBSCAN. Each of these algorithms has its strengths and weaknesses in grouping the data based on the structure and density of the clusters.
3.3.1. KMeans Clustering
KMeans clustering partitions the data into a predefined number of clusters (k). It is a centroid-based algorithm, meaning that each cluster is represented by its centroid, and the algorithm iteratively refines the centroids to minimize the distance to the data points assigned to that cluster. We select a fixed number of clusters (n_clusters = 10), though this number can be optimized through methods like the elbow method.
3.3.2. Agglomerative Clustering
Agglomerative clustering is a hierarchical clustering algorithm that builds the hierarchy bottom-up by merging clusters based on a similarity measure. Unlike KMeans, it does not require the number of clusters to be specified upfront. We choose a fixed number of clusters for consistency in comparison.
3.3.3. DBSCAN Clustering
DBSCAN (Density-Based Spatial Clustering of Applications with Noise) is a density-based clustering algorithm. It does not require a predefined number of clusters and instead identifies clusters as dense regions in the data space. It also allows for the identification of noise points, which do not belong to any cluster.
3.3.4. Evaluation of Clusters
We visualize the clustering results using t-SNE, a dimensionality reduction technique that projects high-dimensional data into two or three dimensions while maintaining the structure of the data. This allows us to inspect the quality of the clusters visually.
3.4. Token Graph and Visualization
3.4.1. Token Graph Construction
To further investigate the structure of the reports, we build a token co-occurrence graph, where tokens represent nodes and co-occurrences between tokens form edges. This allows us to explore the relationships between frequently occurring tokens and visualize them.
3.4.2. Token Graph Visualization
The token graph is visualized using NetworkX, where the node sizes correspond to the frequency of tokens, and the edge weights represent the strength of co-occurrence between token pairs.
3.5. Word Cloud Generation
Finally, we generate word clouds to visualize the most frequent tokens within each cluster. Word clouds provide a useful way to see which terms dominate a particular cluster of reports. We use the WordCloud package to generate the visualizations.
4. Results
The clustering analysis of ECG text reports using unsupervised learning techniques yielded several insights across different algorithmic approaches. Initially, we encoded the textual data using the BioBERT model, which generated high-dimensional embeddings representing the semantic content of each report. These embeddings were then standardized and used as inputs for three clustering algorithms: KMeans, Agglomerative Clustering, and DBSCAN.
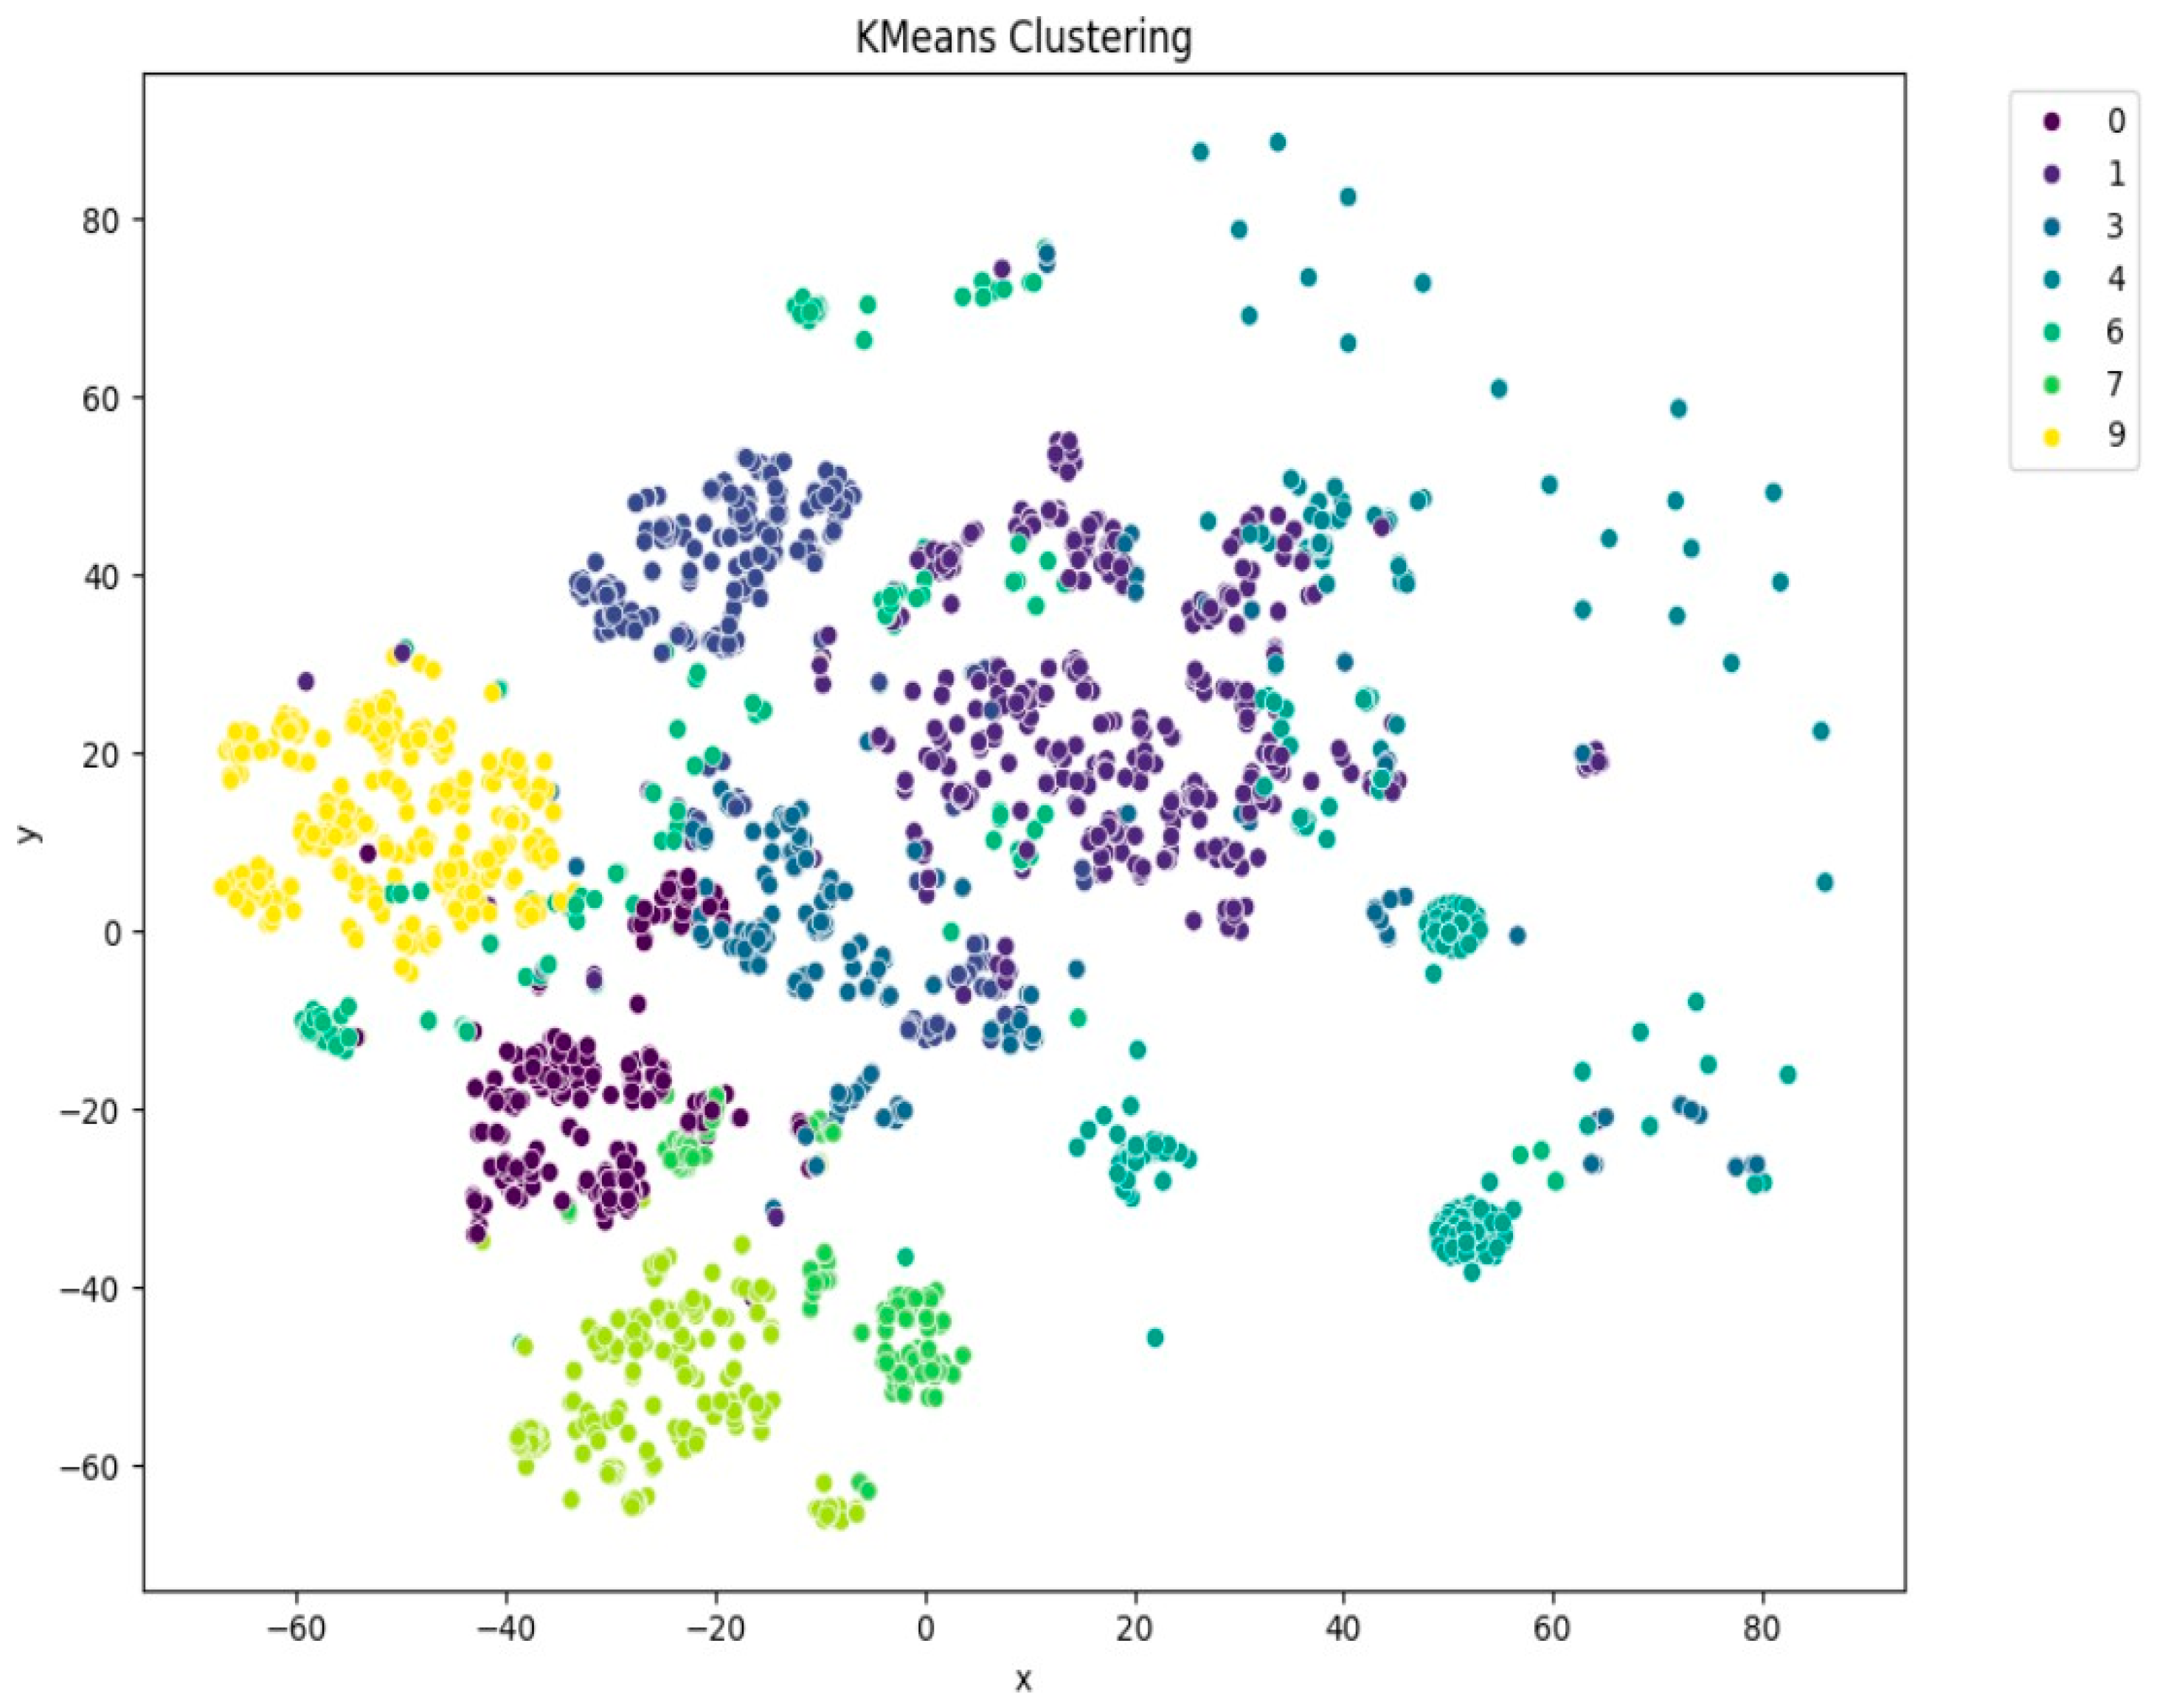
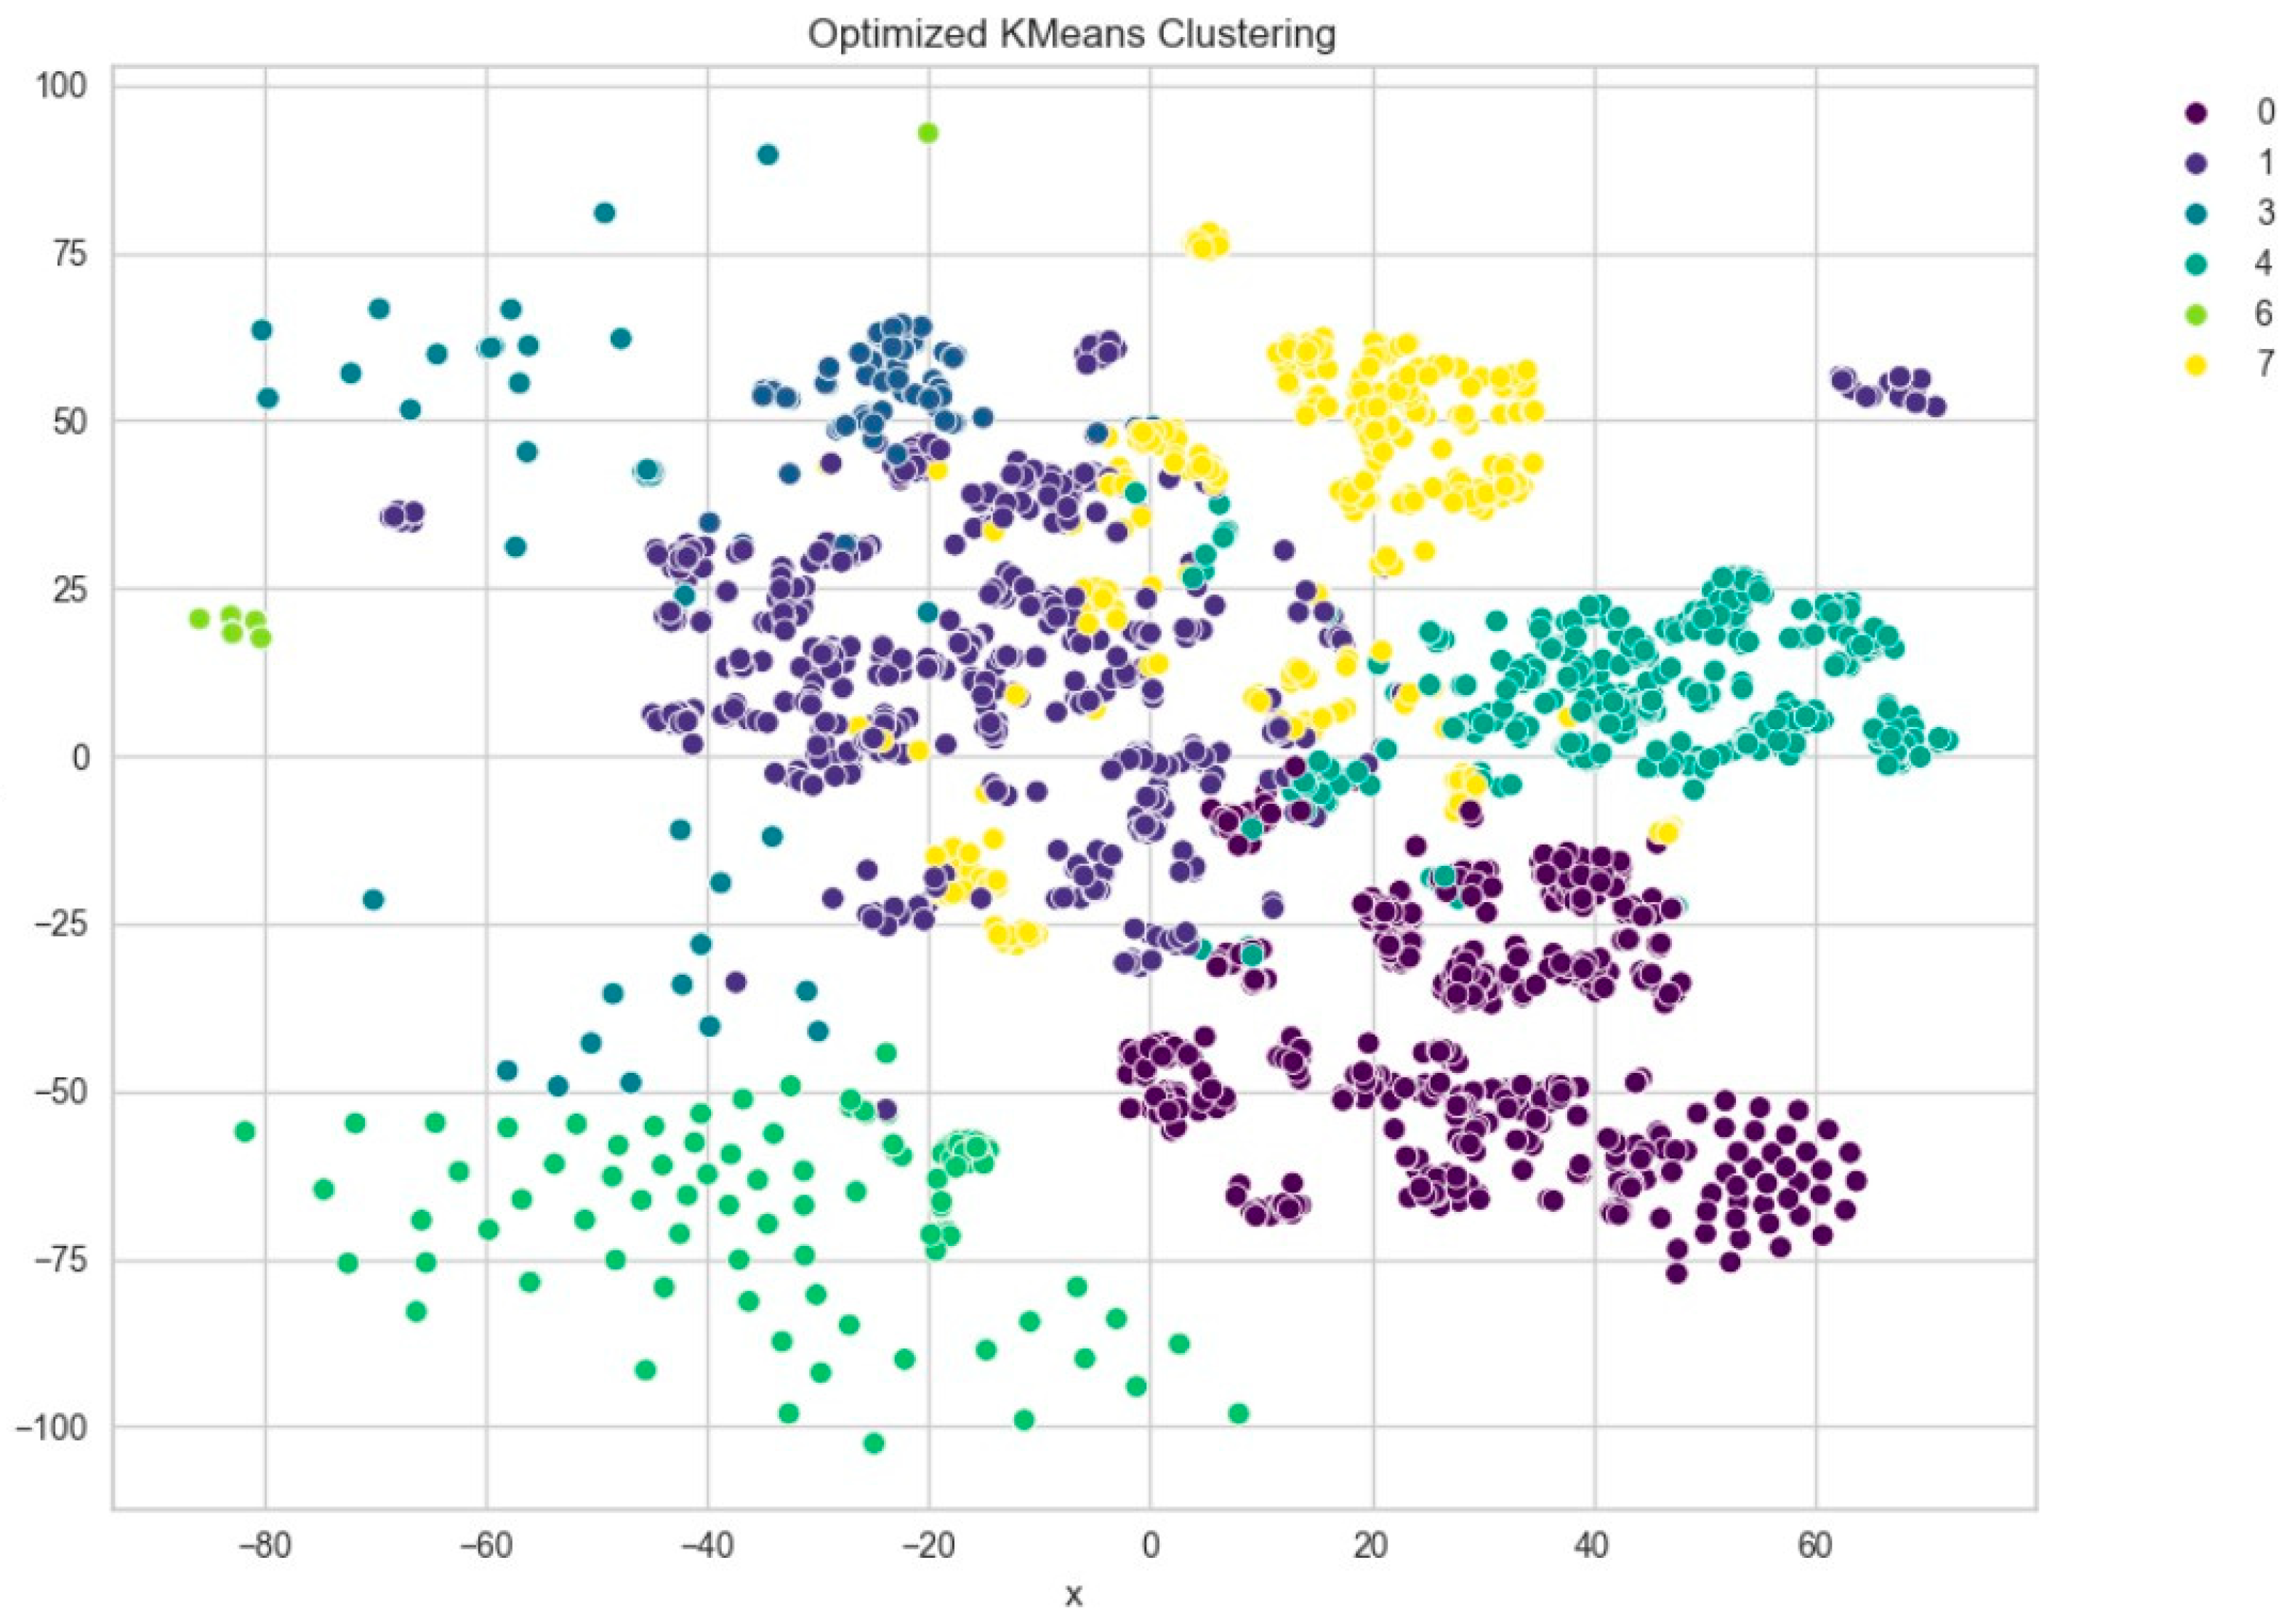
Among the clustering methods, KMeans with 10 clusters produced the most interpretable and well-separated groups in the t-SNE visualizations (
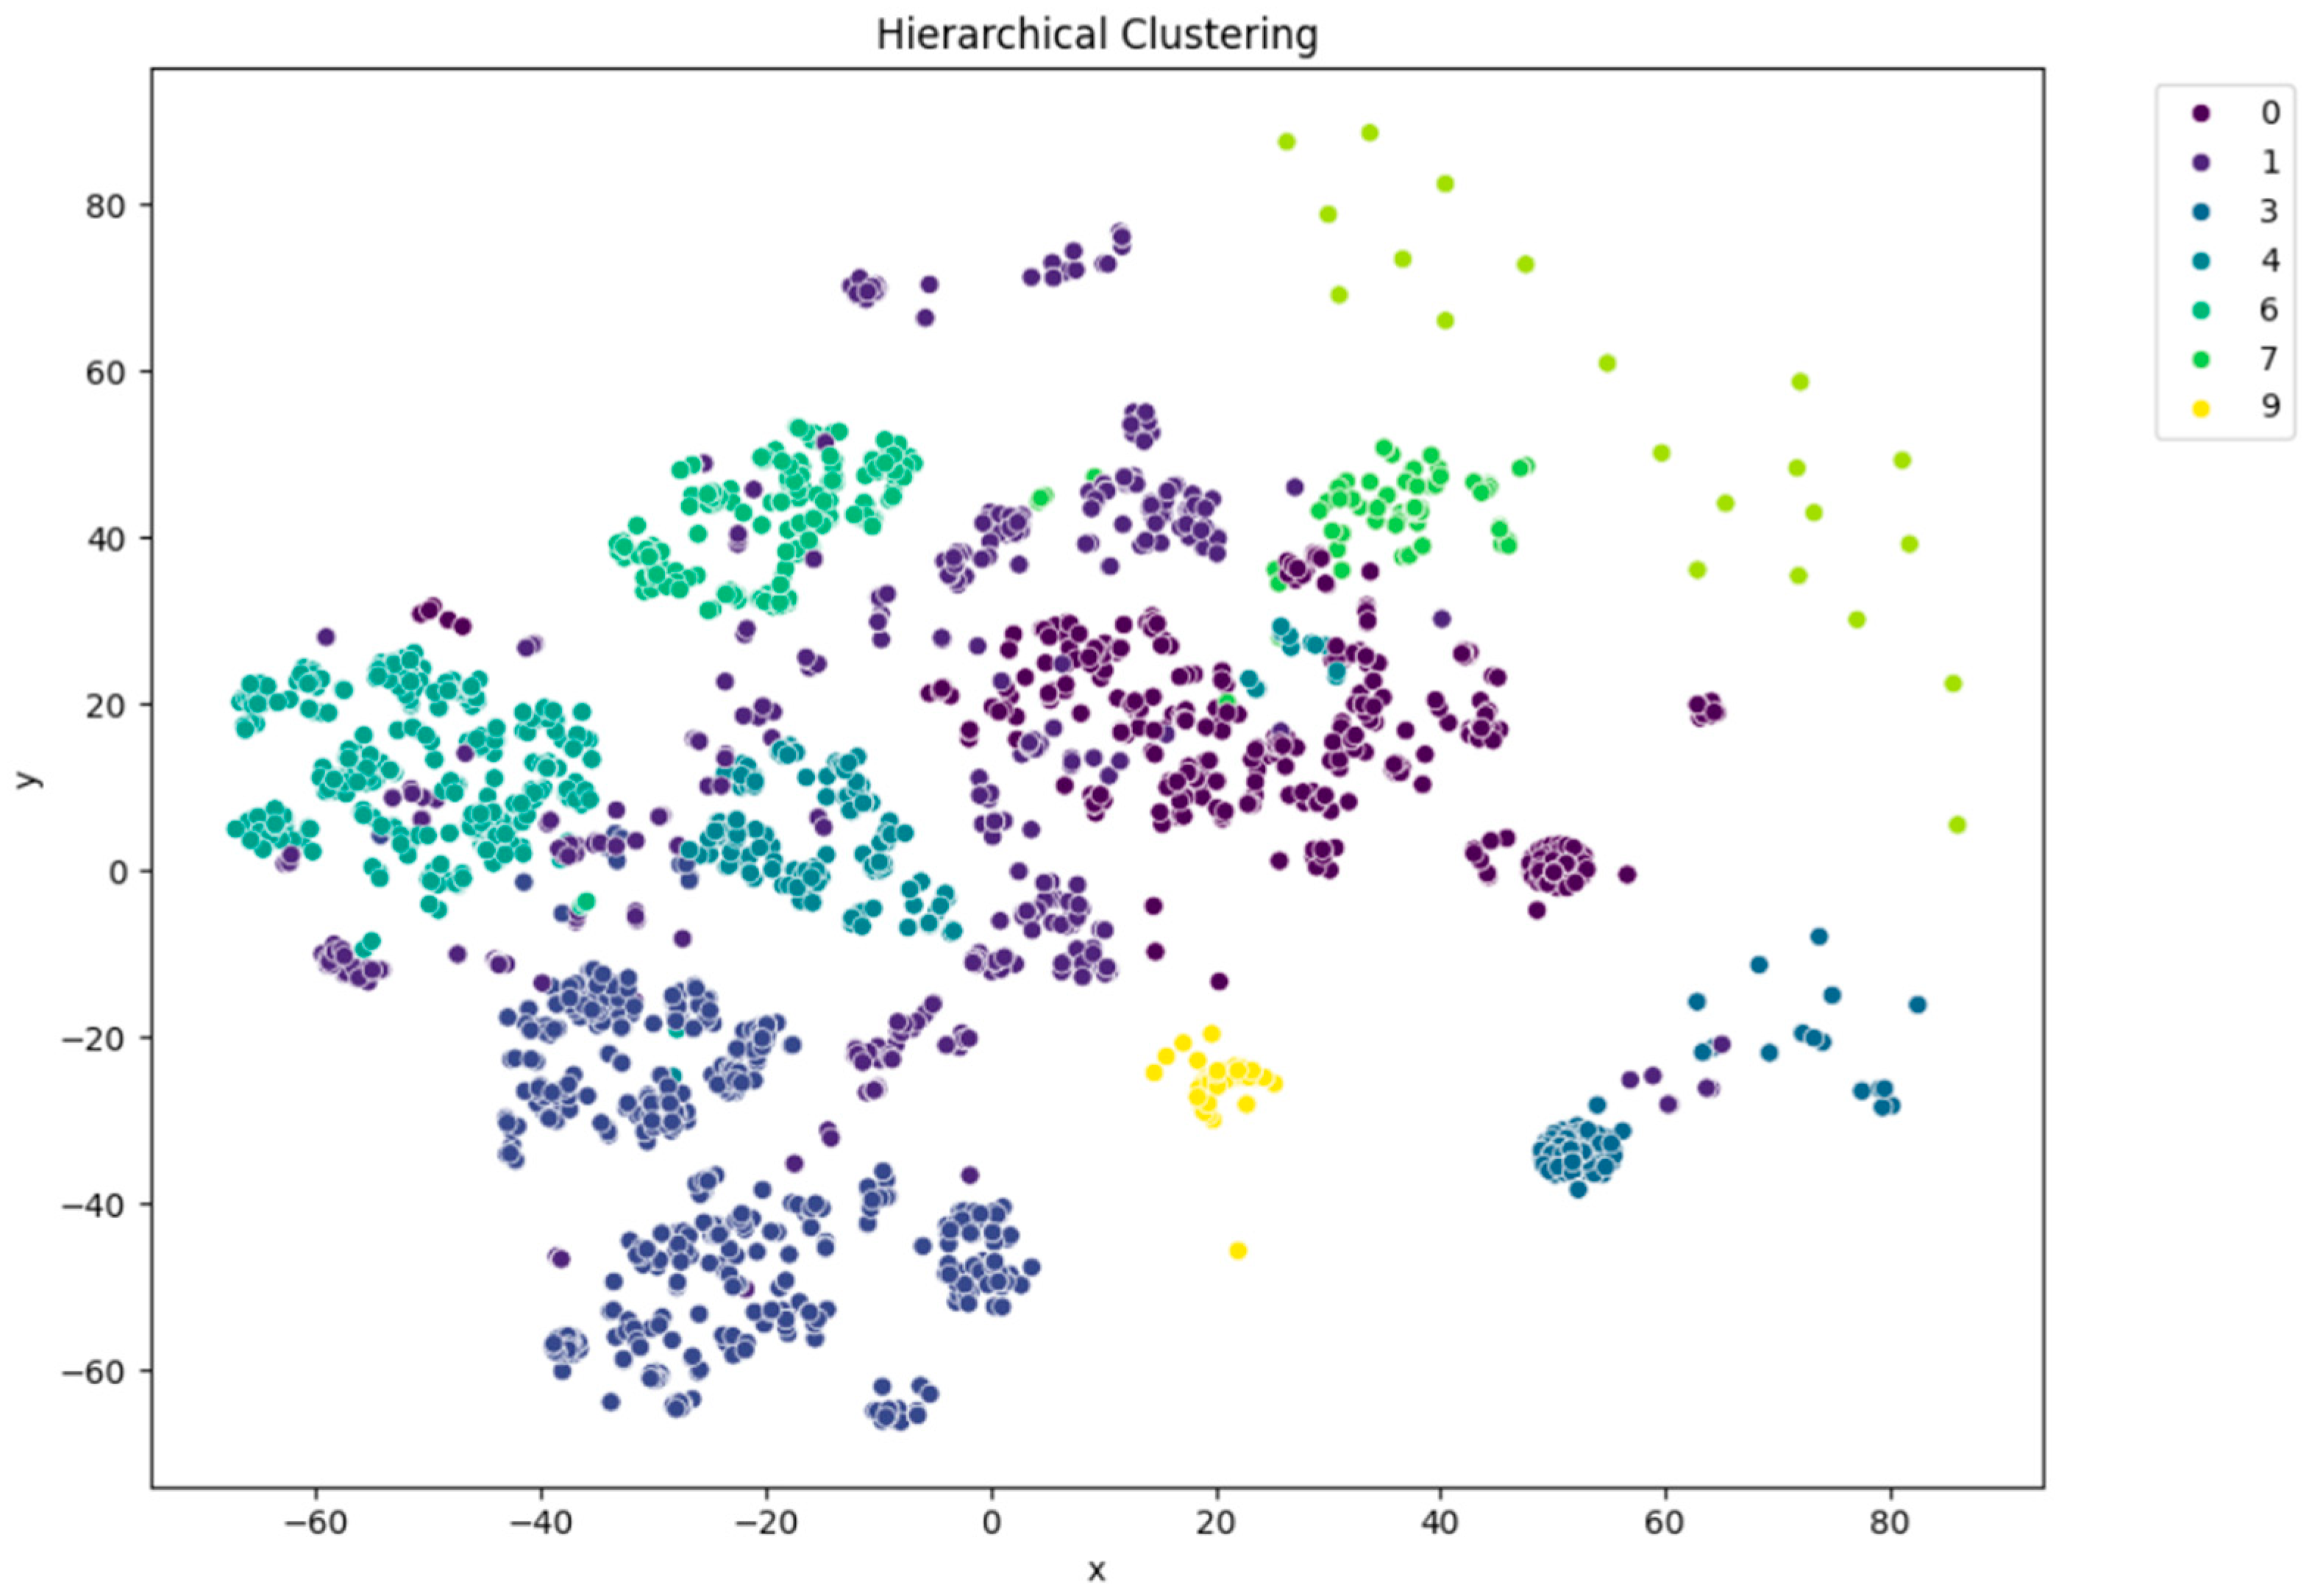
Figure 5). Each cluster appeared to capture distinct patterns in ECG interpretations, as shown by clear visual boundaries between clusters in the t-SNE plots. Agglomerative clustering (
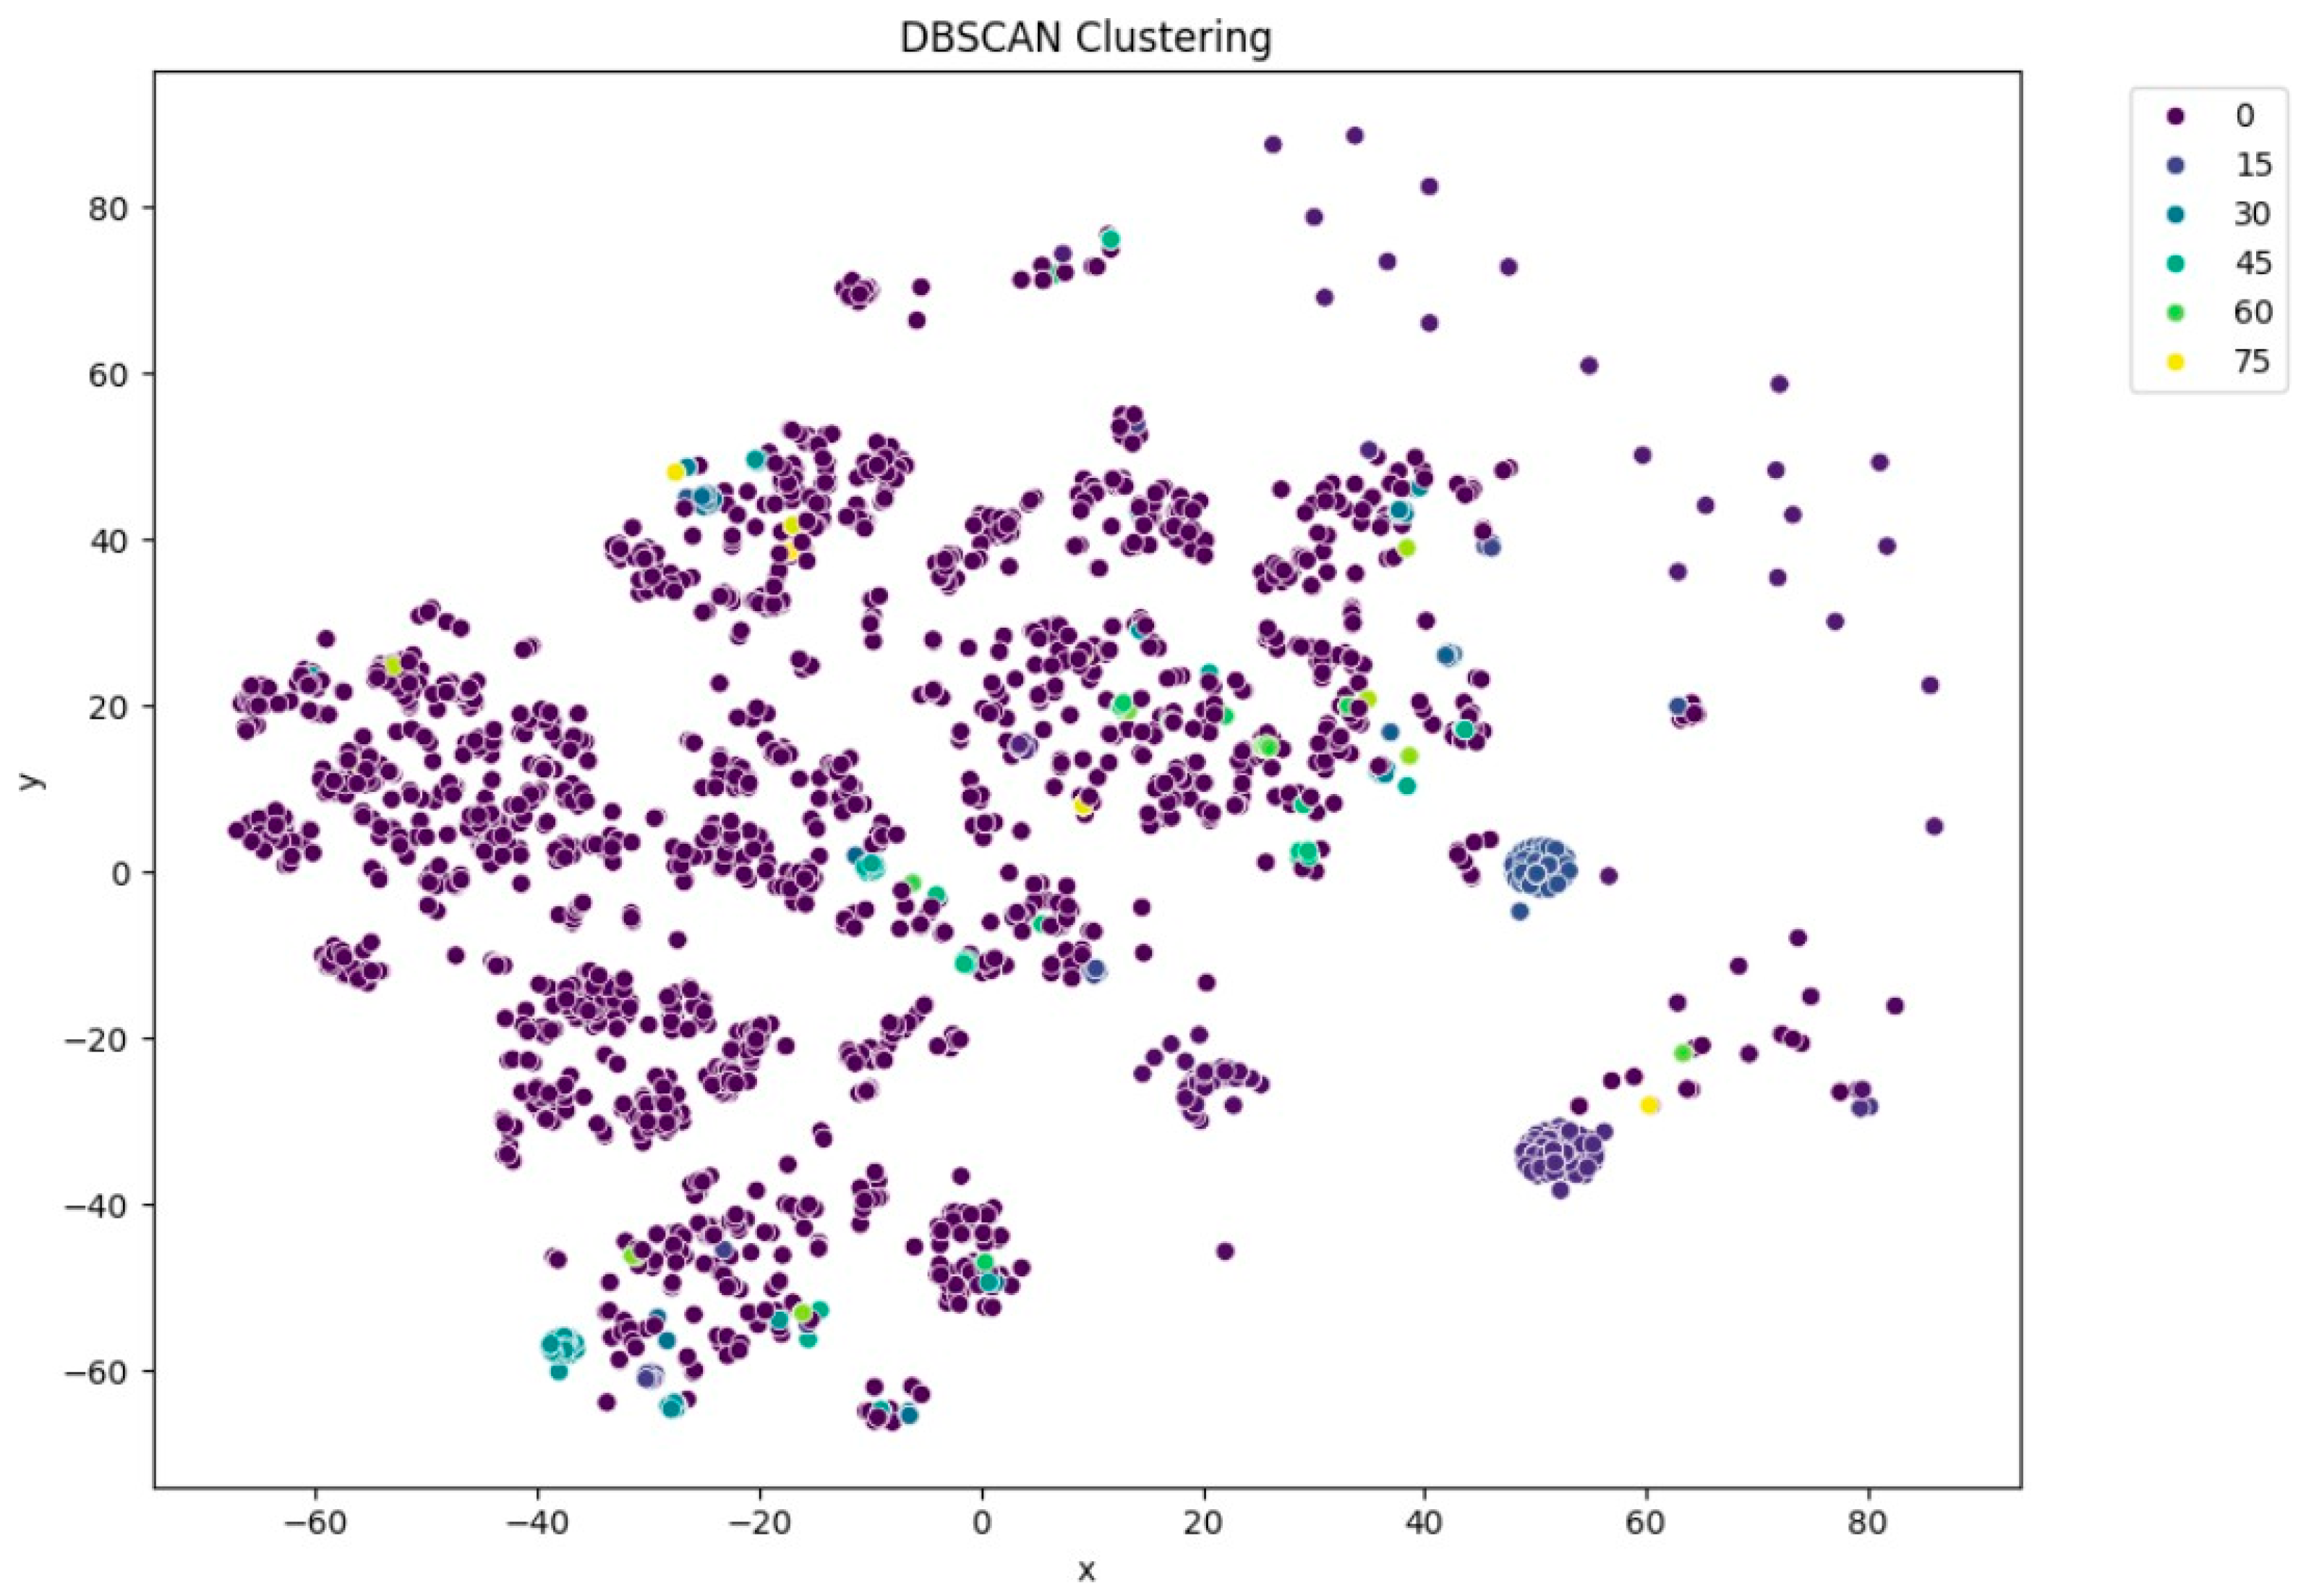
Figure 6) resulted in moderately distinguishable clusters, though with more overlap than KMeans. DBSCAN (
Figure 7), being density-based, identified a large portion of the data as noise, which might be due to the high-dimensional nature of the embeddings and sensitivity to parameter choices.
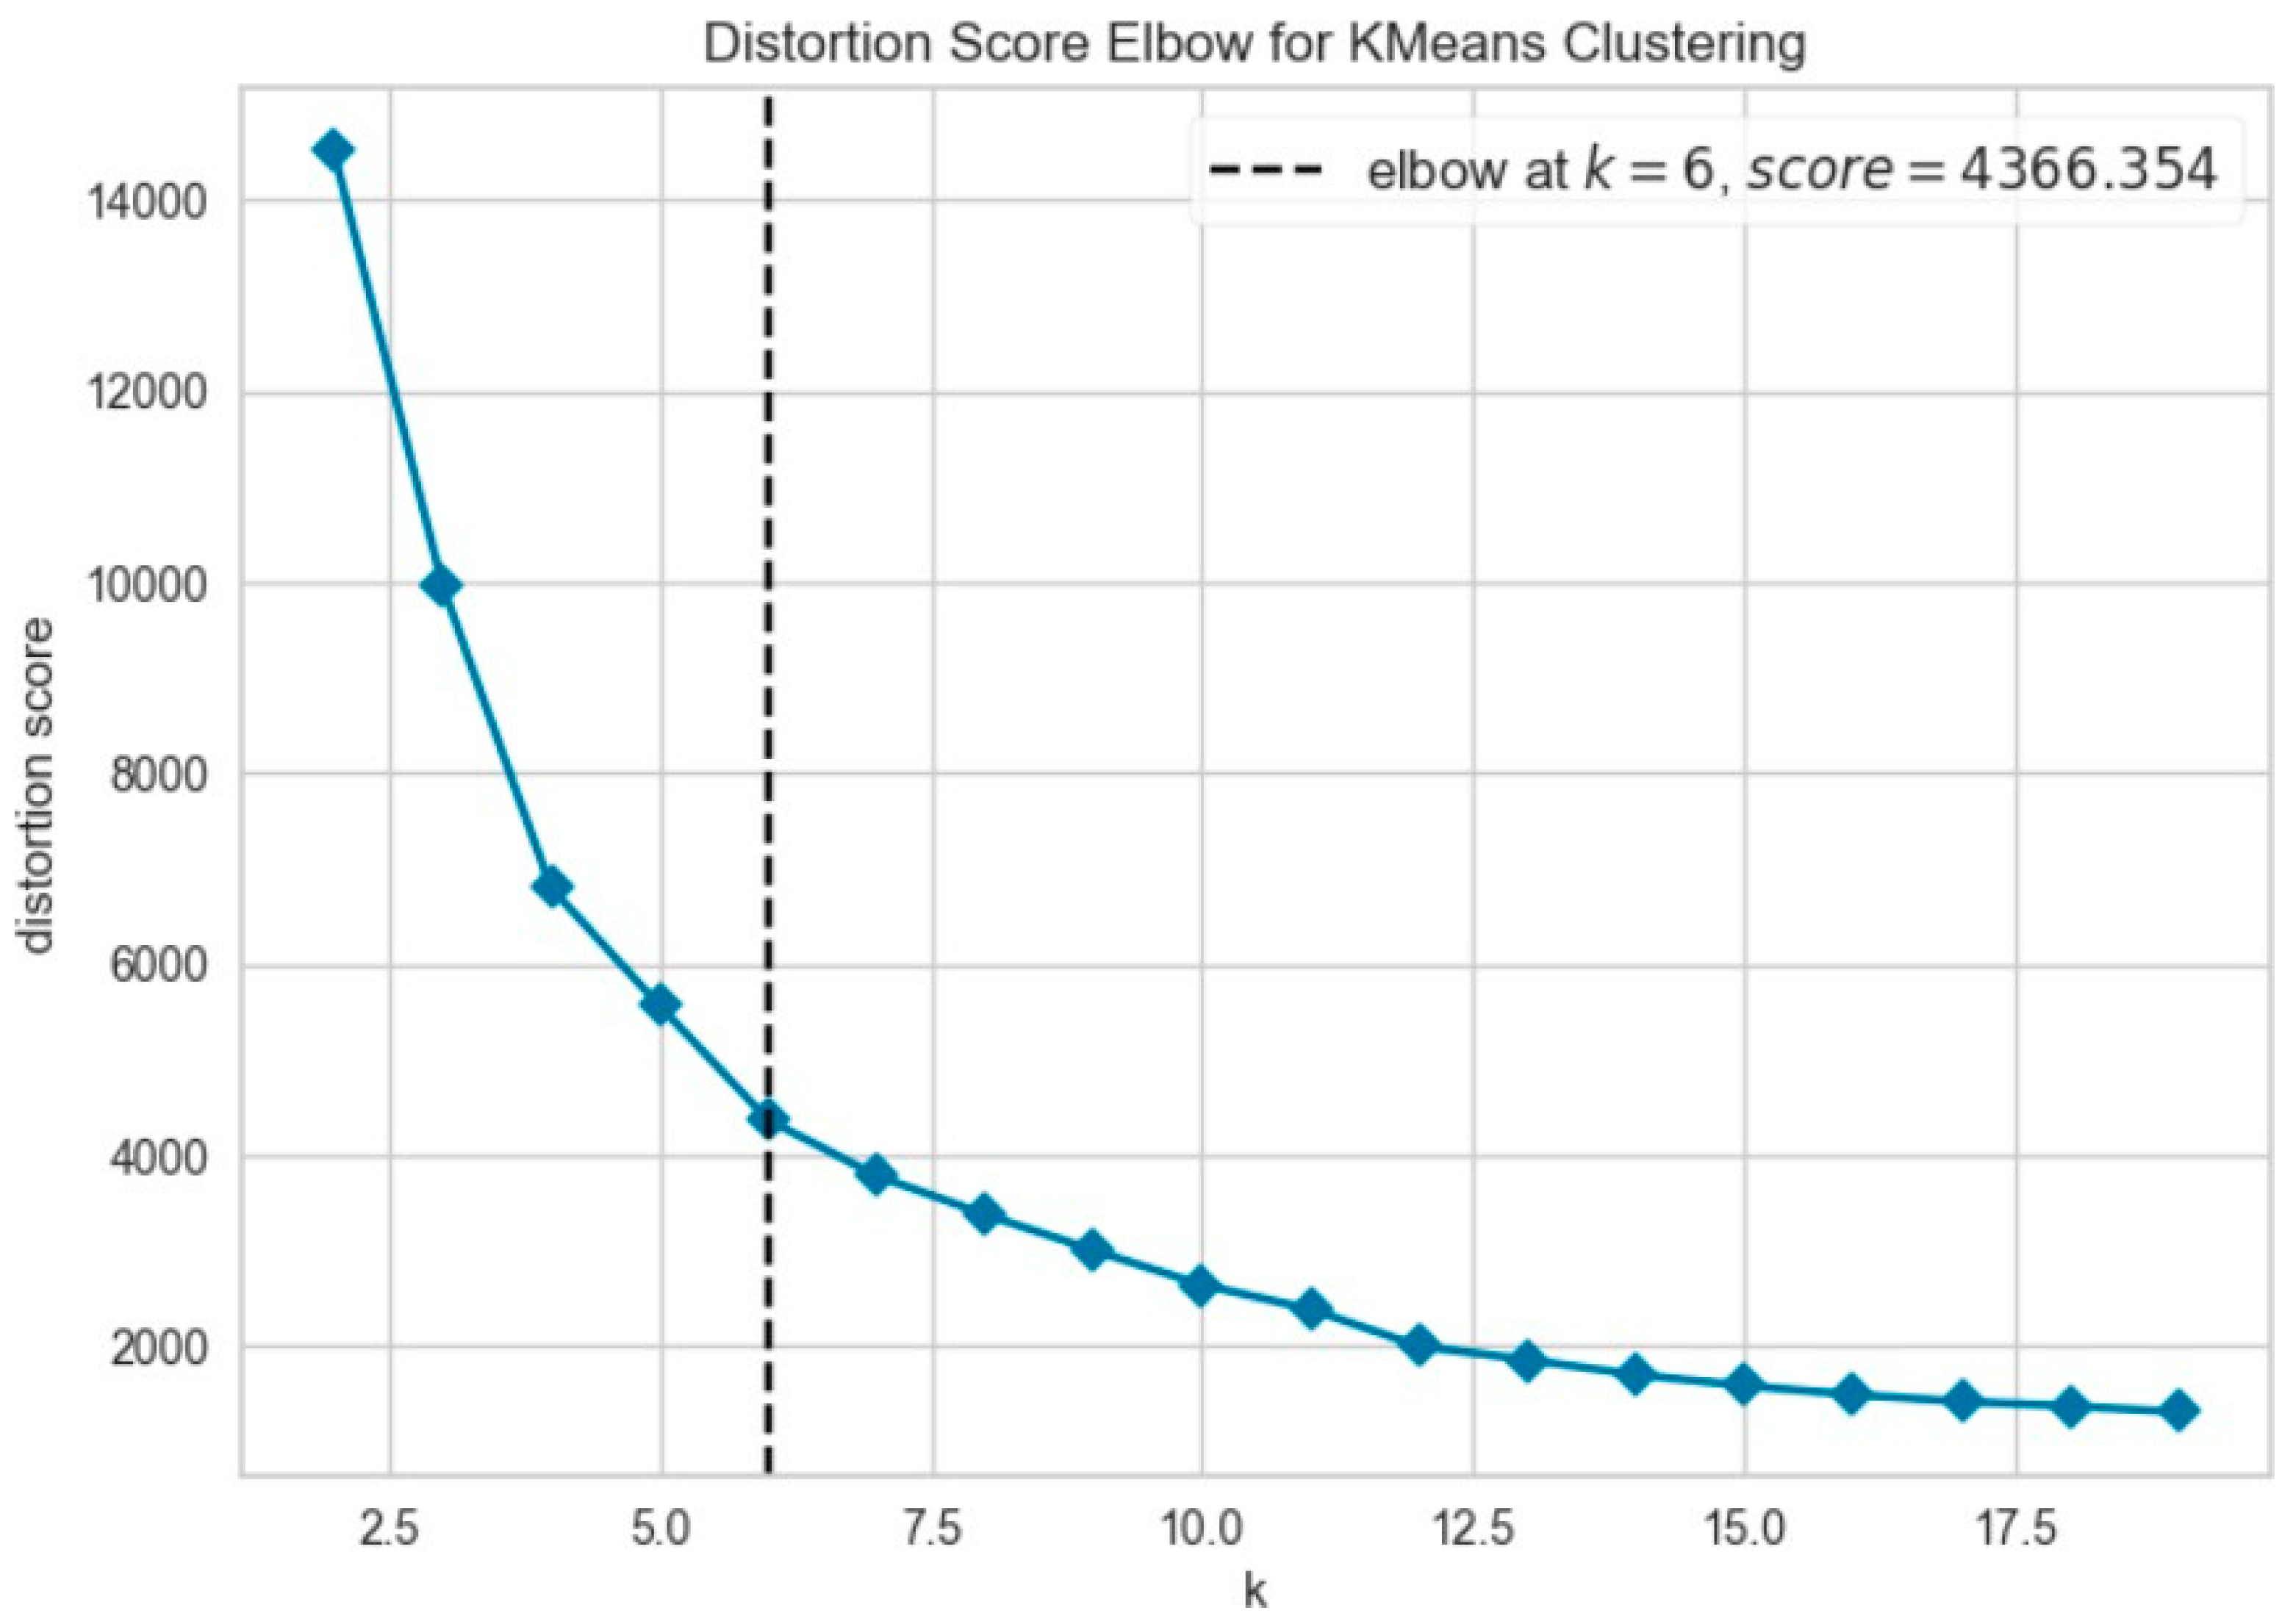
Further evaluation of KMeans clustering was conducted using principal component analysis (PCA) and the elbow method, which suggested an optimal cluster number around 10–11. This was supported by a silhouette score of 0.41 (
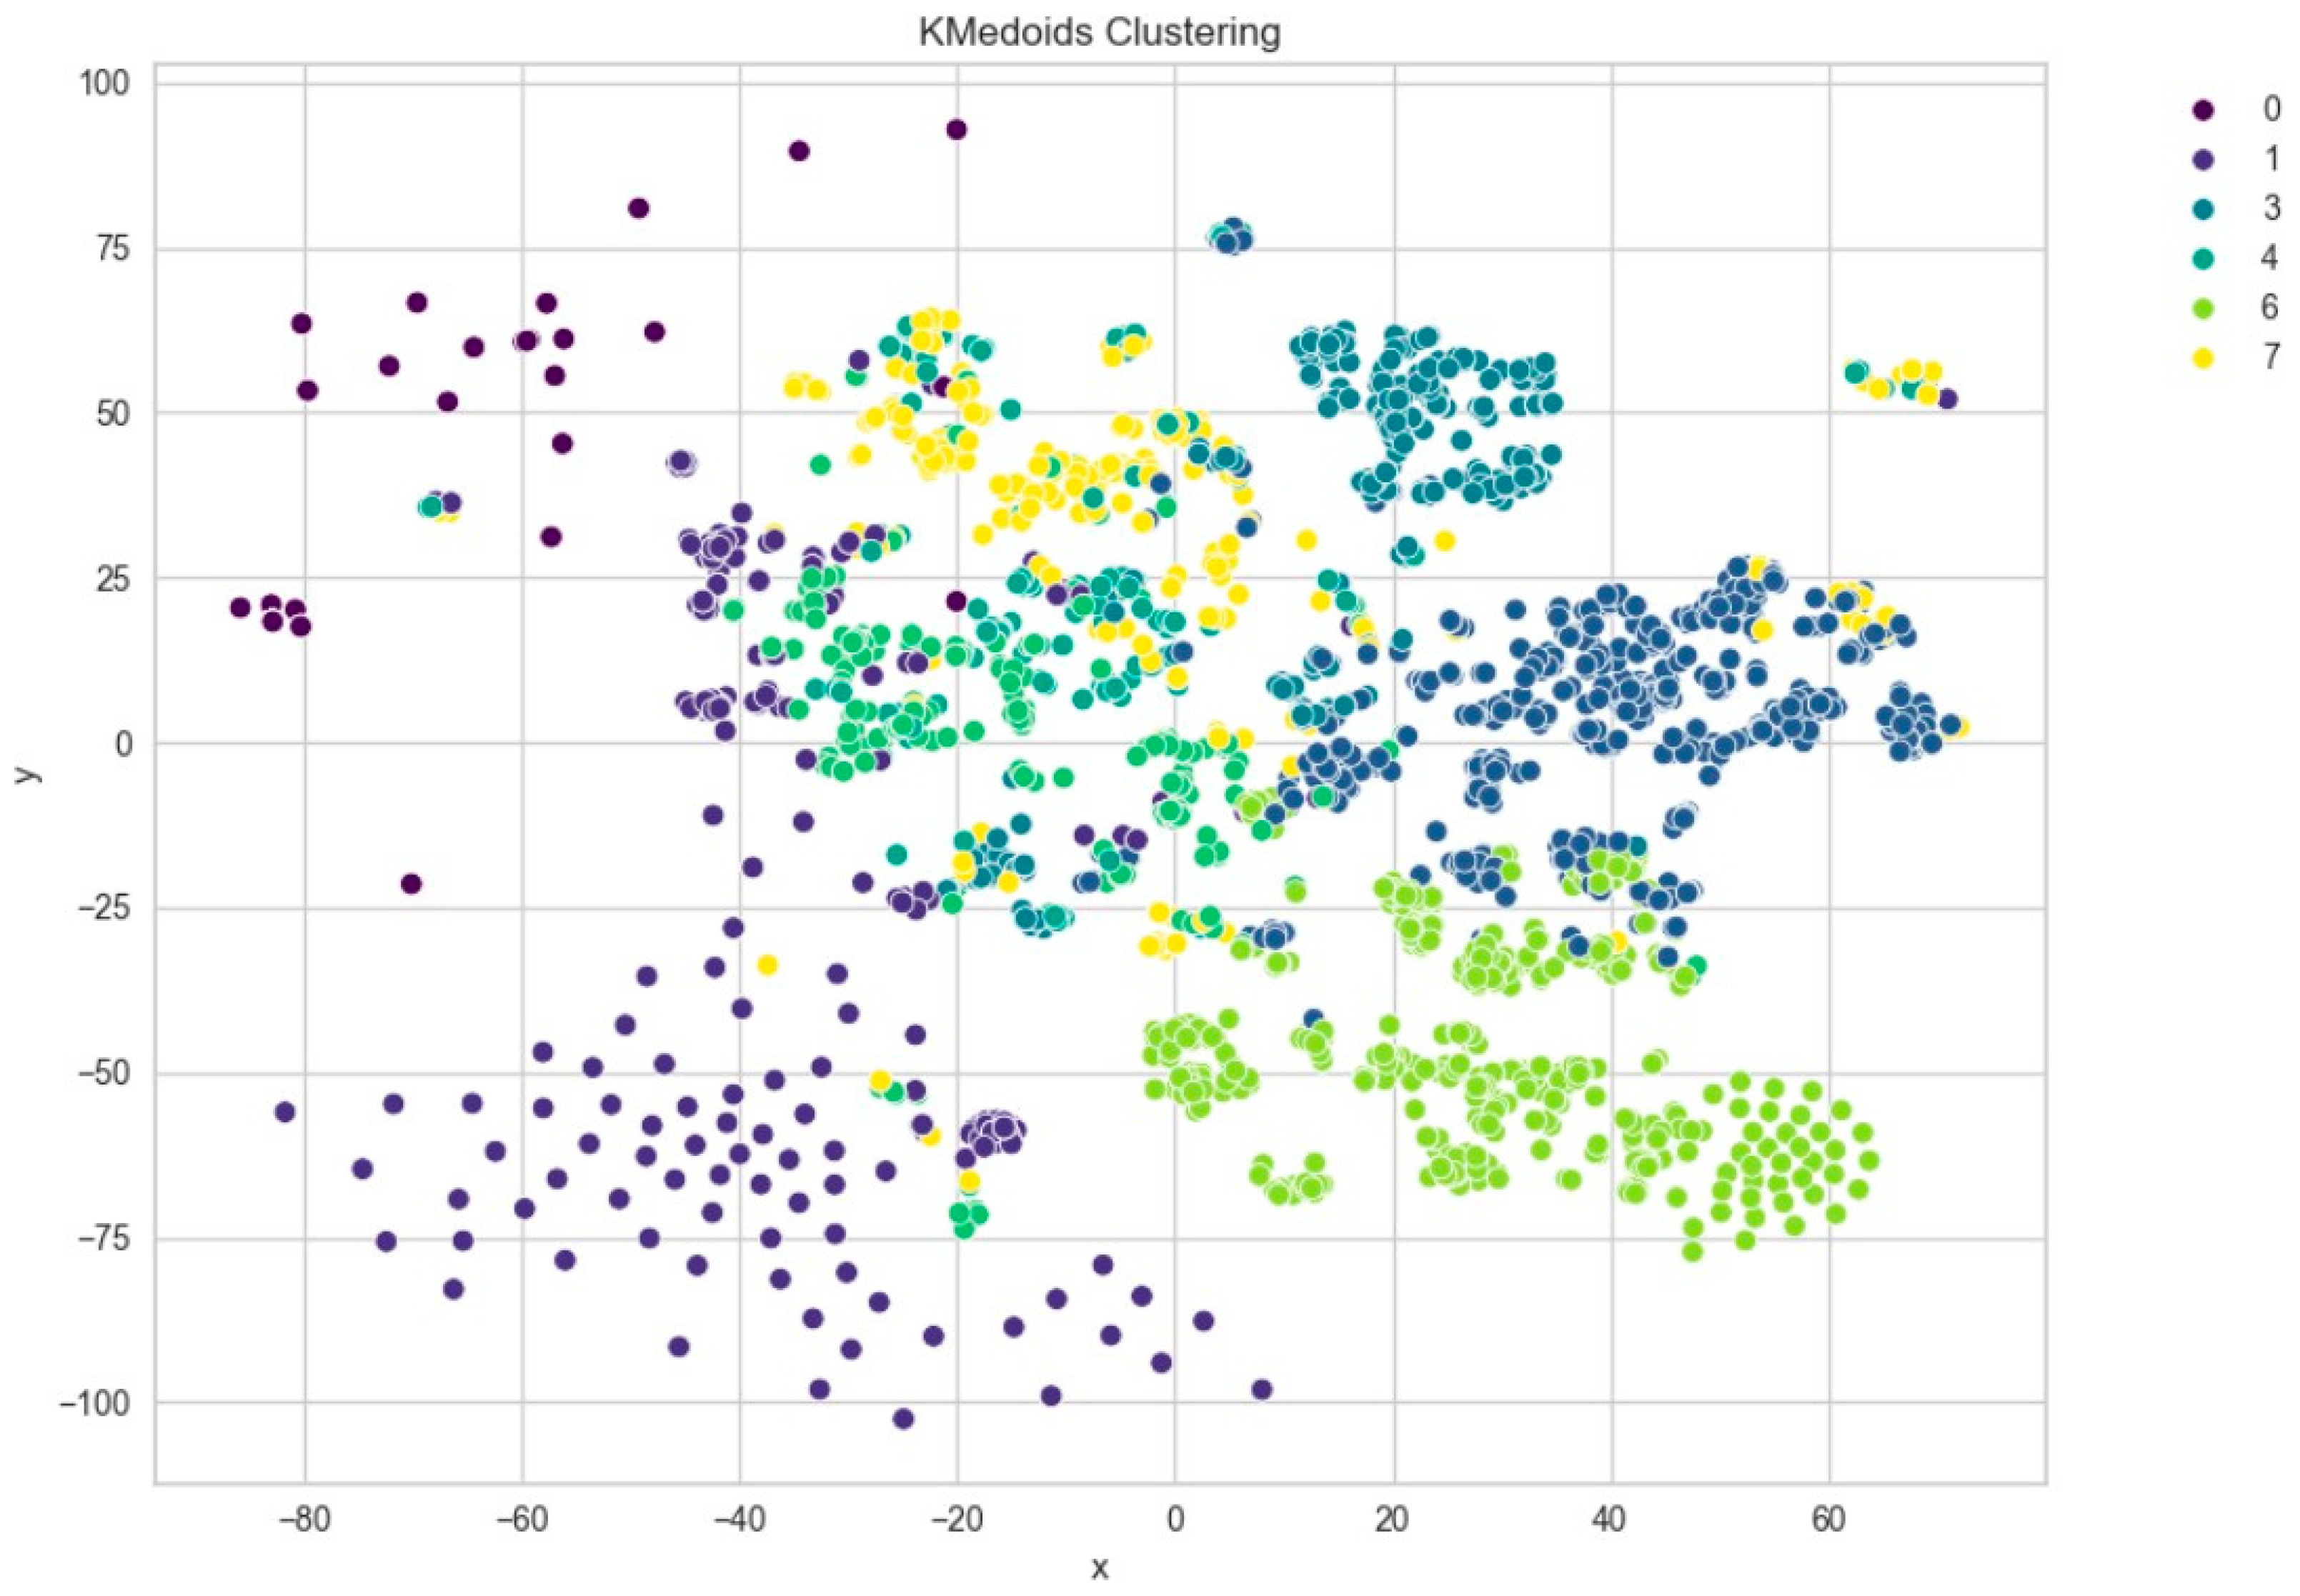
Figure 8), indicating moderate cohesion and separation between the discovered clusters. A comparison with KMedoids also yielded similar clustering structures, albeit with slightly more compact clusters in certain regions, as can be observed in the t-SNE plots post-PCA (
Figure 9). The figure shows that using six clusters provides a good balance between compactness and simplicity in the clustering solution.
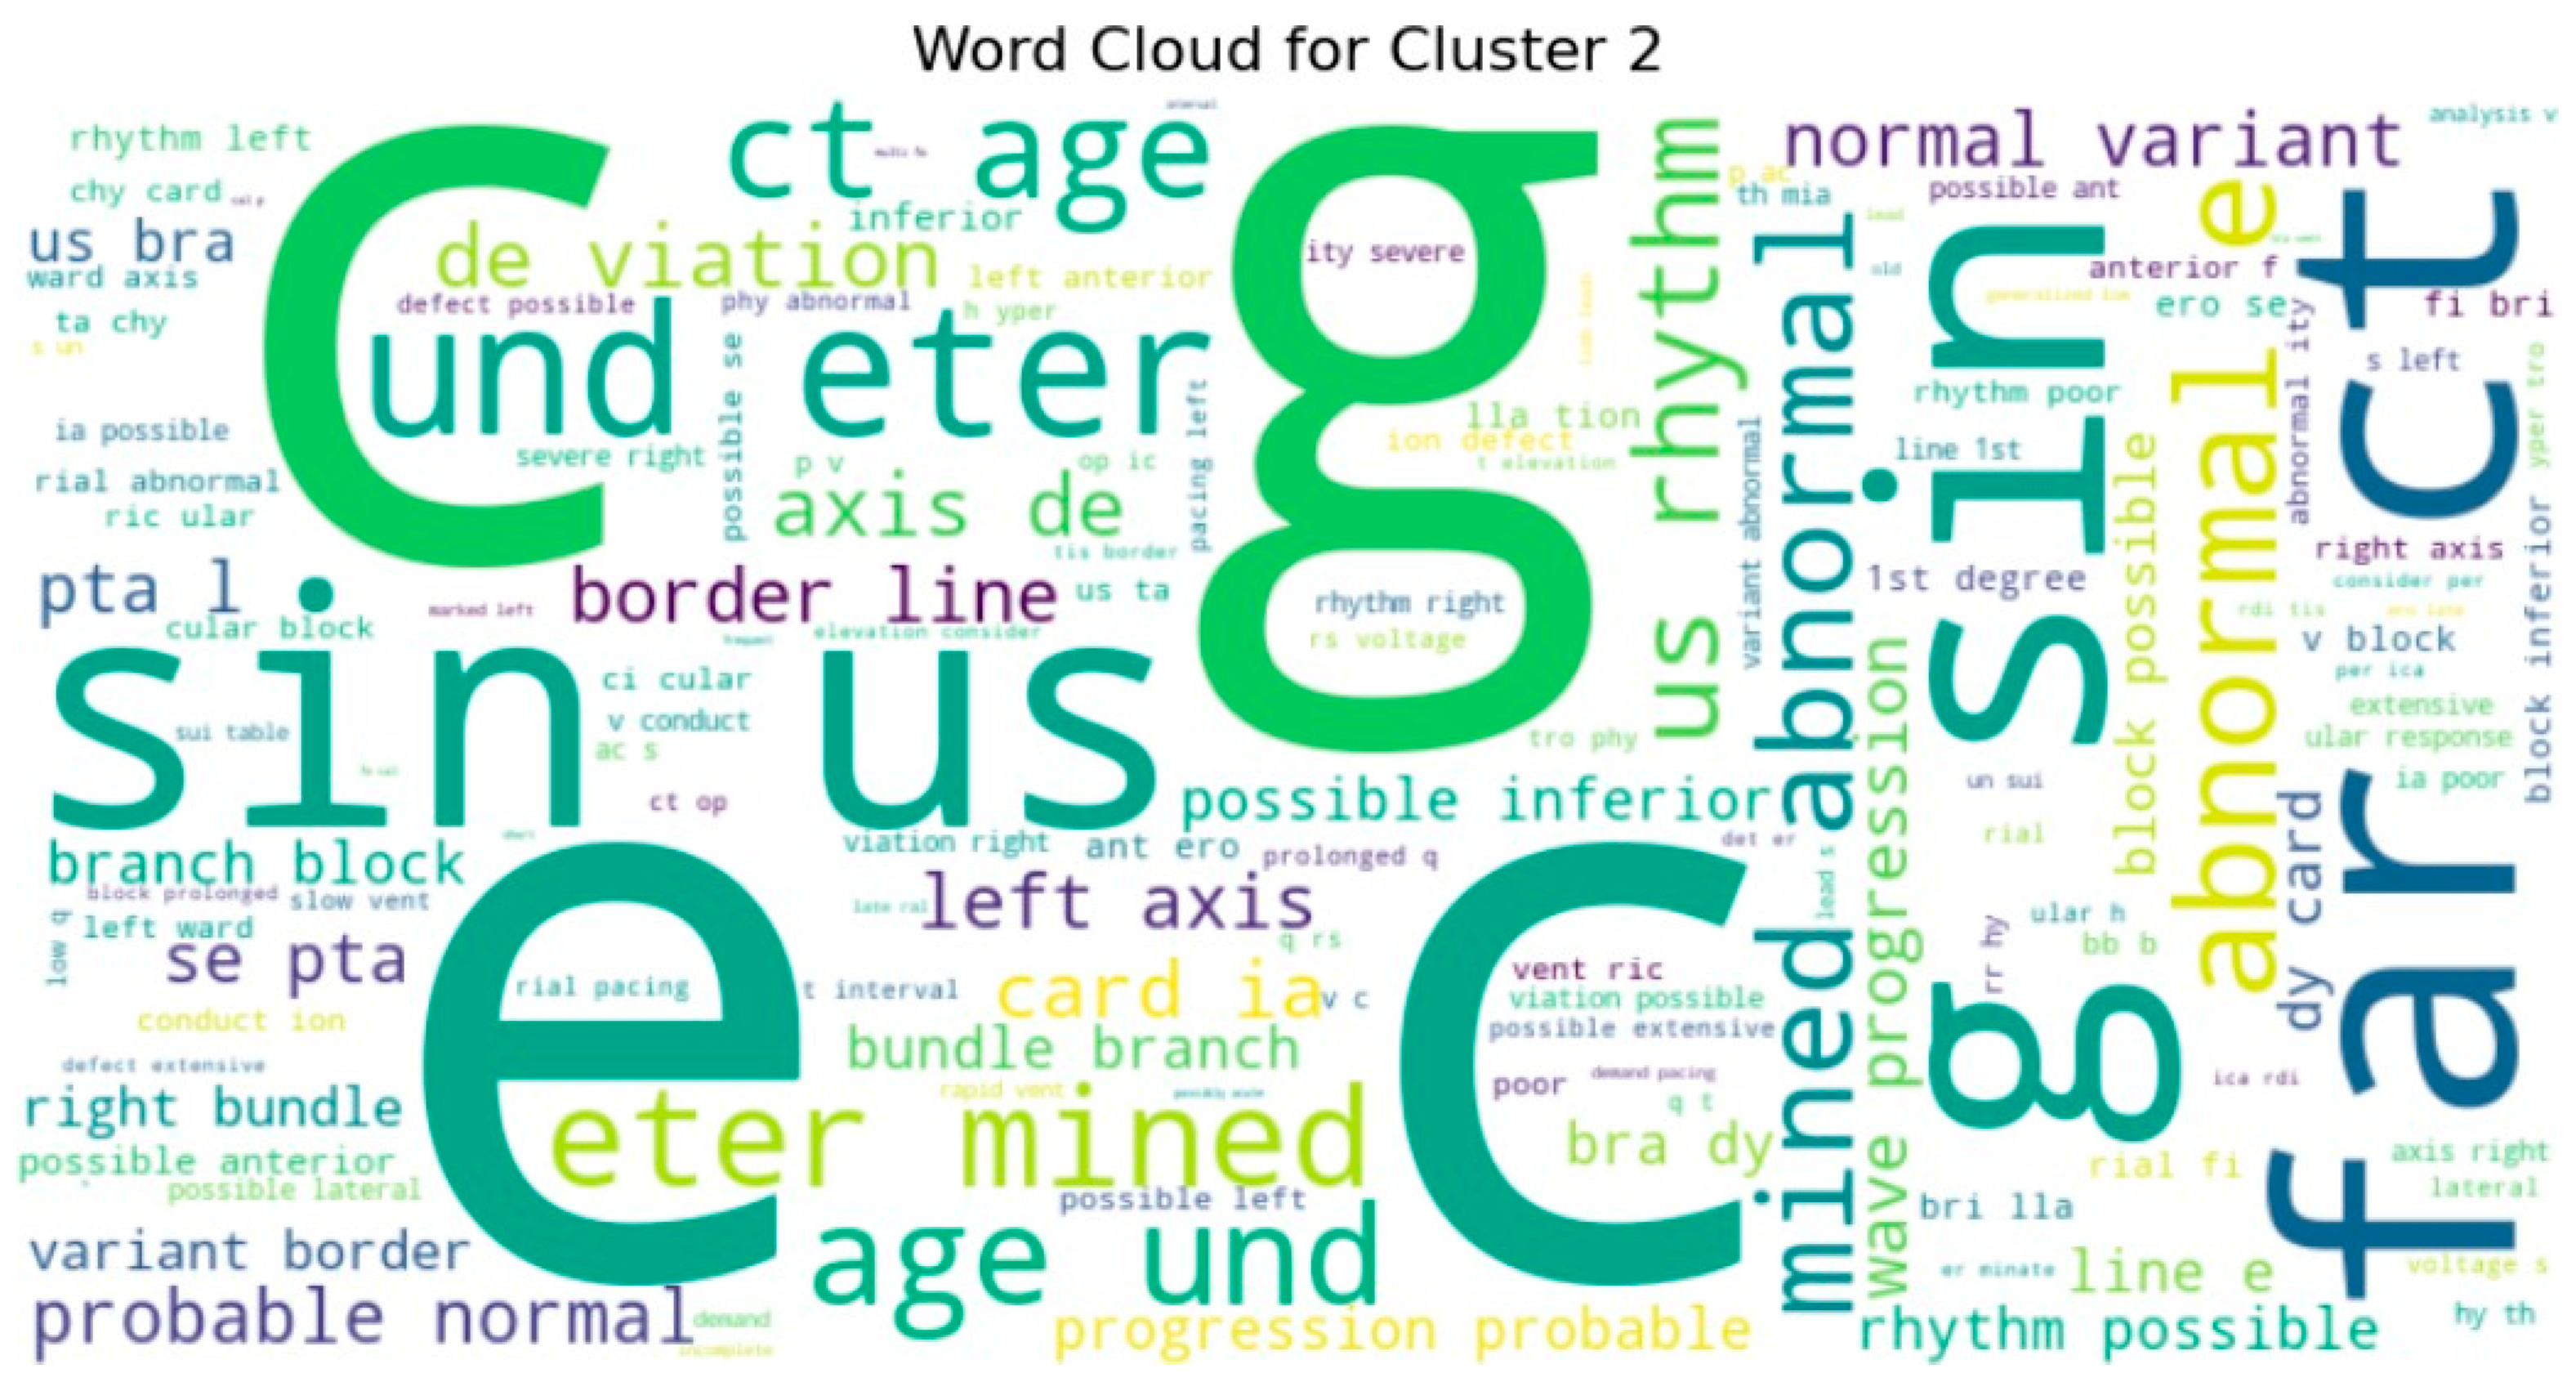
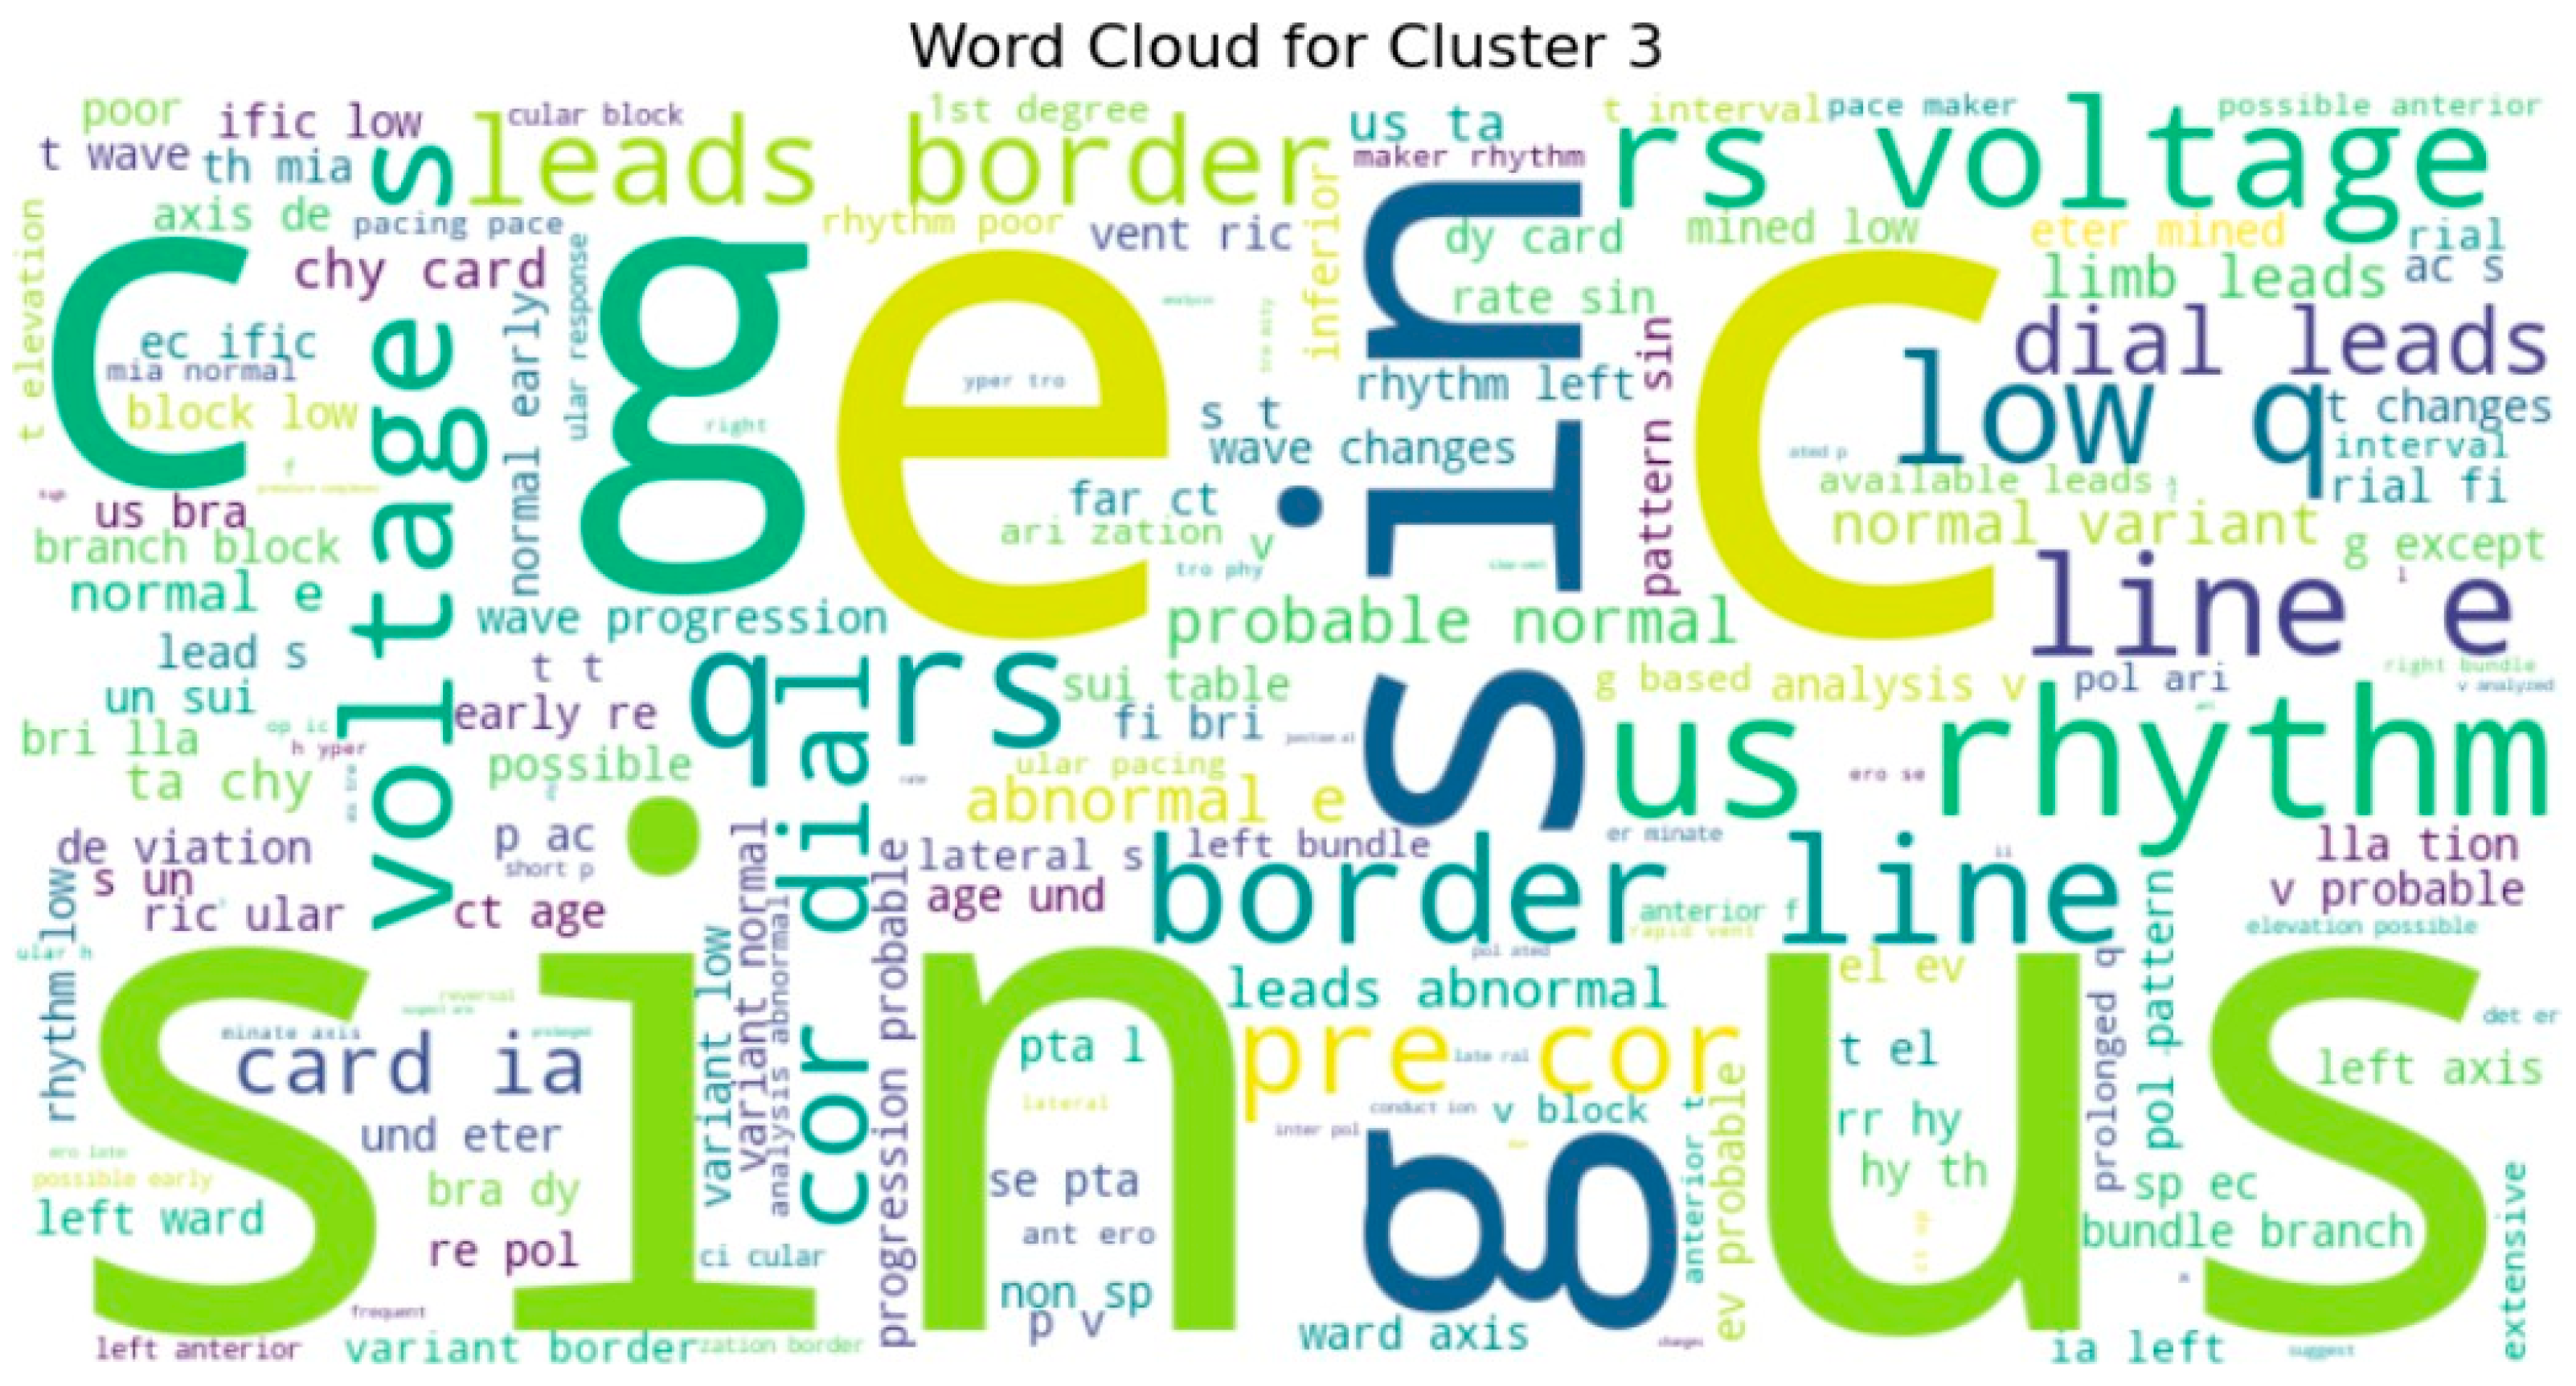
To gain deeper insight into the semantic content of the clusters, we generated word clouds for individual clusters (specifically clusters 3, 4, 5, 7, 8, and 9). These word clouds highlighted dominant terms unique to each group. For example, cluster 9 frequently included terms such as normal, rate, and sinus, suggesting that these reports often described routine or unremarkable ECG findings. Cluster 5, on the other hand, emphasized terms like atrial, fibrillation, and abnormal, indicating a concentration of pathological interpretations as shown in
Figure 10 and sample word clouds in
Figure 11 and
Figure 12.
We also constructed a token co-occurrence graph using the 100 most frequent tokens across all reports. The resulting network illustrated strong associations between commonly paired terms, with several hub nodes indicating clinically significant terms frequently used together. Visualization of this graph provided a structural overview of language patterns within the dataset (
Figure 13).
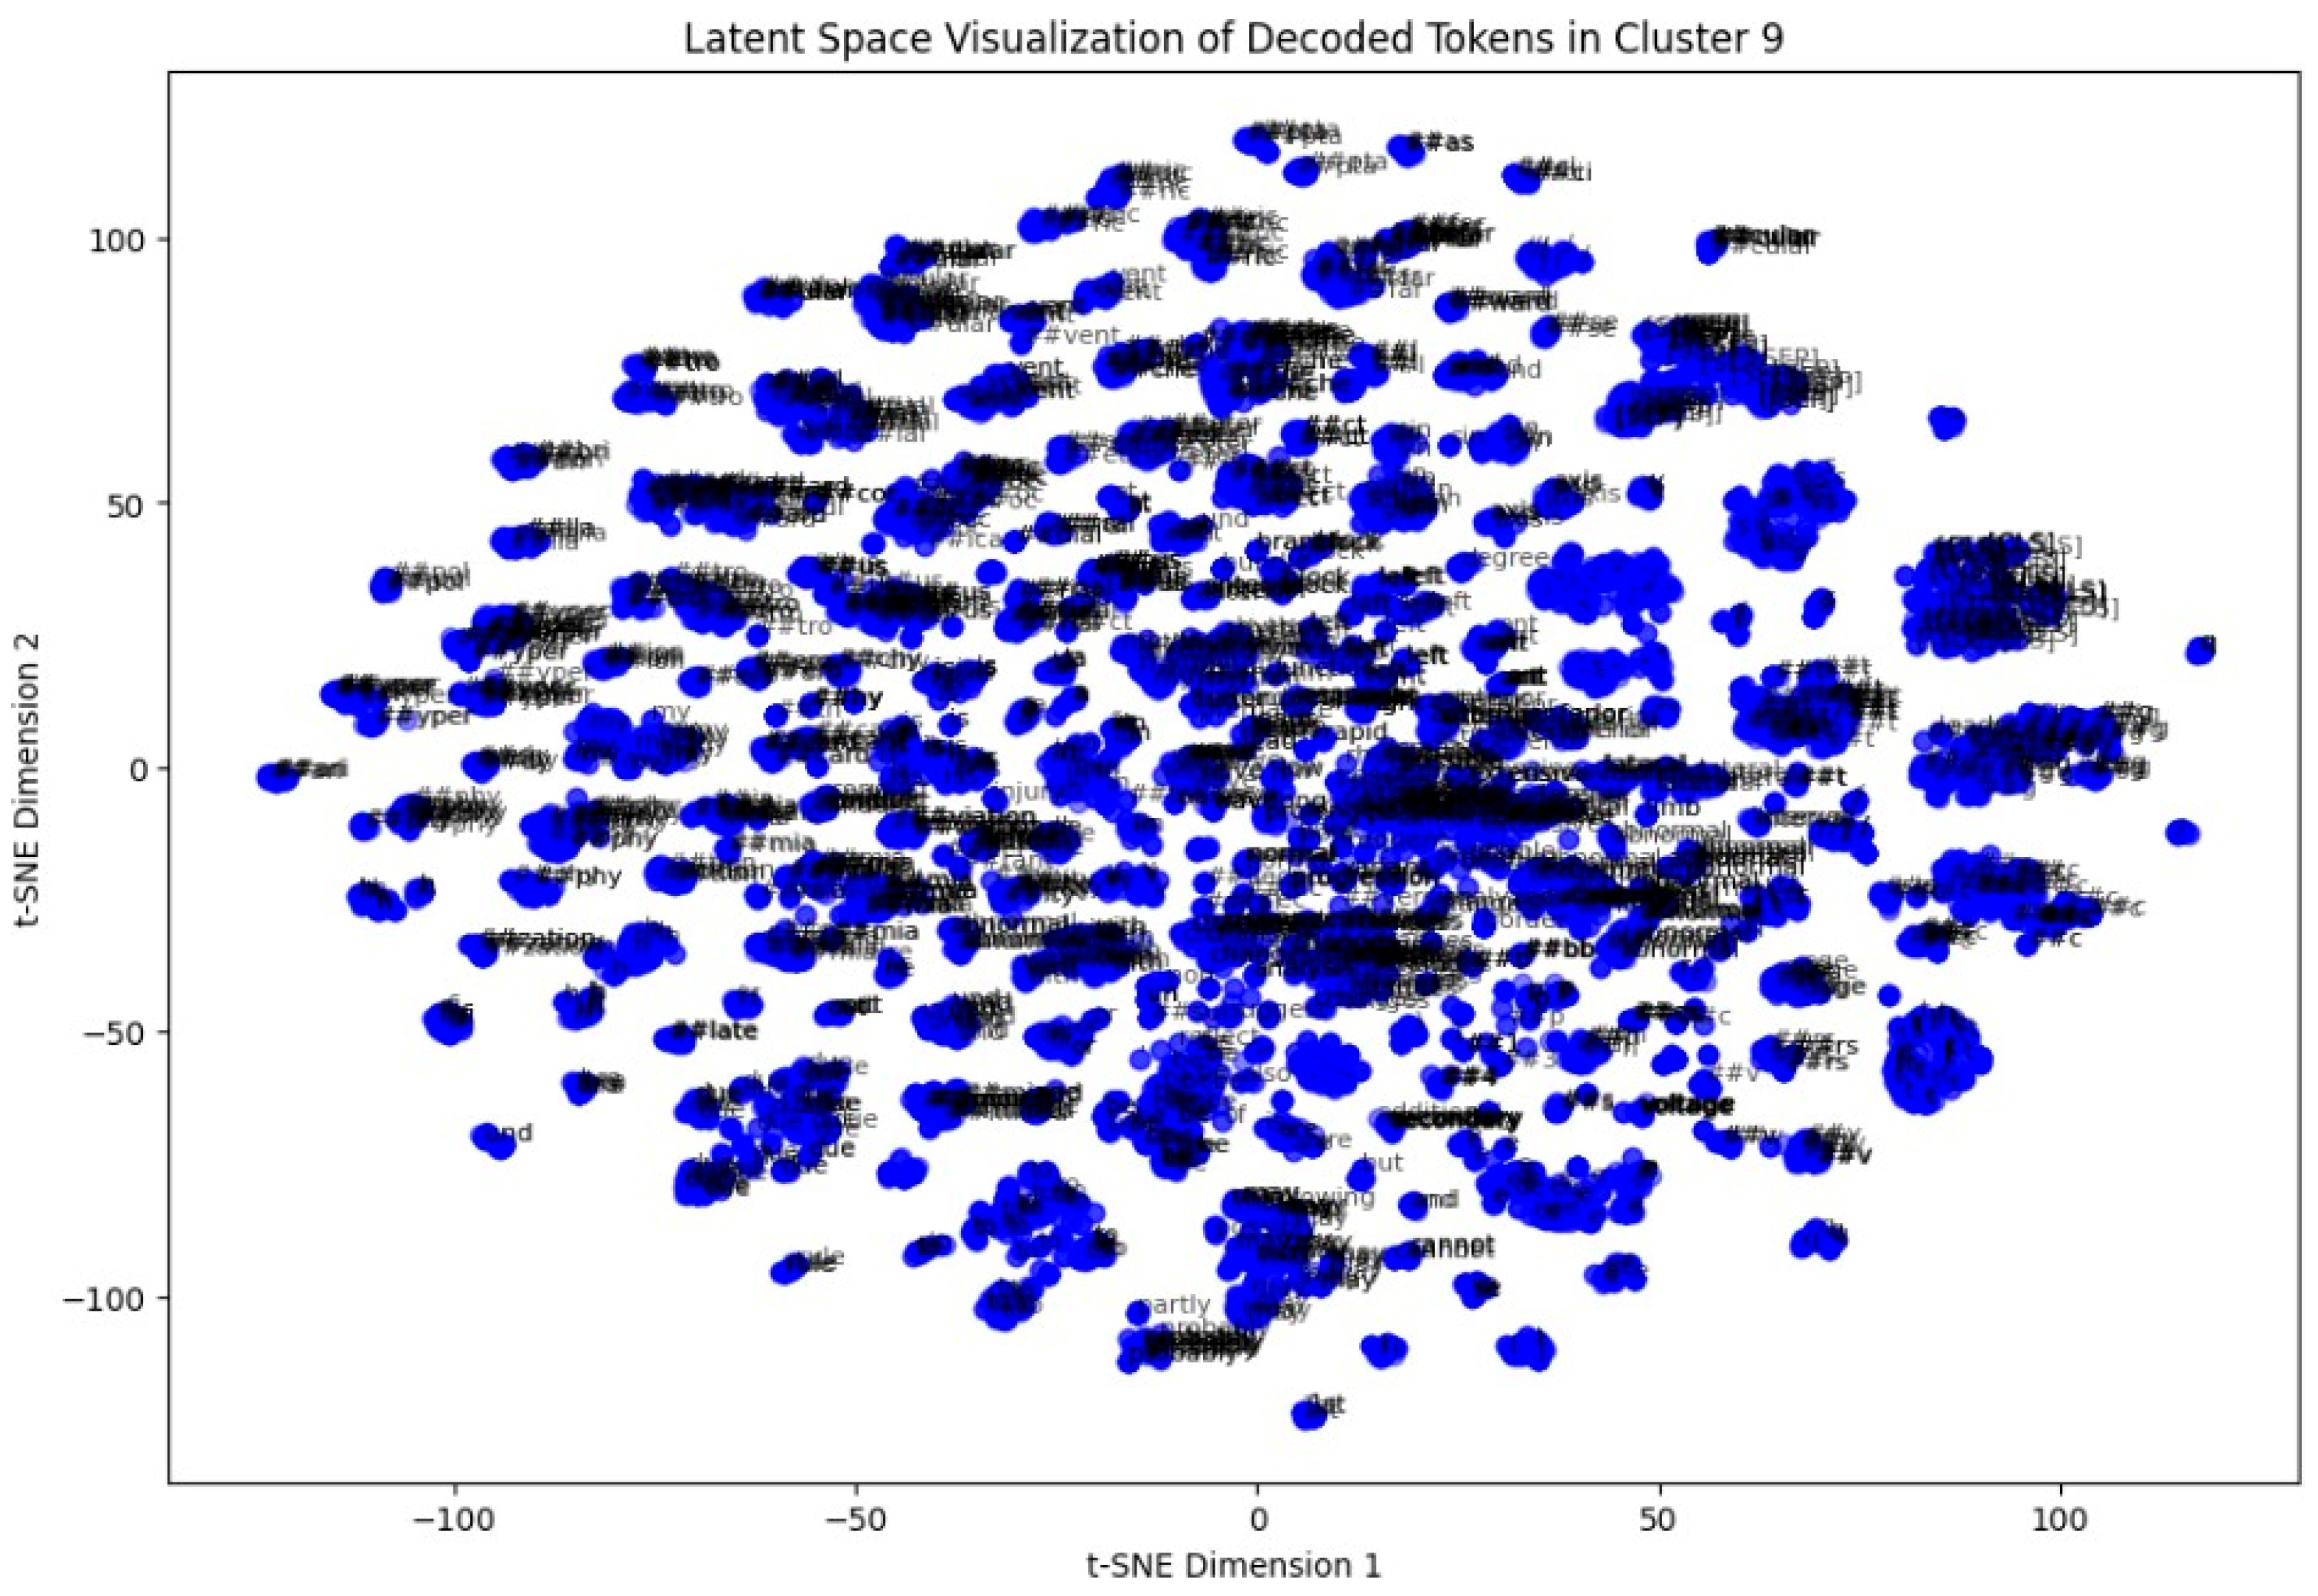
In the last step, a token-level latent space analysis was performed on Cluster 9. By extracting token embeddings and reducing them to two dimensions via t-SNE, we visualized the semantic arrangement of words within the cluster. Repeated patterns of clinically relevant terms appeared closely packed, indicating coherent language usage in these ECG interpretations (
Figure 14).
5. Discussion
This study provides a comprehensive solution to unsupervised clinical ECG report clustering from deep contextual representations of language obtained using BioBERT. By transforming multiple segmented fields of ECG reports into a standard textual format and then encoding them using the pretrained BioBERT model, we achieved semantically rich embeddings capturing both clinical nomenclature and context. These embeddings were also normalized and clustered through a combination of clustering methods like KMeans, hierarchical clustering, DBSCAN, and KMedoids to find the underlying group patterns present in the data.
Among all the clustering methods, KMeans clustering revealed noticeable groupings with varying levels of report similarity, and we determined the number of clusters using the elbow method. The silhouette score also verified the similarity of the clusters, and the output showed that KMeans worked particularly well when implemented with PCA-truncated embeddings. Applying DBSCAN demonstrated limitations under these circumstances, likely due to differences in densities within high-dimensional embeddings and the sensitivity of the parameters, yet it did highlight denser sub-clusters not found by centroid-based approaches, which were smaller.
Dimensionality reduction techniques, especially t-SNE and PCA, were used for visualization and provided an effective way of projecting high-dimensional semantic representations into the 2D plane. Visualization revealed the clear separation between the clusters, especially in the KMeans results, which supported the contention that BioBERT embeddings retain enough latent structure to enable informative clustering.
In order to crack the semantic nature of each cluster, we produced word clouds of the most frequent tokens in selected clusters. The word clouds provided an insight into dominant clinical themes or trends in single groups. In certain clusters, for instance, words for rhythm abnormalities were emphasized (e.g., “sinus”, “tachycardia”), while in other clusters, results involving structures or devices (e.g., “paced”, “infarct”) were targeted. This supports the hypothesis that the unsupervised model correctly characterized clinical subtypes or classes entirely based on patterns of text.
Secondarily, token co-occurrence graph building also allowed us to explore the network structures between common medical words in all of the reports. Well-connected nodes were often equivalent to common clinical descriptors or fundamental medical concepts, and edge weights reflected strong context dependencies. Such a graph-based structure improves clustering in providing a higher-resolution view of the token interstructure and can be generalized in follow-up work to create concept representations or ontologies.
The unsupervised clustering approach effectively grouped similar ECG reports and revealed distinct thematic structures through both sentence-level and token-level representations. Visualizations using t-SNE, PCA, and word clouds supported the interpretability of these clusters, while the token graph added a network perspective to the linguistic patterns embedded in clinical text.
6. Conclusions
One of the most robust achievements was obtained via token-level t-SNE visualization of a single cluster. It revealed locally grouped collections of contextually similar terms in a cluster, a testament to the superiority of BioBERT’s ability to pick up finer-grained linguistic patterns in the medical domain. These micro-trends point towards potential directions for future token-level semantic investigation or even potentially attention-motivated interpretability of clusters.
Despite the promising outcomes, this work is far from limitation-free. Having used unsupervised clustering, there is no explicit clinical validation, and one has the risk that some clusters are artifacts or an artifact of noise or superficial lexical similarity. In addition, the BERT models’ maximum token length limit (512 tokens) has the effect of truncating very long reports and affecting the quality of the embeddings.
In future work, the use of domain-relevant metadata such as diagnosis codes or demographic properties can enhance cluster quality and readability. Additionally, the exploration of hierarchical transformer models and fine-tuning BioBERT for ECG-specific corpora might yield yet more clinically salient clusters. Altogether, the findings showcase the potential and merit of utilizing transformer-based embeddings and unsupervised learning for ordering and studying clinical text data at scale.

