Abstract
This study explores the mechanical characteristics of 3D-printed specimens fabricated using TPU-95A filament, with a focus on the influence of key printing variables—temperature, speed, and layer height—on tensile strength, toughness, and surface hardness. Through systematic testing, the tensile evaluation revealed a peak tensile strength of 329.02 kgf/cm2 and toughness of 1.56 under conditions of elevated temperatures and optimized layer configurations. Similarly, the hardness assessment indicated a maximum average value of 74.9 Shore A, emphasizing the substantial effect of process parameters on material integrity and resilience. A detailed variance analysis confirmed the pivotal roles of temperature and layer height in enhancing mechanical properties. Using a statistical optimization approach, optimal printing conditions were identified, demonstrating that higher temperatures, moderate speeds, and reduced layer heights significantly improve the balance between strength, flexibility, and durability. These findings contribute to the development of tailored fabrication strategies, offering practical insights for applications where precision and mechanical reliability are critical.
1. Introduction
Three-dimensional printing using the Fused Deposition Modeling (FDM) method has become a very popular solution in the manufacturing and product engineering industry, thanks to its ability to produce objects with complex designs efficiently and quickly [1,2]. One of the materials often used in the FDM process is TPU95A (Thermoplastic Polyurethane) filament, which is known for its high elasticity, flexibility, and wear resistance [3]. Thanks to these characteristics, TPU95A is widely applied in various fields, such as the automotive industry, medical devices, and consumer products [4].
Although the popularity of TPU95A in 3D printing continues to grow, research related to optimizing the printing parameters of this filament is still limited [5]. The setting of printing parameters such as the extrusion temperature, print speed, and layer thickness greatly affects the quality of the print, especially in terms of important mechanical properties, such as tensile strength and hardness [6,7,8,9]. Without a sufficient understanding of how these parameters interact with each other, the resulting print can have a less than optimal performance, which can ultimately affect the durability and function of the final product.
One efficient method for performing parameter optimization is the Taguchi method, which is known for its efficiency in designing experiments and identifying the parameters that most affect product quality [10,11,12,13]. In this study, the L9 (33) experimental design was applied, consisting of nine experiments with three levels for each of the three printing parameter factors [14,15,16,17]. By using this approach, it is expected that the optimal combination of parameters can be obtained to produce a better print quality with superior mechanical properties.
This study aims to optimize the tensile strength and hardness of FDM 3D printing products with TPU95A filament by optimizing printing parameters using the Taguchi method with the L9 (33) experimental design. The results of the study are expected to provide a deeper understanding of the effect of various printing parameters on the mechanical performance of TPU95A materials and provide useful guidance for the industry in improving the quality of 3D-printed products.
2. Methodology
This study uses an experimental approach in which data collection is carried out through the direct observation and manipulation of relevant variables under controlled conditions [18,19,20,21]. This method was chosen to facilitate the analysis of the causal relationship between independent variables (3D printing process parameters) and dependent variables (mechanical properties of printed products). Through an experimental approach, researchers can systematically evaluate the effect of changes in printing process variables on the quality of printed products.
In this study, the material used was eFlex TPU 95A (Shenzhen Esun Industrial Co., Ltd., Shenzen, China) filament, which is a thermoplastic polyurethane elastomer with a diameter of 1.75 mm. This filament will be printed using an Ender-3 Pro 3D printer (Creality, Shenzhen, China) to produce test specimens with the aim of analyzing the effect of various process parameters on the mechanical properties of printed products [14]. The use of this material was chosen because of its elastomeric properties and its ability to be applied to speed bumps that require flexible and durable materials.
The stages of the research are presented in Figure 1, which shows the research flow diagram. This diagram illustrates the steps taken systematically, from planning, data collection, the analysis of results, to drawing conclusions. The research process involves setting variables that affect the printing process, such as the printing temperature, printing speed, and layer height, each of which is tested at several levels of variation. Thus, this experimental approach is expected to produce valid and reliable data to determine the optimal printing parameters that affect the mechanical characteristics of the product. This study aims to optimize the tensile strength and hardness of FDM 3D printing products with TPU95A filament by optimizing the printing parameters using the Taguchi method with the L9 (33) experimental design.
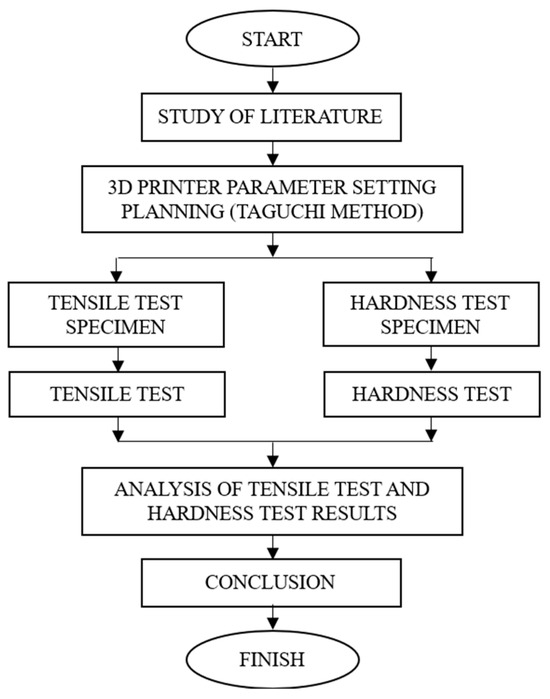
Figure 1.
Research flow diagram.
Based on Figure 1, this study began with a literature study that focused on collecting information and references from relevant scientific sources. The next stage was the planning of 3D printing process parameter settings using the Taguchi Method, which involved optimizing temperature, print speed, and layer height. Furthermore, test specimens were produced for hardness and tensile strength testing. Tests were performed on specimens to measure mechanical properties such as the hardness and tensile strength. After testing, the data results were analyzed to evaluate the mechanical properties of the product, including the hardness and tensile strength. Finally, conclusions were drawn based on the analysis results, including recommendations for optimal parameters.
2.1. Preparation of Tools and Materials and Parameter Settings
The main material used in this study is eFlex TPU-95A filament with a diameter of 1.75 mm. This filament is a thermoplastic polyurethane elastomer material that has flexible and durable properties, making it suitable for applications that require mechanical resistance and elasticity, such as speed bumps [22]. The printing process was carried out using an Ender-3 Pro 3D printer, which is known for its precise and reliable printing capabilities for flexible materials.
The test specimens were made with an infill density setting of 100%, meaning that the entire volume of the specimen was completely filled to ensure optimal strength. The printer bed temperature was set at 60 °C to ensure good adhesion between the filament base layer and the printing surface, with the infill pattern used being concentric, which provides a stable structure and is resistant to deformation.
This study tested three main parameters in the printing process, namely printing temperature, print speed, and layer height. Each parameter was tested at three levels of variation, as shown in Table 1, to explore its effect on the mechanical properties of the specimen. This variation aims to determine the optimal settings in the printing process, which is expected to improve the print quality and mechanical strength of the final product. With this structured and systematic approach, the study is expected to provide accurate and useful data for the development of eFlex TPU-95A material applications, especially in the context of 3D printing that requires flexible materials with superior mechanical qualities.

Table 1.
Process parameters and their levels.
The experimental design in this study used the Taguchi L9 Method (33), which is an experimental approach designed to optimize the process through different combinations of variables. This method was chosen because of its ability to reduce the number of experiments required, without sacrificing the validity of the results, by selecting a representative combination of parameters. Taguchi focuses on reducing variability in the process through efficient experimental design, which can ultimately identify key factors that affect the quality of the printed results [23,24].
In the Taguchi L9 design used, nine combinations of experiments were applied based on three main variables of the printing process, namely printing temperature, printing speed, and layer height, with each variable having three levels of variation. These settings are listed in Table 2, which describes the details of the levels of variation for each parameter. This design allows for efficient analysis of the effect of each parameter on the mechanical properties of the printed specimens, such as hardness, tensile strength, and ductility.

Table 2.
Three-dimensional printing process parameter design with Taguchi L9 (33) method.
To ensure the accuracy and kink of the data, each experiment was carried out three times. This step was taken to minimize experimental errors and produce more robust and reproducible data. Thus, this study is expected to identify the optimal combination of process parameters for the tensile strength and hardness of 3D printing products using TPU95A filament.
2.2. Tensile Test
Tensile testing was carried out in accordance with the JIS K6251-2017 standard [25], which is designed to test the tensile properties of elastomeric materials and the like [26,27]. The test specimens in this study were made following the standard dimensions and shapes, as shown in Figure 2. Each process parameter produced three test specimens, so that the total number of specimens tested reached an adequate number to ensure the accuracy and validity of the results. This approach was taken to reduce data variation and obtain more representative information on the mechanical properties of the material [28].
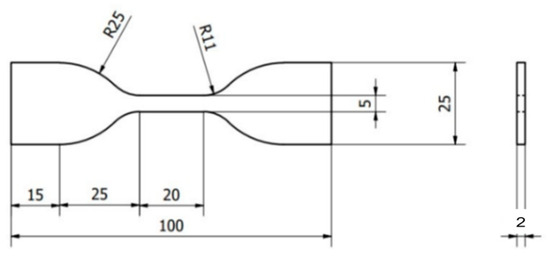
Figure 2.
JIS K6251-2017 Tensile Test Specimen Dimensions (mm).
The tests were conducted using a Shimadzu AGS-X 10 kN tensile testing machine (Shimadzu Corporation, Kyoto, Japan), which is capable of measuring tensile forces up to 10 kN with a high degree of accuracy. The machine was operated at a test speed of 100 mm/min, which is an appropriate testing speed for elastomeric materials [29]. This speed was chosen to ensure that the deformation of the specimens was measurable and consistent across all specimens tested.
2.3. Hardness Test
Hardness testing was carried out based on the ASTM D2240 standard [30], which is used to measure the hardness of elastomeric materials using the Shore A method. In this study, test specimens were made with dimensions of 20 × 20 mm and a minimum thickness of 6 mm, according to the standard specifications shown in Figure 3. This standard was chosen because of its relevance and accuracy in measuring the hardness of thermoplastic elastomeric materials such as eFlex TPU-95A, used in this study [31,32].
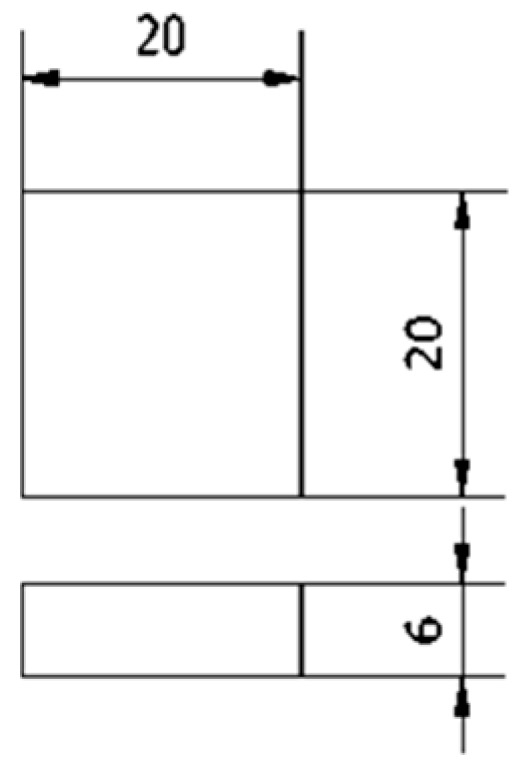
Figure 3.
ASTM D2240 hardness test specimen design.
Hardness testing was carried out using a Digital Shore A Durometer (Shenzhen Graigar Technology Co., Ltd., Shenzhen, China), as shown in Figure 4a; this is a tool that has a high level of accuracy with a measurement resolution of up to 0.01 Shore A. The testing step begins by ensuring that the test specimen is clean and free from dirt that can affect the test results [33]. The specimen is then placed on a flat surface to ensure stability during the measurement process. The durometer is calibrated before use to ensure that the test results are valid and reliable. Next, the indenter on the durometer is pressed perpendicular to the surface of the specimen, ensuring that the indenter is perfectly embedded in the surface of the material. This test is carried out at five different points on the surface of the specimen, with a distance between measurement points of at least 6 mm as illustrated in Figure 4b [34,35].
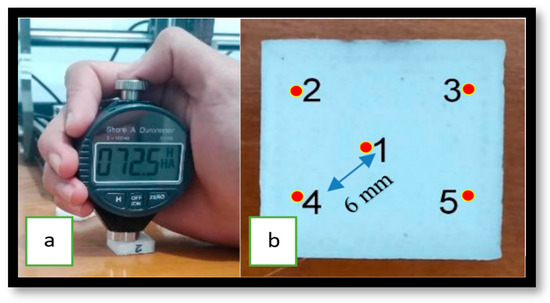
Figure 4.
Hardness testing: (a) testing using the shore a digital durometer, (b) illustration of test points.
Measurements at multiple points were performed to ensure that the test results represent the material hardness evenly, avoiding local variations that may occur due to material inhomogeneity or specimen surface irregularities. The results from each measurement point were then averaged to obtain the final hardness value of each specimen. With this method, the study aims to accurately evaluate the hardness of the eFlex TPU-95A material, which will later be correlated with the molding process parameters in the analysis of the mechanical properties of the product.
3. Results and Discussion
This section summarizes the key findings from the hardness and tensile tests conducted on the specimens, which were manufactured using a 3D printer with TPU-95A filament. The collected data is analyzed to assess the influence of printing parameters on the material’s mechanical properties. The analysis focuses on understanding how variables such as printing speed, temperature, and layer height impact the hardness and toughness of the specimens. To enhance clarity, the results are supported by statistical analysis and visual representations, including tables and figures, providing a comprehensive overview of the findings.
3.1. Analysis of Test Results
The tensile test results offer valuable insights into the material’s tensile strength, elongation at break, and ductility. The analysis evaluates the maximum force the specimens can endure and the extent of elongation before failure. The impact of different printing parameters—such as temperature, speed, and layer height—on these mechanical properties is carefully assessed.
Trends and variations in tensile strength and elasticity were identified to determine the optimal printing settings that balance strength and flexibility. The data from the tensile tests, presented in Table 3, include the average results from three repetitions for each specimen. This repetition ensures the consistency and accuracy of the test outcomes. The measured values encompass the tensile strength (maximum force the material can withstand) and elongation at break (percentage elongation before failure).

Table 3.
Tensile strength results.
Variations in the results demonstrate the influence of printing parameters like temperature, printing speed, and layer height on the material’s mechanical behavior, providing a foundation for optimizing 3D printing processes.
In Table 3, based on the analysis of the table, the lowest tensile strength was observed in Sample 1, with an average value of 251.06 kg/cm2, while the highest tensile strength was recorded in Sample 9, with an average value of 329.02 kg/cm2. This increase in tensile strength correlates with changes in the printing parameters, such as the printing temperature, speed, and layer height, which collectively enhance the density and structural quality of the material.
The strong correlation between tensile strength and toughness in eFlex TPU-95A suggests that optimizing printing parameters can significantly enhance its mechanical performance, making it better suited for applications requiring a balance of durability and flexibility. Further detailed analysis, including statistical testing, is needed to examine the impact of individual process parameters on these mechanical properties and to validate the observed differences between samples.
Overall, the data highlights a clear trend: samples with a higher tensile strength tend to also exhibit greater toughness. Sample 9 stands out as the best-performing material, showing the highest tensile strength and toughness. This underscores the importance of fine-tuning process parameters such as the printing temperature, speed, and layer height to achieve optimal 3D printing results for applications requiring both strength and flexibility.
In Figure 5, raising the printing temperature from 220 to 240 significantly improves performance, making it the most critical factor. Increasing the print speed from 70 to 90 results in a moderate enhancement. The optimal layer height is around 0.20, with a slight drop in performance beyond this point.
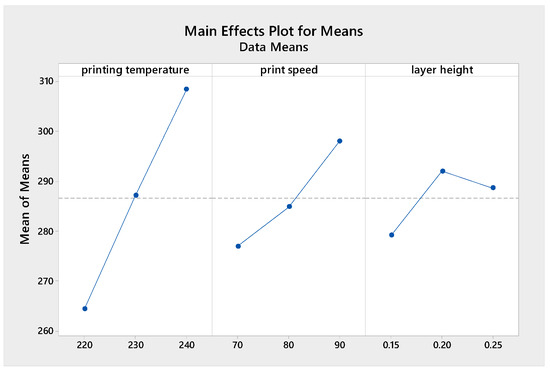
Figure 5.
Optimal factor level for tensile test results.
In Figure 6, For S/N ratios, higher temperatures enhance process consistency, while an increased print speed leads to steady but smaller improvements. A layer height of 0.20 remains the most effective, ensuring both stability and performance.
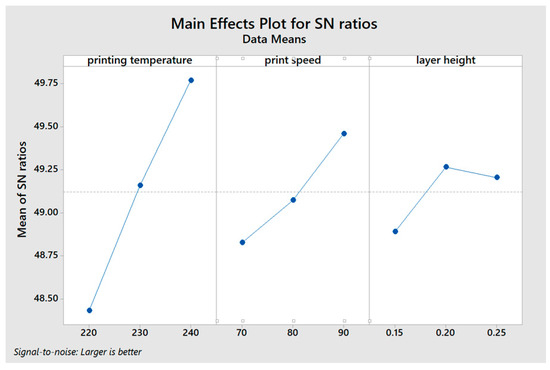
Figure 6.
Combined response optimal level for tensile test results.
Overall, the printing temperature has the strongest influence on both performance and consistency. The print speed has a moderate positive effect, while a layer height of 0.20 offers the best balance.
3.2. Hardness Test Results
Hardness testing was conducted to evaluate the surface durability and scratch resistance of the eFlex TPU-95A material. The objective was to examine how variations in printing parameters, such as temperature, speed, and layer height, influence the hardness of the printed product. The summarized hardness test results are shown in Table 3, displaying hardness values measured at five different points for each sample and the average hardness value for each specimen.
The results reveal notable differences in hardness across the samples, indicating the significant impact of changing process parameters. For instance, the minimum hardness value was observed in Sample 3, with an average hardness of 63.5 Shore A, while the maximum hardness value was recorded in Sample 6, with an average of 74.9 Shore A. This variation highlights the direct relationship between printing parameters and the resulting material hardness.
These differences in hardness play a crucial role in evaluating the mechanical performance of 3D-printed products, particularly for applications requiring specific combinations of flexibility and durability, such as speed bumps. The sensitivity of the eFlex TPU-95A material to parameter changes is evident from the observed variations. By analyzing these results, the relationship between printing parameters and material hardness can be determined, ensuring the product’s suitability for applications demanding both resilience and flexibility.
Both the tensile and hardness test results provide complementary data, offering a holistic understanding of how 3D printing parameters influence the mechanical properties of eFlex TPU-95A specimens.
The Table 4 displays the results of hardness tests conducted on nine samples. Hardness measurements were taken at five distinct points on each sample’s surface, and the average hardness, expressed in Shore A units, was calculated for each sample. According to the data, Sample 3 exhibited the lowest average hardness value of 63.5 HA, indicating the lowest abrasion resistance among the tested samples. This is likely due to the use of high printing speeds and lower printing temperatures, which may have resulted in a less dense material structure. Conversely, samples manufactured under specific process conditions demonstrated higher hardness levels, with Sample 6 achieving the highest average hardness. This improvement could be attributed to higher printing temperatures and greater layer heights, which enhance material cohesion during printing.

Table 4.
Hardness test results.
Variations in hardness values across measurement points were observed within individual samples. For instance, Sample 3 showed a range from 62 (Point 2) to 66 (Point 3), whereas Sample 6 displayed a narrower range of 73 to 78. These differences highlight the influence of the printing process on the uniformity of the material’s mechanical properties.
The variation in hardness values among samples reflects the impact of differing manufacturing parameters, which significantly affect the final material’s strength. Higher hardness values indicate a material that is more resistant to deformation, while lower hardness values suggest greater flexibility. Understanding this variability is crucial for applications that demand a balance of strength and flexibility, such as speed bumps made from eFlex TPU-95A filament.
Overall, the hardness test results underscore the critical role of printing parameters in shaping the mechanical properties of 3D-printed materials. Optimizing these parameters is essential to achieve the desired hardness levels. The data further highlight significant differences in hardness across samples, emphasizing the influence of process parameters. Sample 6 emerged as the top-performing material in terms of hardness, while Sample 3 ranked lowest. These findings provide valuable guidance for refining 3D printing settings to optimize the mechanical performance of printed products.
In Figure 7 and Figure 8, the Main Effects Plots for Means and Signal-to-Noise (S/N) Ratios reveal the influence of 3D printing parameters on material hardness. Optimal results are achieved with a printing temperature of 240 °C, a print speed of 80 mm/s, and a layer height of 0.1 mm. As the temperature increases, material hardness improves, reaching a steady point at 240 °C. A print speed of 80 mm/s strikes the ideal balance between hardness and consistency. Additionally, a smaller layer height of 0.1 mm enhances both hardness and reliability. These results underscore the necessity of fine-tuning 3D printing parameters to optimize material properties.
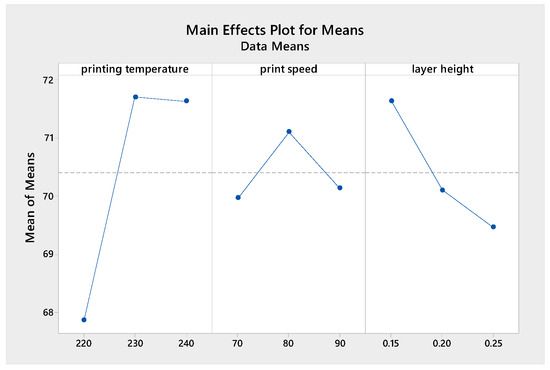
Figure 7.
Optimal factor level for hardness test results.
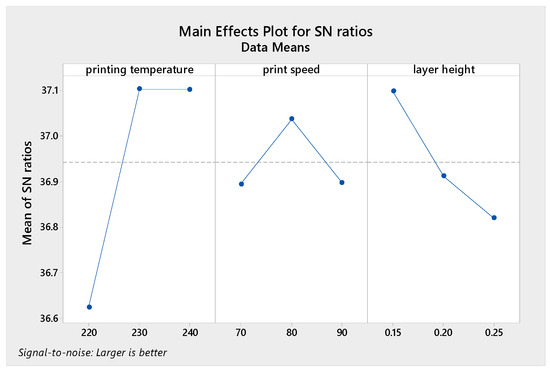
Figure 8.
Combined response optimal level for hardness test results.
In Figure 9 and Figure 10, the image features two Main Effects Plots, with the Means plot on the left and the Signal-to-Noise (S/N) Ratios plot on the right. These graphs illustrate how the printing temperature, print speed, and layer height affect the mechanical properties of 3D-printed materials, particularly hardness and tensile strength. Raising the printing temperature from 220 °C to 240 °C significantly enhances both the mean values and S/N ratios, indicating improved material hardness and tensile strength with greater consistency. Print speed also has an impact, with increases from 70 mm/s to 90 mm/s leading to a steady rise in mean values. However, the S/N ratio plot suggests that 80 mm/s is the most effective setting, as stability slightly decreases beyond this speed.
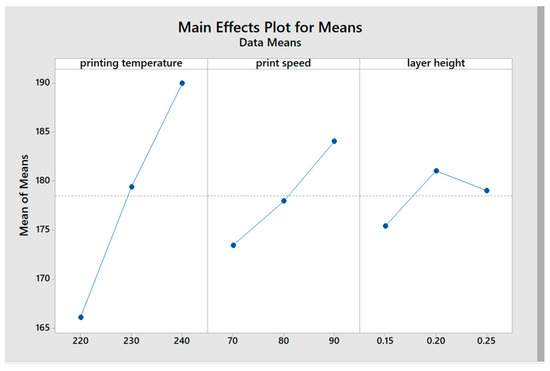
Figure 9.
Optimal factor level for hardness test and tensile test results.
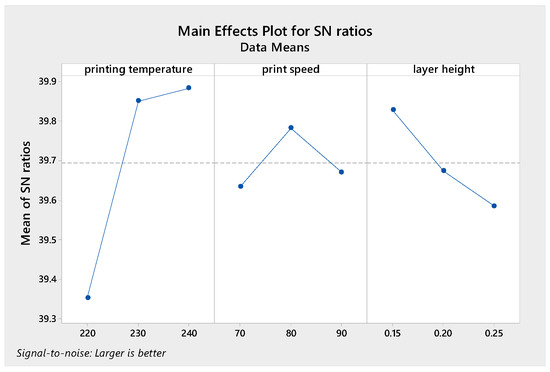
Figure 10.
Combined response optimal level for hardness test and tensile test results.
Layer height is another key factor in material performance. The Means plot shows that hardness and tensile strength increase up to 0.20 mm but experience a slight decline at 0.25 mm. The S/N ratio plot indicates that 0.15 mm ensures the highest stability, while 0.20 mm remains a viable choice, though 0.25 mm reduces consistency. This suggests that an optimal layer height falls between 0.15 mm and 0.20 mm for achieving both strength and reliability.
Overall, printing temperature has the greatest influence, with 240 °C providing the best mechanical properties. A print speed of 80 mm/s ensures a balance between strength and consistency, while a layer height between 0.15 mm and 0.20 mm optimizes both hardness and stability. These results emphasize the importance of refining 3D printing parameters to enhance material performance in both hardness and tensile tests.
4. Optimizing Parameters Using the Taguchi Method: Table Analysis
4.1. Analysis of Variance (ANOVA)
The Analysis of Variance (ANOVA) method was applied to assess the significance of various 3D printing parameters—such as temperature, printing speed, and layer height—on the mechanical performance of the eFlex TPU-95A samples. By quantifying each parameter’s contribution to the overall variability in the results, ANOVA identifies the factors with the greatest influence on tensile strength, ductility, and hardness.
The table data reveals noticeable differences in tensile strength and hardness across the samples. These variations can be attributed to changes in the printing parameters, as summarized below: Temperature plays a vital role in material cohesion and bonding, leading to improved tensile strength and hardness. Sample 9 achieved the highest values, emphasizing the importance of selecting the right temperature settings. Printing speed influences the cooling rate and interlayer adhesion, with slower speeds generally enhancing bonding and mechanical properties. Layer height is another crucial factor in material structure, as smaller layer heights result in a denser and more uniform composition, leading to increased tensile strength and hardness.
4.2. Identifying Optimal Parameters
Samples 6 and 9 showed the best mechanical properties—Sample 6 had the highest hardness, while Sample 9 had a superior tensile strength—indicating that a high printing temperature, moderate speed, and low layer height improve performance. In contrast, Sample 3 showed the weakest properties due to its high speed and low temperature. The Taguchi method was used to identify optimal printing parameters through an orthogonal array and signal-to-noise (S/N) analysis, balancing strength, hardness, and ductility for optimal material performance.
Based on the findings, the recommended settings for enhancing mechanical properties include maintaining a high printing temperature similar to that of Samples 6 and 9, reducing the print speed to improve interlayer bonding, and using a smaller layer height to increase material density and surface quality. Implementing these modifications can maximize the material’s mechanical performance, achieving an optimal balance of strength and flexibility for applications such as speed bumps and other load-bearing components.
5. Conclusions
This research investigated how 3D printing parameters such as temperature, print speed, and layer height affect the mechanical properties of eFlex TPU-95A, with the Taguchi Method applied to optimize these factors. The findings showed that increasing the temperature, reducing the print speed, and decreasing the layer height significantly enhanced both tensile strength and hardness. Sample 9 recorded the highest tensile strength at 329.02 kg/cm2, while Sample 6 had the greatest hardness at 74.9 HA. The mechanical properties of the samples were found to be highly responsive to variations in the printing parameters, emphasizing the need for careful control to ensure consistent results and performance. The Taguchi Method proved effective in identifying the best combinations of parameters, highlighting the effectiveness of structured methods in improving material properties for specific uses.
Author Contributions
D.M. was the main conceptor and designer of the research idea, A.A. and A.R.M.A. collected the test material data. M.Y.M. and L.A.I. conducted the analysis and reviewed the existing research materials. All authors have read and agreed to the published version of the manuscript.
Funding
This research was funded by Nusa Putra University through the Nutral project amounting to Rp. 15,000,000.
Institutional Review Board Statement
Not applicable.
Informed Consent Statement
Informed consent was obtained from all subjects involved in the study.
Data Availability Statement
The data is not publicly available due to privacy or ethical restrictions.
Conflicts of Interest
The authors declare no conflict of interest.
References
- Yu, S.; Liu, H.; Zhao, G.; Zhang, H.; Hou, F.; Xu, K. A code-based method for carbon emission prediction of 3D printing: A case study on the fused deposition modeling (FDM) 3D printing and comparison with conventional approach. J. Clean. Prod. 2024, 484, 144341. [Google Scholar] [CrossRef]
- Moradi, M.; Meiabadi, M.S.S.; Siddique, U.; Salimi, N.; Farahani, S. Circular economy-driven repair of 3D printed Polylactic Acid (PLA) by Fused Deposition Modelling (FDM) through statistical approach. Mater. Today Commun. 2025, 42, 111264. [Google Scholar] [CrossRef]
- Nadhif, M.H.; Ghiffary, M.M.; Irsyad, M.; Mazfufah, N.F.; Nurhaliza, F.; Rahman, S.F.; Rahyussalim, A.J.; Kurniawati, T. Anatomically and biomechanically relevant monolithic total disc replacement made of 3D-printed thermoplastic polyurethane. Polymers 2022, 14, 4160. [Google Scholar] [CrossRef]
- Popescu, D.; Zapciu, A.; Amza, C.; Baciu, F.; Marinescu, R. FDM process parameters influence over the mechanical properties of polymer specimens: A review. Polym. Test. 2018, 69, 157–166. [Google Scholar] [CrossRef]
- Valerga, A.P.; Batista, M.; Salguero, J.; Girot, F. Influence of PLA filament conditions on characteristics of FDM parts. Materials 2018, 11, 1322. [Google Scholar] [CrossRef] [PubMed]
- Borah, J.; Chandrasekaran, M. Evaluation of tensile strength of 3D printed PLA component and Taguchi optimization. Neuro Quantol. 2022, 20, 1714–1726. [Google Scholar]
- Dong, H.; Wang, H.; Hazell, P.J.; Sun, N.; Dura, H.B.; Escobedo-Diaz, J.P. Effects of Printing Parameters on the Quasi-Static and Dynamic Compression Behaviour of 3D-Printed Re-entrant Auxetic Structures. Thin-Walled Struct. 2025, 210, 113000. [Google Scholar] [CrossRef]
- Wang, Q.; Han, S.; Yang, J.; Li, Z.; An, M. Optimizing printing and rheological parameters for 3D printing with cementitious materials. Autom. Constr. 2025, 169, 105881. [Google Scholar] [CrossRef]
- Hamidi, M.N.; Abdullah, J.; Mahmud, A.S.; Hassan, M.H.; Zainoddin, A.Y. Influence of Thermoplastic Polyurethane (TPU) and Printing Parameters on The Thermal and Mechanical Performance of Polylactic Acid (PLA)/Thermoplastic Polyurethane (TPU) Polymer. Polym. Test. 2025, 143, 108697. [Google Scholar] [CrossRef]
- Hikmat, M.; Rostam, S.; Ahmed, Y.M. Investigation of tensile property-based Taguchi method of PLA parts fabricated by FDM 3D printing technology. Results Eng. 2021, 11, 100264. [Google Scholar] [CrossRef]
- Madani, T.; Boukraa, M.; Aissani, M.; Chekifi, T.; Ziadi, A.; Zirari, M. Experimental investigation and numerical analysis using Taguchi and ANOVA methods for underwater friction stir welding of aluminium alloy 2017 process improvement. Int. J. Press. Vessel. Pip. 2023, 201, 104879. [Google Scholar] [CrossRef]
- Ramesh UdhayaKumar, A.; Satish Kumar, S. Multiobjective optimization of electric discharge machining of an Al–SiCp composite using the Taguchi–PCA method as well as the firefly and cuckoo search algorithms. Trans. Can. Soc. Mech. Eng. 2022, 46, 503–523. [Google Scholar] [CrossRef]
- Parthiban, V.; Vijayakumar, S.; Sakthivel, M. Optimization of high-speed turning parameters for Inconel 713C based on Taguchi grey relational analysis. Trans. Can. Soc. Mech. Eng. 2019, 43, 416–430. [Google Scholar] [CrossRef]
- Mardiyana, D.; Sumarno, D.I.; Yudono, M.A.S.; Islami, L.A. Kajian Kelayakan Sifat Mekanik Produk 3D Printing FDM Berfilamen eFlex TPU-95A untuk Aplikasi Polisi Tidur. J. Rekayasa Mesin 2024, 19, 457–468. [Google Scholar] [CrossRef]
- Konan, F.K.; Hartiti, B.; Batan, A.; Aka, B.; Fadili, S.; Thevenin, P. Zinc oxide texture-(0 0 2) nanomaterials prepared by sol–gel process via Taguchi method L9 (34). Mater. Today Proc. 2024; in press. [Google Scholar]
- Gurugubelli, S.; Chekuri, R.B.R.; Penmetsa, R.V. Experimental investigation and optimization of turning process of EN8 steel using Taguchi L9 orthogonal array. Mater. Today Proc. 2022, 58, 233–237. [Google Scholar] [CrossRef]
- Olubunmi, B.E.; Karmakar, B.; Aderemi, O.M.; Auta, M.; Halder, G. Parametric optimization by Taguchi L9 approach towards biodiesel production from restaurant waste oil using Fe-supported anthill catalyst. J. Environ. Chem. Eng. 2020, 8, 104288. [Google Scholar] [CrossRef]
- Pratama, W.H. Optimasi Parameter Proses 3D Printing Terhadap Kuat Tarik Material Filamen PLA+ Menggunakan Metode Taguchi. Sprocket J. Mech. Eng. 2021, 3, 39–45. [Google Scholar] [CrossRef]
- Ma, W.; Liu, H.; Wang, G.; Xiao, J. An elastodynamic modeling approach based on experimental substructuring for a mobile hybrid robot. Mech. Mach. Theory 2025, 205, 105892. [Google Scholar] [CrossRef]
- Waly, N.M.; Hassan, H.; Murata, R.; Sailor, D.J.; Mahmoud, H. Experimental approach to reduce uncertainty in estimating the thermal performance of buildings’ envelopes in hot climates. Dev. Built Environ. 2025, 21, 100589. [Google Scholar] [CrossRef]
- Sharma, S.; Dvivedi, A. On material removal analysis of simultaneous electrochemical and electrodischarge machining process through analytical, numerical and experimental approaches. J. Manuf. Process. 2025, 135, 204–215. [Google Scholar] [CrossRef]
- Spoerk, M.; Savandaiah, C.; Arbeiter, F.; Sapkota, J.; Holzer, C. Optimization of mechanical properties of glass-spheres-filled polypropylene composites for extrusion-based additive manufacturing. Polym. Compos. 2019, 40, 638–651. [Google Scholar] [CrossRef]
- Karuniawan, B.W.; Rachman, F.; Yoningtias, M.T. Optimasi Parameter Mesin Printer 3d Terhadap Kekasaran Permukaan Produk Material Abs Menggunakan Metode Taguchi. Austenit 2022, 14, 61–68. [Google Scholar] [CrossRef]
- Riza, E.I.; Budiyantoro, C.; Nugroho, A.W. Peningkatan kekuatan lentur produk 3d printing berbahan petg dengan optimasi parameter proses menggunakan metode Taguchi. Media Mesin Maj. Tek. Mesin 2020, 21, 66–75. [Google Scholar] [CrossRef]
- JIS K6251-2017; Rubber, Vulcanized or Thermoplastic-Determination of Tensile Stress-Strain Properties. Japanese Standards Association: Tokyo, Japan, 2017.
- Chaussé, J.; Girard, V.-D.; Perron, T.; Challut, T.; Vermette, P. Characterization of bacterial cellulose produced by the KomEt strain isolated from a kombucha SCOBY. Biocatal. Agric. Biotechnol. 2024, 58, 103172. [Google Scholar] [CrossRef]
- Appadu, S.; Ting, T.M.; Ratnam, C.T.; Ahmad, S.; Chen, R.S.; Gohs, U. Effect of Radiation Sensitizer on the Friction, Mechanical and Thermal Degradation Properties of Electron Beam cured FKM-PTFE Composite. Radiat. Phys. Chem. 2024, 223, 111875. [Google Scholar] [CrossRef]
- Wullur, C.W.; Andriyono, A. Analisis Perbandingan Kekuatan Tarik Roller Chain (Suzuki Genuine Parts) dan (Indoparts) Satria FU 150. Mustek Anim HA 2019, 8, 132–140. [Google Scholar] [CrossRef]
- Saputra, R.S.; Khoirudin, K.; Karyadi, K.; Hidayat, S.T.; Cahyo, T.D.; Ramadan, T. Optimasi Uji Tegangan Tarik Pengelasan Tungsten Inert Gas pada Penggabungan Beda Material Baja Galvanish (SGCC) dengan Baja Karbon Rendah (SPCC-SD). J. Rekayasa Energi dan Mek. 2024, 4, 36. [Google Scholar] [CrossRef]
- ASTM D2240-15 (2021); Standard Test Method for Rubber Property—Durometer Hardness. ASTM International: West Conshohocken, PA, USA, 2021.
- Palacios, P.A.; Velazquez, A.; Zelaya, R.; Patterson, A.E. Shore hardness of as-printed and dehydrated thermoplastic materials made using fused filament fabrication (FFF). Mater. Today Commun. 2023, 35, 105971. [Google Scholar]
- Ayyanar, C.B.; Marimuthu, K.; Helaili, S. Experimental evaluation and numerical comparisons of pine tree leaves, graphene oxide loaded, and E-glass fiber reinforced sandwich composites. Int. J. Polym. Anal. Charact. 2024, 29, 363–384. [Google Scholar] [CrossRef]
- Mohamed, S.B.; Anandhavasan, S.; Ahamed, S.B.; Ajayharish, R.; Barathraj, B.; Hariprakash, R.; Ravichandran, M.; Kaviarasu, C. Investigation on mechanical properties of hybrid polymer composites for automobile applications. Mater. Today Proc. 2023, 74, 73–79. [Google Scholar] [CrossRef]
- Gonçalves, N.I.; Pierre, F.Z.; Borges, A.L.S.; da Silva, J.M.F.; Uemura, E.S. Analyzing SHORE A hardness to assess the durability of soft denture lining materials. Braz. Dent. Sci. 2023, 26, e3986. [Google Scholar] [CrossRef]
- Binyamin, B.; Nurrokayati, A.S.; Prasetyo, B.B.; Rahman, S.F.; Febriantoko, B.W. Rekayasa Pembuatan Kampas Rem Berbahan Dasar Serbuk Tempurung Kelapa Bermatriks Phenolic Resin Terhadap Performa Gesek Pengereman. Traksi 2020, 19, 104–120. [Google Scholar]
Disclaimer/Publisher’s Note: The statements, opinions and data contained in all publications are solely those of the individual author(s) and contributor(s) and not of MDPI and/or the editor(s). MDPI and/or the editor(s) disclaim responsibility for any injury to people or property resulting from any ideas, methods, instructions or products referred to in the content. |
© 2025 by the authors. Licensee MDPI, Basel, Switzerland. This article is an open access article distributed under the terms and conditions of the Creative Commons Attribution (CC BY) license (https://creativecommons.org/licenses/by/4.0/).